Article Text

Abstract
BACKGROUND Sputum induction is an important non-invasive technique for measuring airway inflammation in asthma. Cell numbers are often too low for flow cytometric analysis. Laser scanning cytometry (LSC) is a novel technique that allows objective multicolour fluorescence analysis of cells on a microscope slide.
METHODS LSC was used to determine sputum eosinophil and bronchial epithelial cell counts. We first confirmed that we could measure eosinophil counts accurately in peripheral blood using α-major basic protein (MBP) immunofluorescent staining. Sputum induction was performed according to standard protocols. Sputum samples from eight normal controls and 12 asthmatic patients were analysed by LSC and manual counting by two independent observers. Octospot cytospins were fixed and stained with mouse-α-human-MBP monoclonal antibody or mouse-α-human-cytokeratin antibody and goat-α-mouse Oregon Green conjugated second antibody.
RESULTS Sputum induction provided a mean (SE) of 0.99 (0.2) × 106 cells per donor. More than 3000 cells on three cytospins per slide were analysed per cell type. The intraclass correlation coefficient (R) and standard deviation (SD) of differences in eosinophils determined by manual counting and LSC were 0.9 and 2.1, respectively, and for bronchial epithelial cell counts they were 0.7 and 2.0. Selective detection of labelled cells was confirmed visually after relocation.
CONCLUSION Eosinophils and bronchial epithelial cells can be accurately and reproducibly counted in an objective manner. LSC is therefore a potentially powerful new method for immunophenotyping leucocytes and epithelial cells objectively in induced sputum in patients with asthma.
- laser scanning cytometry
- image analysis
- induced sputum
Statistics from Altmetric.com
In recent years sputum induction by hypertonic saline and subsequent selective processing has been refined as a non-invasive research tool providing important information about inflammatory events in the lower airways.1-4 Cellular and fluid markers of inflammation in sputum have been assessed in a number of studies and their validity, repeatability, and responsiveness have been demonstrated.5 Sputum eosinophil counts as a marker of asthmatic airway inflammation have the potential for aiding diagnosis and monitoring the treatment response to steroids in patients with asthma. Pizzichini et al concluded that the proportion of eosinophils in sputum is a more accurate marker of asthmatic airway inflammation than blood eosinophil counts or serum levels of eosinophil cationic protein (ECP).6 However, manual differential counting of sputum cytospins is tedious to perform and, although based on objective morphological criteria, is characterised by within and between observer variability making a more objective assay desirable.
More detailed analysis of sputum cells by flow cytometry, however, has proved difficult due to the limited number of particular cell subsets obtained by sputum induction and generally poor cell preservation.7 ,8 The laser scanning cytometer (LSC) (CompuCyte Corporation, Cambridge, Massachusetts, USA) is a novel microscope linked and computer operated instrument that measures fluorescence and light scatter of cells labelled with fluorescent probes on a microscope slide.9 ,10 The slide is held on a stage that is moved past a laser beam by a high precision stepper motor. In addition to multicolour cytometric analysis equivalent to flow cytometry, this configuration offers several tangible advantages. Very small cell numbers can be analysed repeatedly as effectively no cell loss occurs during the scanning process. Because the exact position of each cell on the slide is recorded as part of the data file, accurate relocation and microscopic visualisation of analysed cells and features is possible. Following fluorescent data acquisition the same slide can be stained with chromatic dyes or histochemical techniques and previously analysed cells can be visualised and categorised according to morphological criteria. Thus, multiparameter cytometric analysis can be correlated with fluorescent or bright field images of cells of interest. These images can be captured by a charge coupled device (CCD) colour video camera for digital cataloguing and further work up by image analysis and processing software. Furthermore, pixel by pixel accurate laser scan images of the actual output of each photomultiplier tube during passage of the laser beam over cells of interest can be generated. Developed originally for the analysis of cancer cells, the use of the LSC has been largely restricted to cancer cytology.11
The primary objective of this study was to analyse the agreement between LSC and manual counts for the measurement of eosinophils and epithelial cells in induced sputum in normal subjects and asthmatic patients. A secondary objective of the study was to compare the variability of different cytospins of the same sputum sample for manual and LSC counting.
Methods
SUBJECTS
For analysis of peripheral blood eosinophils nine patients with a range of peripheral blood eosinophil counts were selected from a routine respiratory clinic. For analysis of induced sputum 12 asthmatic patients and eight normal subjects were identified. Asthmatic patients had symptoms consistent with asthma and airway hyperresponsiveness to methacholine (PC20 <8 mg/ml). Three asthmatic patients were receiving treatment with inhaled steroids, all others were receiving inhaled β agonists only or no treatment. Normal controls selected from members of staff at Glenfield Hospital had no symptoms of asthma and no signs of airway hyperresponsiveness to methacholine (PC20 >16 mg/ml). Informed consent was obtained from all participants and the study was approved by the local ethical committee.
METHACHOLINE CHALLENGE
Tests were performed following a standard protocol.12In brief, subjects were challenged with doubling doses of methacholine chloride given via a Wright’s nebuliser at a flow rate of 8 l/min starting at a concentration of 0.03 mg/ml and increasing to 16 mg/ml or until there was a fall of 20% in the forced expiratory volume in one second (FEV1).
ANALYSIS OF PERIPHERAL BLOOD EOSINOPHILS
Five ml samples of blood were obtained by venesection and transferred to a 15 ml tube filled with 0.5 ml dextran 6% and 50 units of heparin. Peripheral blood leucocytes were separated after 30 minutes of sedimentation. Cells were washed in phosphate buffered saline (PBS) and split into two tubes for simultaneous analysis on a Sysmex automated cell counter (Sysmex NE8000) and by LSC. For analysis by cell counter the cell concentration was adjusted to 5 × 10⁶/ml.
SPUTUM INDUCTION AND PROCESSING
Sputum was induced by sequential aerosol inhalation of 3%, 4%, and 5% saline as previously described.5 Briefly, sputum samples were collected in a sterile container and processed within two hours of expectoration. Sputum was manually selected from saliva using blunt forceps to minimise squamous cell contamination and processed on ice in four volumes of 0.1% dithiothreitol followed by four volumes of Dulbecco’s PBS. The cell suspension was filtered through 45 μm nylon gauze (Precision Textiles Ltd, Bury, UK) and centrifuged for 10 minutes at 800g at 4°C. Cell viability, oral squamous cell contamination, and absolute cell numbers were determined with trypan blue and the volume of the cell suspensions was adjusted for optimal cytospin dispersion with Dulbecco’s PBS to 0.25 × 10⁶/ml.
PREPARATION OF SPUTUM CYTOSPINS AND IMMUNOSTAINING
To accomplish time efficient analysis by LSC without the need for frequent slide replacement we used the novel Octospot cytospin system (Bath Analytical, Bath, UK; kindly provided by Life Sciences International, UK). This system is compatible with the Shandon cytocentrifuge and allows transfer of cell suspensions (40–80 μl per well) from eight well microtitre plate strips on to microscope slides, thus generating eight separate cytospins on a single slide. Octospot slides are covered with a solvent resistant hydrophobic coating surrounding each well allowing differential immunostaining of adjacent cytospins. 40 μl of sputum cell suspension (0.25 × 10⁶/ml) was added to each well and spun onto slides at 450 rpm for six minutes in a Shandon cytocentrifuge. Cytospins were air dried and frozen at –20°C until further analysis. After thawing slides were fixed in high grade acetone/methanol (50/50). Cytospins were circled with a hydrophobic wax marker to allow immunostaining of adjoining cytospins with 50 μl of antibody solutions. The slides were incubated at room temperature for one hour with mouse-α-human-MBP monoclonal antibody (Bradsure Biologicals, Loughborough, UK), mouse-α-human-cytokeratin antibody (Dako, Wycombe, UK), or isotype matched control antibody (Dako) in PBS + 0.1% bovine serum albumin (BSA). Each cytospin was washed with 20 volumes (1 ml) of PBS with simultaneous suction to avoid overflow and cross contamination between neighbouring cytospins. To reduce non-specific binding of fluorochrome conjugated second antibody to highly charged eosinophil proteins13 ,15 cytospins were blocked with Chromotrope 2R (Sigma, Poole, UK) for 15 minutes. This was followed by further washing and incubation with goat α-mouse-Oregon Green conjugated second antibody (20 μg/ml; Molecular Probes Europe BV) and propidium iodide 0.2 μg/ml for one hour at room temperature. Secondary labelling with Oregon Green conjugated antibody gave significantly brighter staining than fluorescein isothiocyanate conjugated antibody and specimens were less prone to photobleaching. Following final washing the slides were coverslipped with glycerol (25%) in PBS and analysed by LSC.
LSC SCANNING
The details of the scanning procedure are discussed in the results section. Briefly, slides were positioned on the microscope stage and scanned using the ×20 objective (Olympus UPlan Fl) and argon laser light at 5 mW.
MANUAL DIFFERENTIAL COUNTING
Single cytospins were prepared for chromatic staining and manual differential counting. Slides were stained with Romanowski’s stain and counted independently by two experienced observers blinded to the results of LSC scanning and the patients’ category. One observer (IDP) counted 200 cells and the other observer (RJW) counted 400 cells per cytospin. The intraclass coefficient for between observer repeatability was 0.9.14
To determine the variability in eosinophil and epithelial cell counts between different cytospins of the same sputum sample, seven cytospins each from two separate sputum samples were counted blind by one observer. Two further samples of 12 and 10 cytospins were analysed by LSC.
STATISTICAL ANALYSIS
Cell counts are presented as mean (SE) values and compared by ANOVA. Agreement was assessed by the method of Bland and Altman16 and expressed as the intraclass coefficient (R) + standard deviation (SD) of between method differences. The coefficient of variation of repeat cell counts was calculated as the ratio of mean and SD.
Results
DETECTION OF EOSINOPHILS AND BRONCHIAL EPITHELIAL CELLS BY LSC
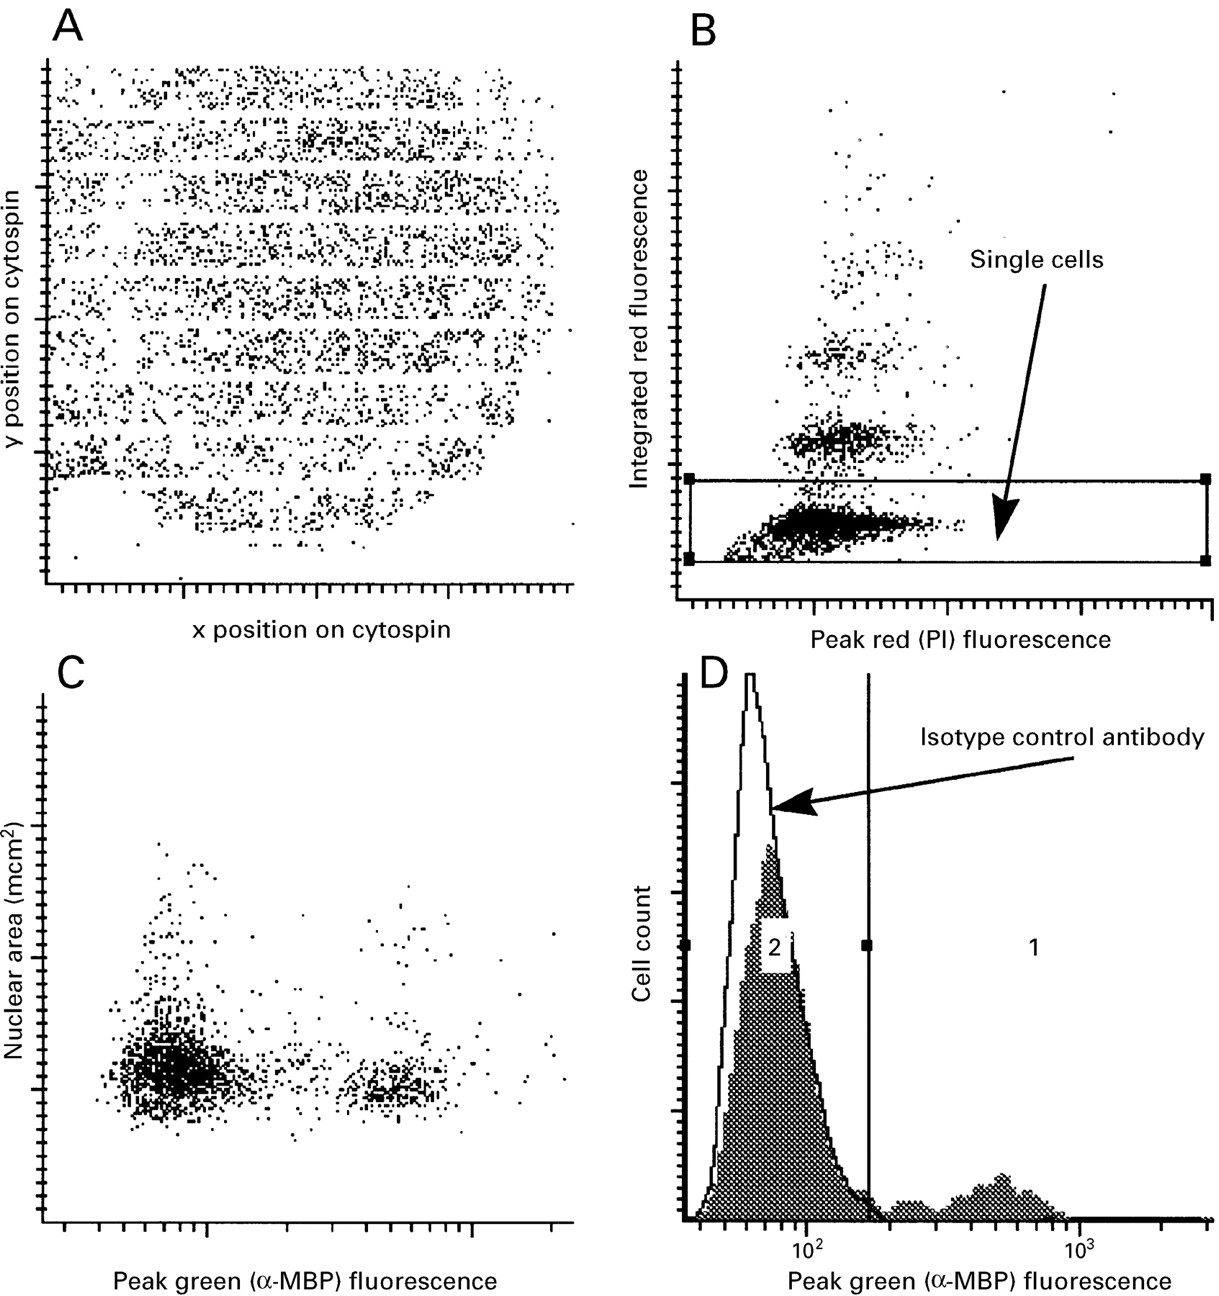
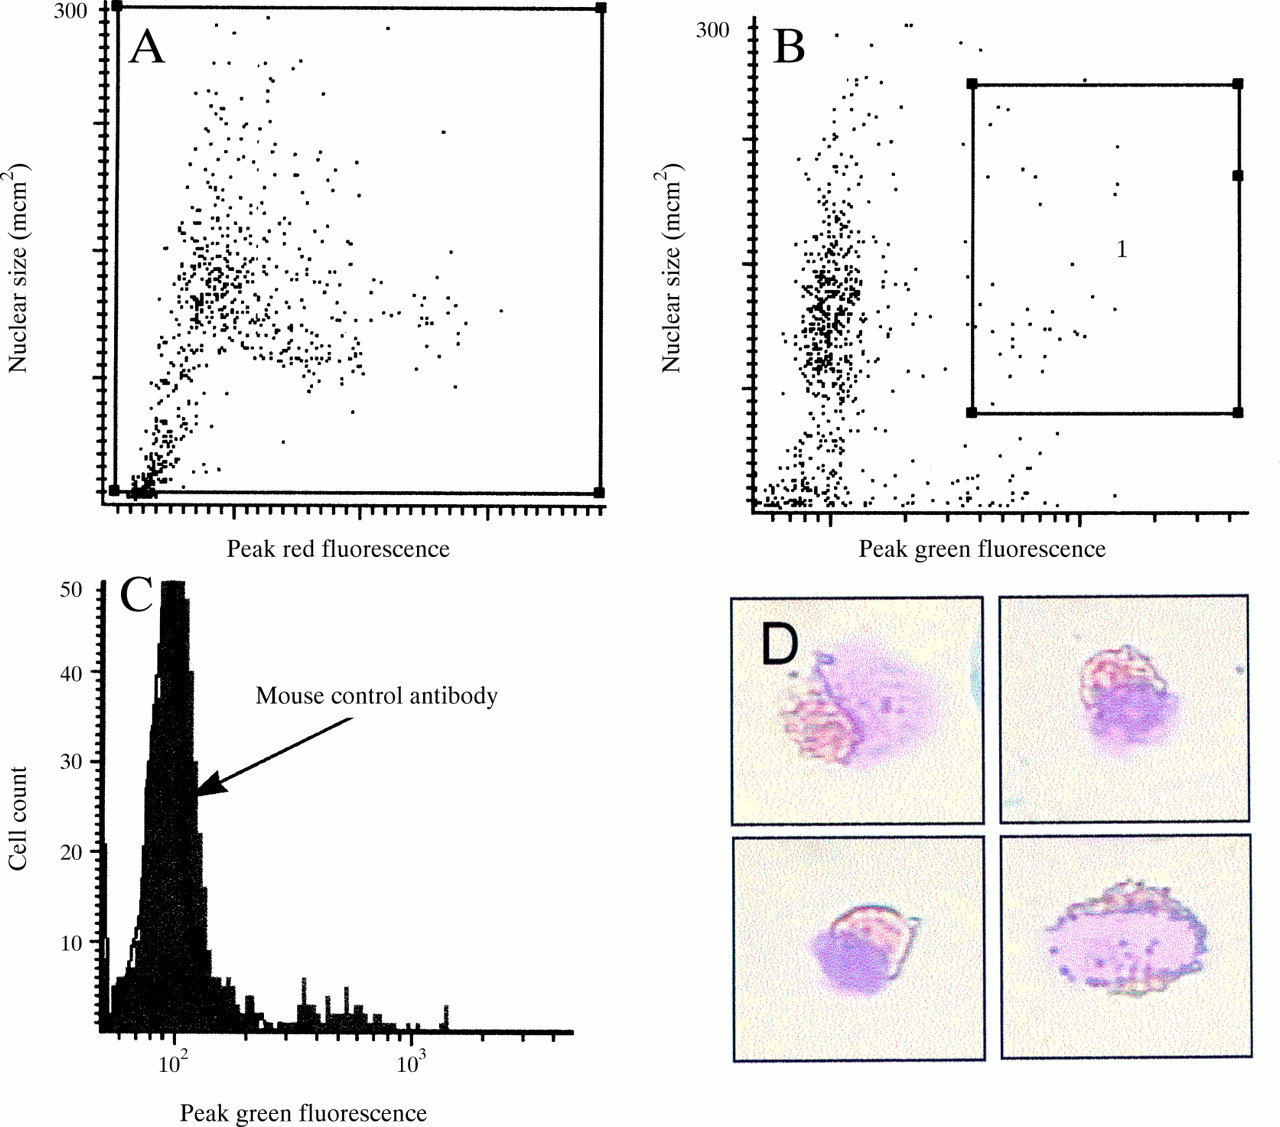
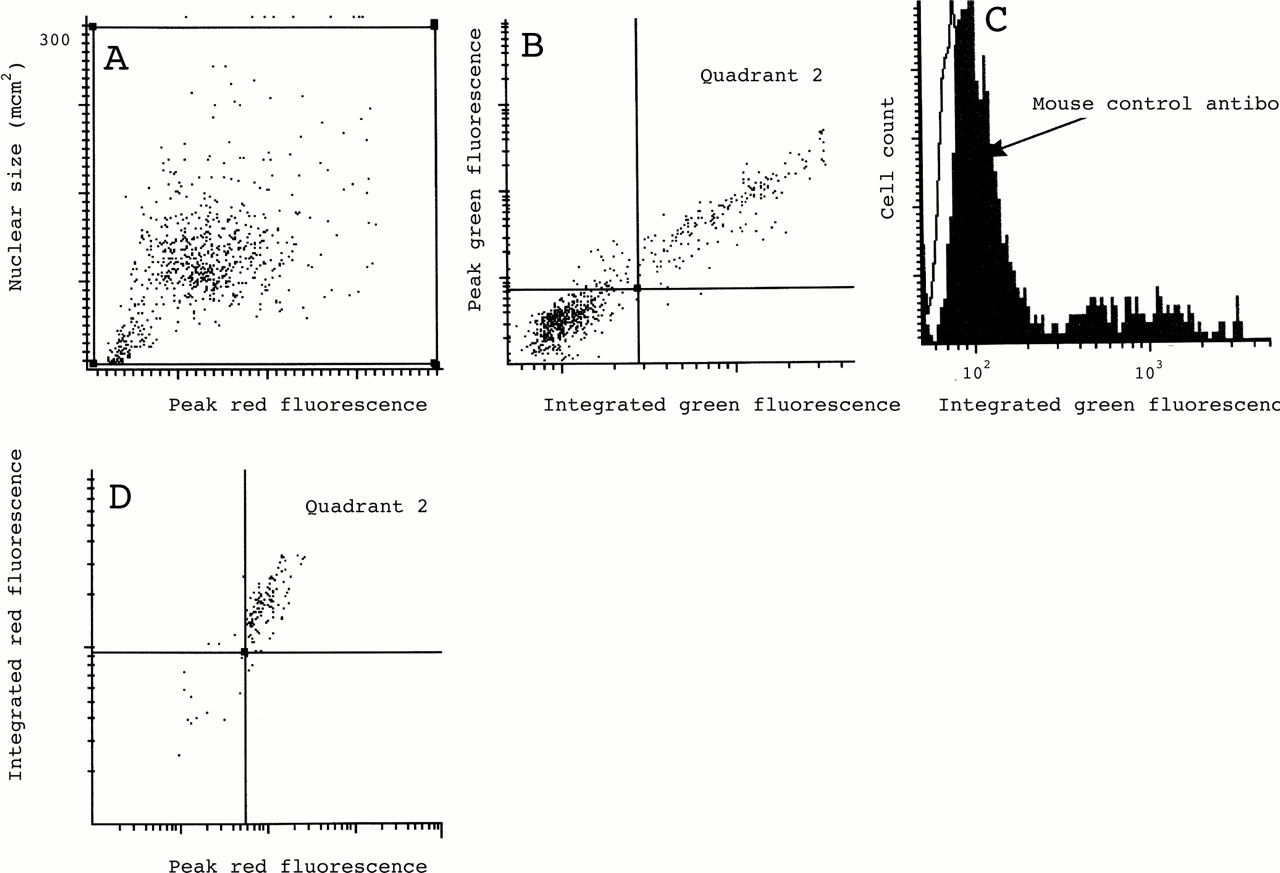
Our current instrument set up incorporates two photomultiplier tubes for the detection of green or red fluorescent signals and a scatter sensor (fig 1). In order to calculate the proportion of a particular cell subset as a percentage of the total we labelled the blood and sputum samples with propidium iodide and used its bright red nuclear staining pattern for software contouring and hence capture of all nucleated cells or nucleated cell remnants. The WinCyte software that controls the LSC draws contours around areas of specified fluorescence intensity if sufficiently contrasted from the background and registers these contours as objects. Within the area of an object and within a customisable distance surrounding it other cell parameters can be sampled. The programme distinguishes and optionally excludes cell aggregates on the basis of bit pattern data. By using this exclusion algorithm and, in addition, setting a nuclear size gate based on the measured area or total integrated red fluorescence of captured events, we were able to focus on a relatively pure single cell population within each cytospin (figs 2B, 3A and 4A). Green fluorescence within this single cell gate was sampled. For blood and sputum eosinophils the peak fluorescence signal within each data contour was plotted against contour (nuclear) size (figs 2C and 3B), whereas the more homogenous and generally brighter staining of sputum epithelial cells was plotted as integrated green fluorescence within each data contour against the peak green fluorescence signal (fig 4B). To exclude oral squamous epithelial cells, events within the high green peak/high green integrated fluorescence gate were plotted, in addition, for their red peak and integrated fluorescence as bronchial epithelial cells feature more uniform and generally brighter nuclear staining than contaminating oral squamous epithelial cells (fig 4D). For all sputum samples at least three cytospins per slide and antibody were analysed and specific mean percentages were calculated after subtraction of negative controls.

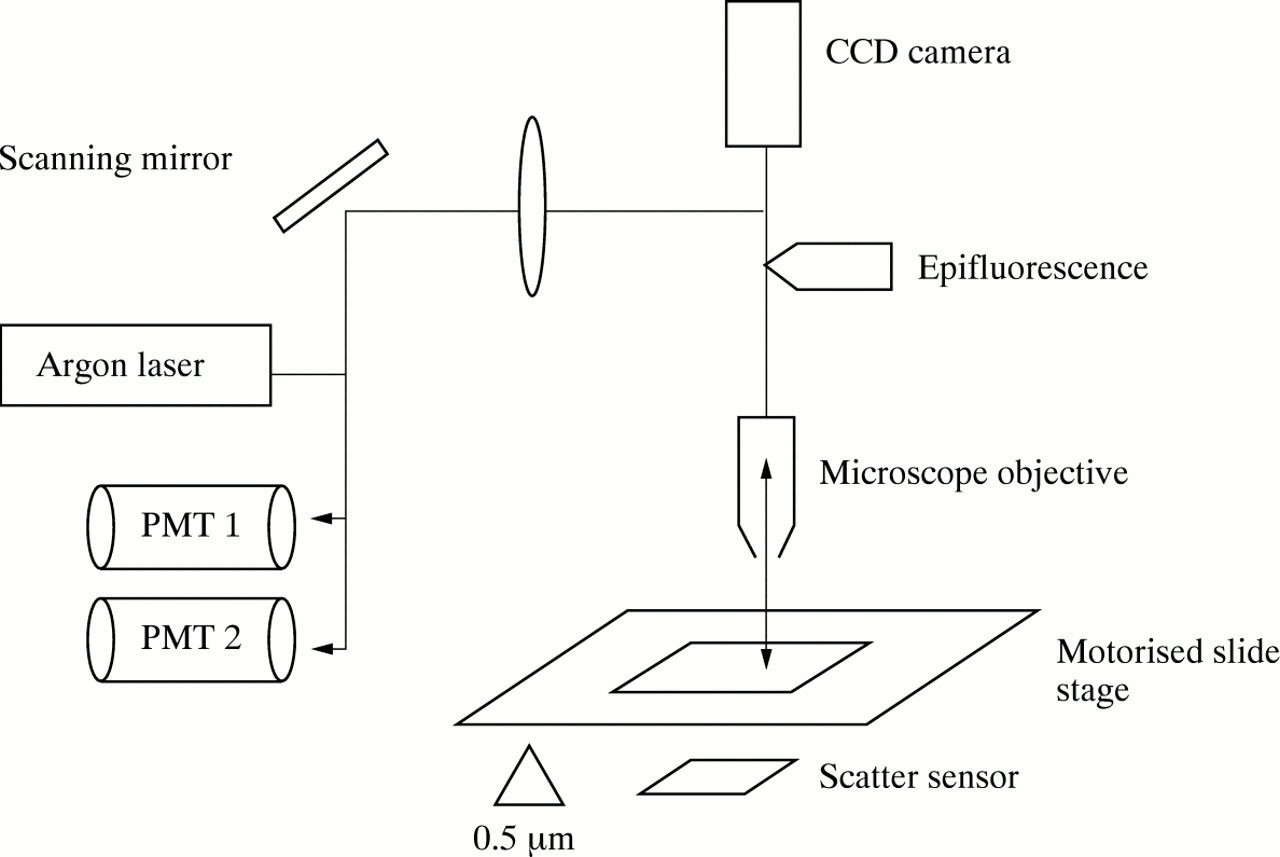
Optical configuration of the laser scanning cytometer. The laser beam is directed through the objective of a BX-50 Olympus microscope to excite fluorescently labelled cells on a microscope slide. Emitted fluorescent light is passed back through the objective lens and reflected through appropriate filters to photomultiplier tubes. Images of epifluorescent or bright field microscopy can be captured after relocation with a CCD camera linked to an image analysis system.
Determination of blood eosinophil count by LSC. (A) x/y; position of propidium iodide labelled cells detected in a single cytospin; (B) multiple cell objects are excluded on the basis of their higher integrated propidium iodide fluorescence; (C) single cells are scanned for specific green fluorescence after labelling with α-MBP antibody and FITC-conjugated secondary antibody; (D) histogram of plot C with isotype matched control antibody overlaid.

Gate settings for the analysis of sputum eosinophils by LSC; (A) single cells gated by detection of nuclear staining with propidium iodide; (B) eosinophil gate (major basic protein positive cells in gate 1); (C) histogram of plot B with isotype matched control antibody overlaid; (D) bright field microscopy video captures of relocated cells within eosinophil gate restained with Romanowski stain. More than 90% of cells within the gate displayed eosinophil morphology. Outside the gate cells of this morphology were rare.

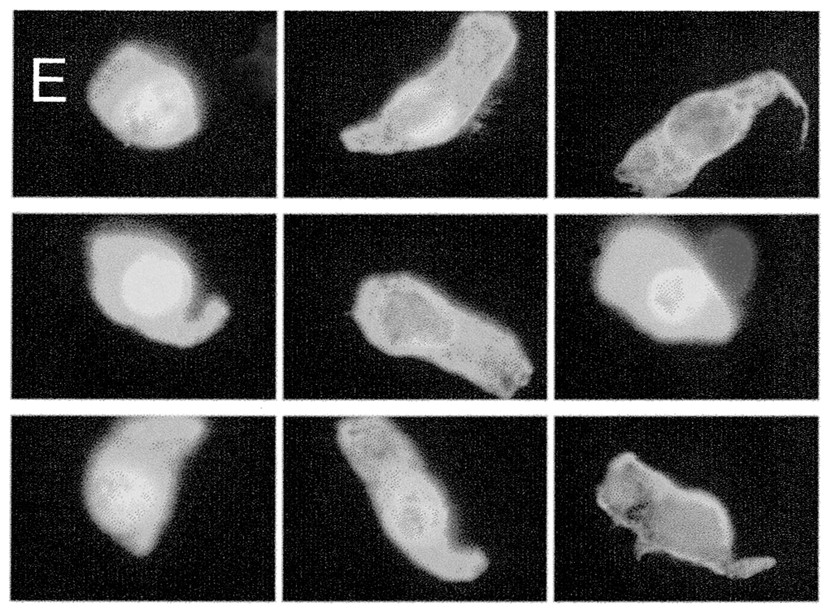
Gate settings for the analysis of sputum bronchial epithelial cells; (A) single cells gated by detection of nuclear staining with propidium iodide; (B) peak green fluorescence plotted against integrated green fluorescence for single cells stained with α-cytokeratin antibody (labelled with Oregon Green conjugated secondary antibody); (C) histogram of plot (B) with isotype matched control antibody overlaid; (D) cells within quadrant 2 of plot (B) are plotted for red fluorescence to exclude oral squamous epithelial cells; (E) epifluorescent video captures of relocated cells within quadrant 2 of plot (D) typical of bronchial epithelial cells. More than 95% of cells within this gate had this morphology. Outside this gate cells with this morphology were very rare.
ANALYSIS OF BLOOD EOSINOPHILS
Blood eosinophils were accurately detected as confirmed by relocation and microscopic visualisation (fig 2). The mean (SE) eosinophil percentage count was 4.43 (2.0) and 5.68 (1.9) using LSC and automated cell counter, respectively. The intraclass correlation coefficient for measurement by Sysmex and LSC (R) was 0.89 + SD 2.4 of between method differences.
SPUTUM ANALYSIS
Sputum induction was successful in all subjects. The mean (SE) cell numbers of 0.8 (0.09) × 103 cells/μl selected sputum were obtained with a mean (SE) absolute cell yield per donor of 0.99 (0.2) × 106. Mean cell viability determined by trypan blue exclusion was 60.0 (4.5)%. Mean oral squamous cell contamination was 6.0 (1.6)%.
On three cytospins per slide we analysed a mean (SE) of 3476 (249) single cells per slide with anti-MBP antibody and 3287 (275) single cells per slide with anti-epithelial cell antibody. Single cells captured on 206 cytospins represented a mean (within subject SD) of 56 (6.7)% of the total objects contoured by LSC, suggesting sufficient dispersion of cells by the Octospot slide system.
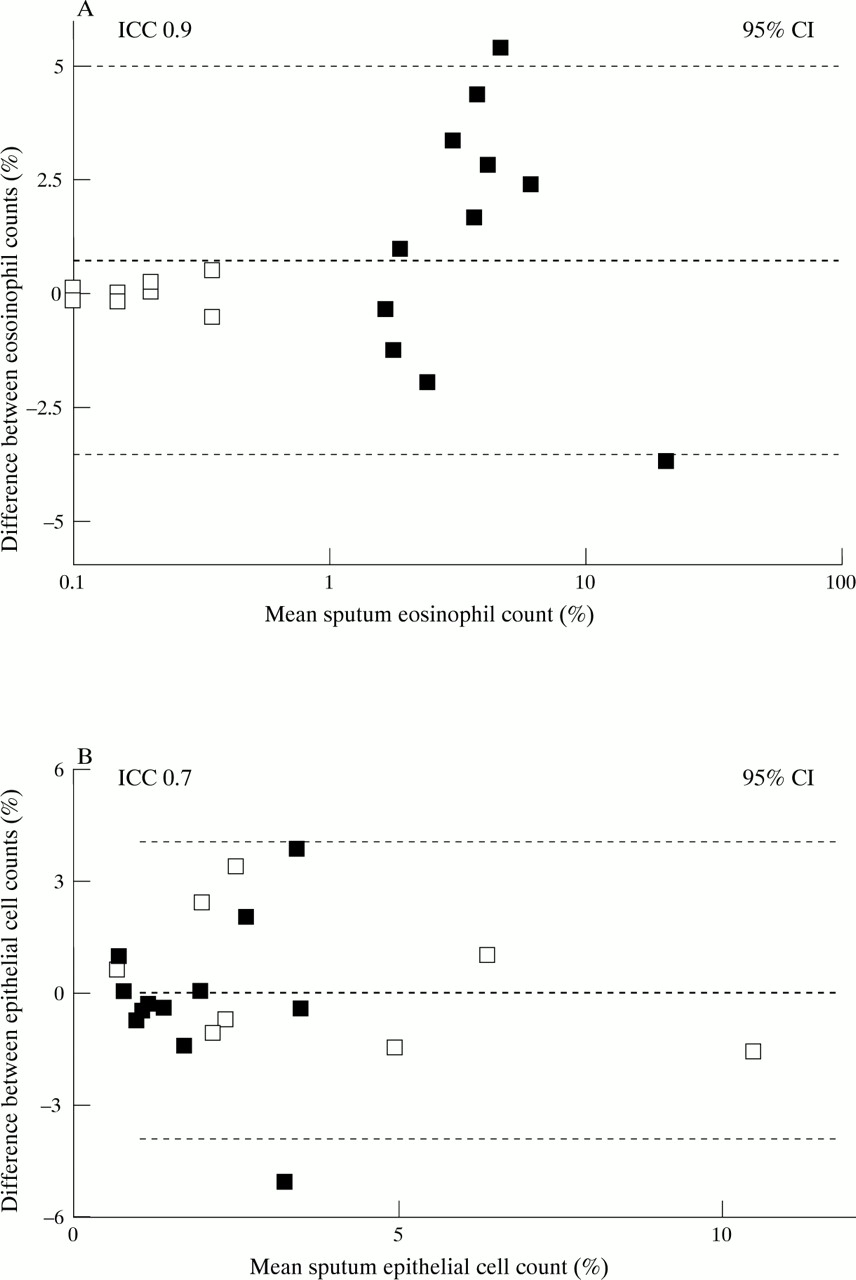
Individual and mean eosinophil and epithelial cell counts in normal and asthmatic subjects are shown in tables 1 and 2. Eosinophil counts were significantly higher in asthmatic subjects than in normal subjects (p<0.001 for both methods; Mann-Whitney U test). Overall, the intraclass coefficient (R) and the SD of between method differences were 0.9 and 2.1, respectively, for eosinophil counts and 0.7 and 2.0, respectively, for epithelial cell counts (fig 5A and B).
Sputum eosinophils (%): manual differential counts (means of two different observers) and LSC results (means of at least three cytospins)
Bronchial epithelial cells (%): manual differential counts (means of two different observers) and LSC results (means of at least three cytospins)
Bland-Altman plots for (A) sputum eosinophils and (B) bronchial epithelial cells. The mean results obtained by the two methods are plotted against the differences in counts between the two methods. Open squares (□) represent normal subjects and closed squares (□) represent subjects with asthma.
To assess variation between cytospins for eosinophil and epithelial cell counts, four slides of two donors respectively (10 and 12 cytospins total) were analysed sequentially by LSC. The coefficient of variation for eosinophil counting by LSC was 0.21 (eosinophil count 1.4%) and 0.32 (eosinophil count 25.8%). On the same slides the coefficient of variation for bronchial epithelial cells was 0.25 (epithelial cell count 1.9%) and 0.15 (epithelial cell count 1.3%). In contrast, for manual counting of two sets of seven single cytospins by a single observer the coefficient of variation for eosinophils was 0.61 (eosinophil cell count 1.4%) and 0.27 (eosinophil count 11%) and for epithelial cells was 0.89 and 0.90 (epithelial cell count 0.3% for both).
We restained cytospins that had been scanned for the presence of MBP positive eosinophils with a Romanowski stain,17 relocated to cells within and outside the eosinophil gate and captured bright field microscopic images of these cells (fig 3D). For cytospins stained with α-cytokeratin antibodies and fluorochrome, epifluorescent images of bronchial epithelial cells were sufficiently characteristic (fig 4E) to allow relocation and image capture without chromatic restaining.
By using the relocation feature it was visually confirmed that cells captured within respective gates were morphologically compatible with that cell subset. On representative slides more than 90% of MBP positive cells (region 1, fig 3B) were confirmed as typical eosinophils after restaining of the same slides with Romanowski’s stain (fig3D). Cells outside this gate with eosinophil morphology were rare. Bronchial epithelial cells labelled with α-cytokeratin antibody had highly characteristic morphology on inspection under epifluorescence (fig 4E). Typically, more than 95% of gated cells displayed this morphology. Outside the gate virtually no cells of this morphology were seen.
Discussion
In this study we describe a novel method for the objective cellular characterisation of induced sputum samples. Sputum induction has become increasingly popular as a non-invasive tool for the assessment of airway inflammation and monitoring of treatment response. More detailed analysis of the cellular components of sputum samples is, however, often difficult due to limited cell numbers obtained by this technique and variable cytological sample preservation due to cluster formation, sample degeneration, and prominence of debris. These features limit, in particular, the application of flow cytometry to sputum analysis, although some groups have had some success with this approach.7 ,8 Light microscopic inspection has limited scope, is tedious to perform and, because generally fewer cells are counted, is marred by greater error than automated analysis. The human eye is very efficient at recognising patterns but less so at quantifying these patterns,18 and numerous attempts have hence been made to automate the analysis of complex cytological specimens.19 Laser scanning cytometry offers the important combination of highly efficient computerised quantitative analysis of very small biological specimens and inspection of cells within a region of interest.
In a small pilot study involving blood leucocytes we found a good correlation between eosinophil counts obtained by an automated cell counter and analysis by LSC after differential immunostaining. Relocating to positive events and visualising these after chromatic staining confirmed that the analysis was accurate (fig 2).
Sputum analysis on LSC proved to be a considerable challenge initially and the sample preparation had to be retailored in a number of ways to facilitate accurate software contouring around single cells. Optimised cell dispersion and cytospin density proved critical to avoid excessive clumping. To minimise slide to slide variability the novel Octospot slide system proved useful as it permitted analysis of specific stains and controls on the same slide. We labelled cytospins with the DNA intercalating stain propidium iodide because of its uniform and bright staining characteristics, which allowed us to focus on the analysis of single cells. Capturing cells by using the laser scatter sensor was not possible with cytospin preparations as the cells attached to the slide have lost their spherical properties. The detection of specific green fluorescence improved with the use of Oregon Green in place of fluorescein conjugates as fluorescent labels.
Compared with manual counting—the current gold standard—estimation of the sputum eosinophil count by LSC was equivalent. Measurement of bronchial epithelial cells by light microscopy was less accurate due to their variable morphology. In contrast, detection of bronchial epithelial cells by LSC proved very reliable mainly due to their bright fluorescent staining properties. There was minimal bias towards lower percentages by LSC for both cell types, presumably because analysis by LSC includes propidium iodide positive nuclear remnants that would perhaps be excluded during manual differential counting.
The results of repeated scans of the same cytospin area, allowing for minor bleaching effects, were identical thus avoiding interobserver variation that characterises manual differential counting, particularly if percentages of relevant cell types are low. The ability to count several thousand cells on different cytospins will increase the accuracy of low cell counts considerably.
The main problem we encountered was the need to overcome background fluorescence caused by highly charged eosinophil proteins released by poorly preserved cells. A blocking step with Chromotrope 2R was introduced to overcome this problem.
Objective immunophenotyping of sputum cells by LSC could be regularly extended to other cell types. The addition of a third photomultiplier would allow double staining of other intracellular or extracellular antigens. The reliable detection of bronchial epithelial cells in sputum specimens is of potential value for the detection of malignant epithelial cells as the localisation and selective inspection of these cells amongst thousands of sputum cells after relocation under light microscopy is readily possible.
In summary, LSC is a powerful new hybrid tool that combines features of image analysis and cytometry. Although costly and requiring some operator expertise and therefore at this point in time not universally applicable in clinical practice, it is nevertheless potentially of great value for the further objective characterisation of cellular constituents within induced sputum samples. It is of potential value also as a novel diagnostic tool for the objective and repeatable characterisation of complex cytological specimens in the pathology laboratory.
Acknowledgments
This work was supported by the British Lung Foundation.