Maximising benefit and minimising harm of screening
BMJ 2008; 336 doi: https://doi.org/10.1136/bmj.39470.643218.94 (Published 28 February 2008) Cite this as: BMJ 2008;336:480
- 1National Knowledge Service, Oxford OX3 7LG
- 2NHS Cancer Screening Programmes, Sheffield
- 3Institute of Cancer Research, Sutton, Surrey
- Correspondence to: J A M Gray muir.gray{at}medknox.net
- Accepted 13 September 2007
All screening programmes do harm; some do good as well, and, of these, some do more good than harm at reasonable cost. The first task of any public health service is to identify beneficial programmes by appraising the evidence. However, evidence of a favourable balance of benefit to harm in a research setting does not guarantee that a similar balance will be reproduced in practice, so screening programmes need to be introduced in a way that allows their quality to be measured and continuously improved.
The policy decision
The decision to implement a breast cancer screening programme in the United Kingdom in 1987 was based on evidence of efficacy from other countries, especially Sweden. The Department of Health set up a committee to review the evidence, chaired by Pat Forrest, a leading researcher in treating and screening for breast cancer. His committee’s analysis of evidence and recommendations1 has been criticised,2 but the government accepted the review’s conclusions and decided not only to introduce screening for breast cancer for women aged 50-64 but also to fund a project to ensure that screening was introduced in a way most likely to ensure that the benefits found in the Swedish trial3 would be reproduced throughout the UK. Four crucial decisions were taken:
To introduce a standardised screening system across the whole country
To recommend a minimum size of screening unit to optimise quality and enable evaluation
To fund quality assurance and training centrally and develop continuous quality improvement
To fund an implementation project.
Implementation
A small implementation team was set up, with its director held accountable both to the Department of Health and to an advisory committee with representatives of the professions and the women to be offered screening, to deliver the programme within a specific time and budget and to set out performance standards. To achieve its objectives the implementation team was given a discrete budget sufficient to fund the programme; authority to centralise certain aspects of screening, notably the multidisciplinary assessment of women with abnormal mammography results; and separate funds to set up four training centres, procure an information system, and prepare clear information for the women offered screening.
Each of the 14 regional authorities then in England appointed a lead professional to manage the implementation; similar arrangements were made in Scotland, Wales, and Northern Ireland. Strong links were forged with the private sector and coordination between regions was ensured by establishing groups, called Big 18s, for radiology, pathology, surgery, and all the other disciplines involved in screening. The groups comprised representatives from all 17 NHS organisations, with the 18th partner being the private sector.
Standardising screening systems
A national screening programme needs more than a common policy. Screening is a programme, not a test, and a programme is a set of activities with a common set of objectives. These have to be complemented by nationally agreed criteria and standards if benefits are to be maximised and harm minimised.
The original aim was to reduce mortality from breast cancer in the target population, but this was broken down into a set of specific objectives.4 Each objective is best understood by defining the data that would need to be collected to measure progress towards it.5 The criteria for each objective were selected with respect to their validity and their feasibility of collection - two variables that are usually inversely related.6 Because no UK national data were available to set standards for screening, the first national standards were based on the data from Sweden tempered by the experience of leading professionals in the UK (table 1⇓).
Examples of initial standards set for the prevalent (first) round of screening for women aged 50-64
Criteria are objective, but standards are subjective, arbitrarily chosen to describe what Avedis Donabedian called the degree of “goodness” of a service or product - namely, its quality.7 We could have adopted the Swedish standards, but these were too unattainable in the short term. For this reason two types of standards were chosen:
The minimum acceptable standard, below which no programme should fall
The target standard, to which all programmes could reasonably aspire.
The target standard was set at a cut-off point between the top quartile of programmes and the rest: if a quarter of programmes could achieve a certain performance then all programmes should be able to. Meanwhile the programmes in the top quartile could look to the Swedish benchmark for their quality improvement targets - and the aim was that the whole programme should continuously improve.
Ensuring continuous improvement
Screening has many analogies with production line engineering. The tasks are repetitive and potentially boring, the margin between success and failure is fine, consumer expectations keep rising, and the potential of errors to destroy public confidence is great. The challenge was not only to get the programme up and running but also to improve it each year. Continuous improvement was needed not only to reach Swedish standards but also to keep staff motivated; constant investment in research and development, and in innovation and evaluation, was essential.
Quality assurance was built into the programme from its inception. It was funded centrally and each region identified a quality assurance manager, who established a quality assurance reference centre to collate and analyse data as well as provide local support. A crucial early decision was that the individual screening units had to cover a population of at least 500 000 (leading to around 100 individual units) so that expertise could be developed and maintained and so that quality assurance measures derived from annual data were statistically meaningful.
An information system was designed and procured to enable the continuous measurement and feedback of performance. Units had to send returns annually to the centre for analysis of each programme’s and each region’s performance. Anomalous results were always investigated. Sometimes the problem was a lack of clarity in data definition or poor data collection. But when true underperformance was found, the local quality assurance team could diagnose the cause and organise remedial action, perhaps training of staff or replacing equipment.
Some of these performance measures have subsequently been found to be wanting. The original target detection rate of five cancers per 1000 women was found to be unreliable after the publication of interval cancer rates.8 The target was replaced by the more sophisticated standardised detection ratio, which is an age standardised (and background incidence corrected) measure that compares the observed number of invasive cancers with a calculated expected number giving a target standard of 1.0.9 The expected number was based on a screening programme with an estimated sensitivity the same as that in the Swedish randomised controlled trial.3 Each screening unit could therefore be compared with the trial. Units that achieved a ratio of 1.0 were performing at the same quality as the Swedish programme and thus should achieve the same reduction in mortality. No unit was expected to achieve a ratio below 0.75. The ratio was found to be both simple and robust. The policy of investigating units with a ratio less than 0.75 enabled several underperforming units to be identified, and after investigation the performance of these units improved greatly.
Results for individual units are reported to each relevant national professional group. These professional groups can review the standard and reset them, identify training needs, and where practice is changing. In this way each professional working in the programme is linked into the standard and target setting mechanism of the programme and the targets and standards reflect professional concerns and progress.
Performance
As the average standard improved, the target increased so that there was always something to strive for and standards climbed upwards. This policy has resulted in major improvements in quality over time. For example, the standardised detection ratio for invasive cancers for the programme as a whole has improved steadily (fig 1⇓). The ratio was not developed until 1995, but had it been available in 1990-1 there would have been more concern over the cancer detection rates because few units reached the target of 1, and half were below the minimum standard of 0.75. In the early years of the screening programme a high detection rate for non-invasive cancers masked a poor sensitivity for the detection of invasive cancers and the lack of age standardisation and statistical stability were major problems in determining the performance of individual units.
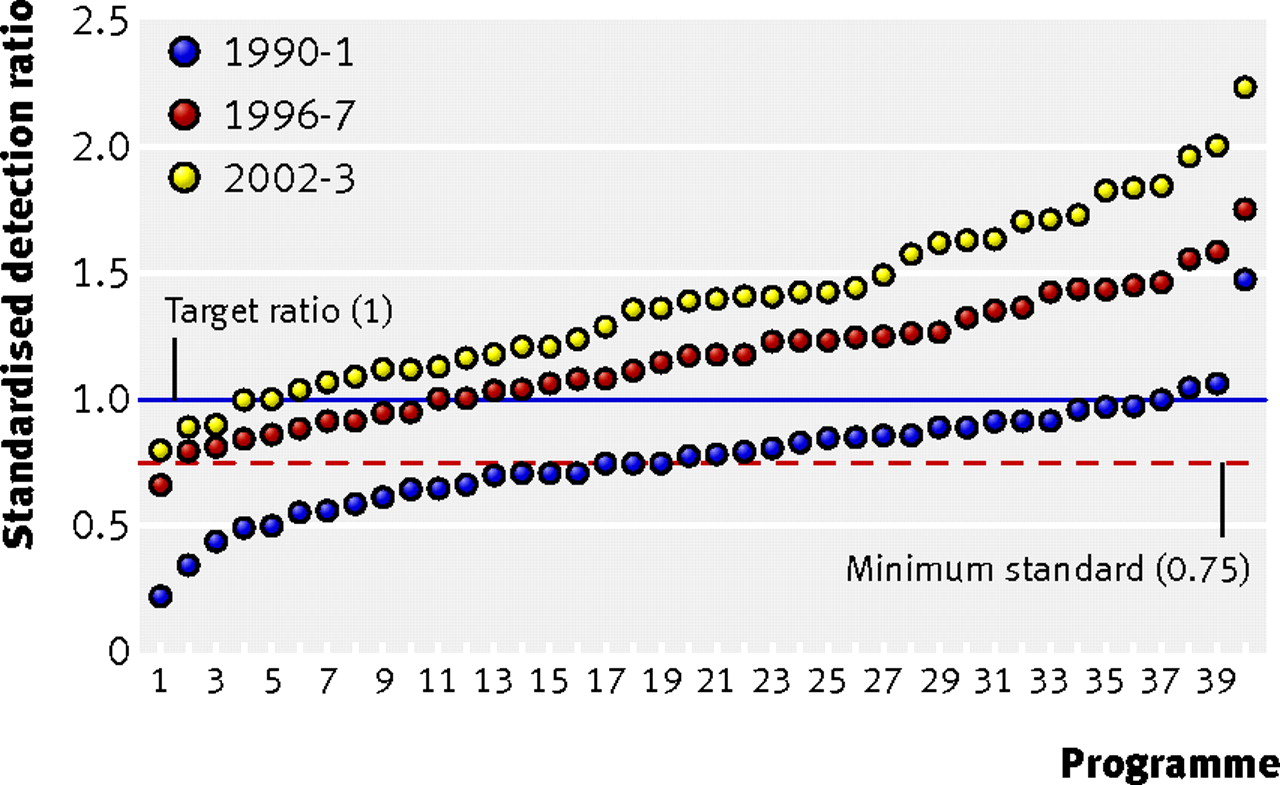
Fig 1 Prevalent screen standardised detection ratio for the 40 largest screening units in England ranked in ascending order for 1990-1, 1996-7, and 2002-3
Although some of the increase in the standardised detection ratio is now known to be the result of increasing background incidence from the use of hormone replacement therapy, a substantial amount—and probably the largest—is due to improvements in the programme. These include introducing two view mammography for prevalent screens in 1995 and incident screens in 2003, setting the range for film density towards darker films, and greater use of double reading. All these changes are the result of evidence gained from the screening programme through randomised controlled trials or observational studies (table 2⇓).
Effect of different protocols on standardised detection ratio (SDR) for small invasive breast cancers (<15 mm), 1996-7*10
While cancer detection rates were improving, an attempt was made to reduce the rate of recalls for assessment. In the second (incident) round of screening, rates of recall were around 5% and the national advisory group thought that they could be reduced. By 1995-6 rates had fallen to 4.9%, but cancer detection rates had fallen and the pressure to reduce assessment rates was eased. Figure 2⇓ shows how assessment rates have remained at just over 5%, while the positive predictive value of a referral has risen year on year. The steep increase in 2002-3 is the result of the introduction of two view mammography at all screening rounds.11 Although a low recall rate is desirable, if the rate is too low it can compromise the cancer detection rate (fig 3⇓).

Fig 2 Rate of recall for assessment at incident screening and positive predictive value of recall

Fig 3 Positive predictive value of recall versus recall for assessment for all 95 UK screening units 1999-2000 (women aged 50-64). Boxes A-C highlight three example units plus 90% confidence intervals, with box A showing a unit with optimal qualities of high positive predictive value and cancer detection rates but low referral rate
In fact figure 3⇑ shows the information that allows radiologists and quality assurance staff to compare the performance of individual units with that of others. The degree of simplicity is possible only in a national programme where the age range of women screened and the screening interval are uniform and the programme is in steady state, all units having completed initial screens for the whole of their geographical area.
Finally, table 3⇓ shows the improvement in non-operative diagnosis rates. The minimum standard for non-operative diagnosis has now been raised to 80% from 70% because all but a handful of units are achieving the minimum standard. The target has remained the same.
Rates of non-operative diagnosis for screening programme (minimum standard 70%, target standard ≥90%)
Effects of screening
The aim of the programme was to reduce mortality, and it was recognised at the outset that it would take about 15 years for the programme to have its full effect. With the quality improvements and inclusion of older women (65-70), screening is likely to continue to reduce mortality until at least 2020. Recently announced extensions to the programme could produce reductions beyond this date.12
Many factors other than screening affect mortality from breast cancer, and while most of these factors decrease death rates (such as screening, treatment, and cohort effects in younger women), some are causing increases (such as cohort effects in older women), and some have caused both (changes in the rules for death certificates).13 Separating these effects is difficult in the absence of control populations. Nevertheless, the fall in mortality since screening was introduced in 1990 means that breast cancer is no longer the most common cause of death from cancer in women.
The breast screening programme has also transformed diagnostic and treatment services for breast cancer. The programme forced the replacement of 200 clinics with widely varying staff and skills with 100 multidisciplinary centres focusing on the assessment of abnormal mammographic results and the diagnosis of breast cancer. Many of these assessment centres became the focus for diagnosing and managing breast disease in their area, bringing together not only radiologists and radiographers but also pathologists, surgeons, radiotherapists, and oncologists. The programme can probably therefore claim some of the credit for the swift take-up of tamoxifen as the drug of choice for women with breast cancer.
The ethos of quality assurance expanded well beyond imaging and was enthusiastically embraced by pathologists, who refined definitions and developed “slide exchange” into external quality assurance.14 15 Consistency remains higher among recognised breast pathologists than among general pathologists, but this difference has lessened over time. Surgeons’ annual audit of treatment is now a mine of useful information about breast care in the UK.16 The box summarises the lessons from the screening programme.17
Secrets of successful screening
Use of “total quality” approach from outset
Clear objectives and standards
Single national protocols to enable comparison of results and identification of trends
Single national dataset with well understood definitions
Data must be complete and good quality (small differences can affect many people in population based programmes)
Availability of a clear reference point, such as a randomised controlled trial
The concept of total quality assurance has been successfully applied to the NHS breast screening programme. The information systems and quality assurance systems are intertwined and inextricably linked to the supporting quality assurance structure. This has led to a breast screening programme that initially struggled to meet the required standard because of lack of experience, exceeding that standard and continuing to improve. As the information systems in the NHS improve and new screening programmes are brought in, this is an experience and a philosophy the rest of the NHS is drawing on to improve the entire service.
Summary points
The NHS screening programme for breast cancer has been running for 20 years
Quality assurance was built into the programme from implementation
Standards have improved steadily and mortality has fallen
The programme has had wider effects on breast cancer services
Footnotes
Contributors and sources: JAMG has set up and managed screening programmes for 20 years; JP has worked in cancer screening for the same period; RGB has been part of a team with a special interest in the evaluation of cancer screening programmes. JAMG and JP conceived and wrote the text. RGB acted as statistical contributor using routinely collected data.
Competing interests: JAMG was the director responsible for setting up the programme nationally; JP was responsible for setting up the programme in the Trent region and took over national responsibility from JAMG; RGB was a statistical consultant to the programme.
Provenance and peer review: Not commissioned; externally peer reviewed.