Article Text

Abstract
Background: A study was undertaken to establish the prevalence of obstructive sleep apnoea (OSA) in men with type 2 diabetes.
Methods: Men with type 2 diabetes from local hospital and selected primary care practitioner databases received questionnaires about snoring, apnoeas, and daytime sleepiness based on the Berlin questionnaire. Selected respondents had overnight oximetry to establish whether they had OSA. Comparisons of oximetry were made with those from a previous general population study. HbA1c results were collected.
Results: 1682 men were sent questionnaires, 56% of whom replied. 57% scored as “high” and 39% as “low” risk for OSA; 4% were already known to have OSA. Oximetry was performed in 240 respondents from both risk groups: 31% of the “high” and 13% of the “low” risk group had significant OSA (more than 10 >4% Sao2 dips/hour or Sao2 tracing consistent with OSA). These results were verified by detailed sleep studies. Extrapolation of the oximetry data to the questionnaire respondent population suggests that 23% had OSA. Comparison of the oximetry results with men from a previous general population study (using only more than 10 >4% Sao2 dips/hour to define OSA) showed the prevalence of OSA is significantly higher in this diabetes population (17% v 6%, p<0.001). Multiple linear regression revealed BMI and diabetes as significant independent predictors of OSA. Following correction for BMI (which explained 13% of the variance in OSA), diabetes explained a further 8% of the variance (p<0.001). There was a low correlation between OSA severity and HbA1c in the subgroup recruited from the hospital database (r = 0.2, p = 0.006) which remained significant after allowing for obesity (p = 0.03).
Conclusions: OSA is highly prevalent in men with type 2 diabetes; most are undiagnosed. Diabetes itself may be a significant independent contributor to the risk of OSA.
- AHI, apnoea-hypopnoea index
- BMI, body mass index
- CPAP, continuous positive airway pressure
- ESS, Epworth sleepiness score
- HbA1c, glycosylated haemoglobin
- OSA, obstructive sleep apnoea
- obstructive sleep apnoea
- type 2 diabetes
- prevalence
Statistics from Altmetric.com
- AHI, apnoea-hypopnoea index
- BMI, body mass index
- CPAP, continuous positive airway pressure
- ESS, Epworth sleepiness score
- HbA1c, glycosylated haemoglobin
- OSA, obstructive sleep apnoea
Obstructive sleep apnoea (OSA) is common in the general population, with an estimated 1–5% of adult men and 1–2% of women being affected.1,2 Upper airway resistance is increased during sleep, with resultant inspiratory flow limitation and obstruction causing snoring and apnoeas. In response to the obstruction, respiratory effort increases and arousals are usually necessary to terminate the apnoea. These are associated with increased sympathetic activity. If the arousals are frequent, sleep fragmentation occurs which can cause excessive daytime sleepiness. There is a causal relationship between central obesity and OSA, although OSA is also associated with craniofacial shape.3,4 If significant OSA is diagnosed, successful treatment can be given, usually with continuous positive airway pressure (CPAP).5
Type 2 diabetes is a condition of impaired glucose tolerance and insulin resistance which also has a strong causal relationship with central obesity.6 OSA is associated with insulin resistance, with higher levels of OSA associated with greater insulin resistance, independent of general obesity.7,8 There is a high prevalence of impaired glucose tolerance and type 2 diabetes in patients with OSA.9 The prevalence of OSA among patients with type 2 diabetes has not, however, been investigated.
We hypothesised that OSA would be highly prevalent in men with type 2 diabetes, more than in the general population. We also hypothesised that those with OSA were more likely to have higher glycosylated haemoglobin (HbA1c), reflecting poorer diabetic control. We therefore performed a study in men with known type 2 diabetes to establish the prevalence of OSA by a screening questionnaire and targeted sleep studies, and compared the prevalence rates of OSA with those in another community population.10 We also established whether there was any correlation between OSA severity and diabetic control measured by HbA1c.
METHODS
Subjects
All men with type 2 diabetes aged 18–75 years on the databases of a tertiary specialist hospital centre (Oxford Centre for Diabetes, Endocrinology and Metabolism) and five local primary care centres (non-specialist, family doctor) were sent a questionnaire and explanatory letter about the study. A second questionnaire was sent to those who did not respond. Type 2 diabetes was a primary care practitioner diagnosis based on raised fasting blood glucose levels ⩾7.0 mmol/l. The study was approved by the Oxford Radcliffe Hospitals ethics committee.
Questionnaire
The questionnaire requested information regarding age, the year diabetes developed, diabetes treatment, and about physical characteristics including neck circumference. A tape measure was provided with instructions on how to measure the neck, just below the larynx. Questions in three symptom categories were asked: snoring and apnoeas, daytime fatigue, hypertension and height and weight (to calculate body mass index (BMI)). The questions were those in the Berlin questionnaire, designed to screen for likely OSA by determining whether people were “high” or “low” risk for OSA based on their responses.11 This questionnaire has been used in a primary care population in Ohio, USA and the results validated with multichannel sleep studies. We omitted one question from the Berlin questionnaire, namely: “Have you ever nodded off or fallen asleep while driving a vehicle?” A change was noted in the answers given to questions regarding sleepiness when driving between two previous community studies performed by our department several years apart, thought to be due to increased population awareness of the dangers of sleepiness while driving which decreased the willingness to admit to this.10,12 We therefore thought this question was unlikely to be answered accurately, could deter some respondents, and hence bias results. We also asked whether subjects had previously been diagnosed with OSA and whether they were receiving treatment for this.
Questionnaires were returned and scored according to the Berlin scoring criteria. Responses to the three symptom categories determined whether subjects were “high” or “low” risk for OSA. To be “high” risk, subjects had to qualify in at least two symptom categories.
Glycosylated haemoglobin (HbA1c)
The most recent HbA1c result was recorded for all questionnaire respondents. This was obtained by either accessing the hospital biochemistry database or by contacting the primary care practitioner. Patients who did not have an HbA1c result recorded within 3 months of completion of the questionnaire were asked if they would have this performed.
Screening sleep studies
A sample of “high” and “low” risk subjects were asked to participate in home overnight oximetry sleep studies. Subjects were selected on the basis of their postcodes; those within 20 miles of the base hospital were preferred, for ease of equipment delivery. If subjects agreed to participate, one of the investigators visited them to obtain written consent, deliver an oximeter, provide instructions on its use, and to complete an Epworth sleepiness score (ESS, an eight point questionnaire assessment of the tendency to fall asleep during various daytime situations).13 The overnight oximetry studies were performed with a small portable battery operated wrist worn monitor and attached finger probe (Pulsox-3i, Konica Minolta, Japan). This measures the oxygen saturation of arterial blood (Sao2) and the pulse rate and stores this data which can be downloaded via a computer and analysed (Download, Stowood Scientific Instruments, Oxford, UK). A normal overnight oximetry tracing has been found in a systematic literature review of home diagnosis of sleep apnoea to substantially reduce the probability of OSA in the majority of patients.14 Measurements of Sao2 correlate very well with apnoea-hypopnoea index (AHI).15
Subjects who had more than 10 dips in Sao2 of >4% per hour on oximetry, consistent with a diagnosis of OSA, or those who had fewer than 10 dips in Sao2 of >4% per hour but with an oxygen saturation tracing consistent with a diagnosis of OSA when viewed by an expert (JRS), were contacted to perform an unattended portable monitor home sleep study to verify the diagnosis of OSA. The equipment for this was delivered by one of the investigators who fitted it, explained how to use it, and provided full written instructions. The sleep study equipment measured body position, body movement, nasal pressure via nasal cannula, oximetry, pulse rate, and respiratory effort via thoracic and abdominal bands (Embletta PDS 3.0, Flaga Medical, Iceland). From these measurements a validated AHI per hour in bed and oxygen desaturation events per hour were automatically calculated, with manual review and editing.
All subjects found to have OSA on sleep studies were offered a clinic appointment to discuss the results and determine whether they were sufficiently symptomatic to require treatment.
Comparison of diabetes population with previous primary care population study
A previous study was performed by our department in which 275 men recruited randomly from a primary care population (diabetes was not an inclusion or exclusion criterion) underwent home overnight sleep studies with RM50 portable monitors (Parametric Recorders, London, UK); the results have been published elsewhere.10 We wanted to compare the prevalence of OSA in this “normal” control population with the prevalence in our current study population of men with type 2 diabetes. We therefore needed to establish the equivalence or otherwise of the >4% Sao2 dips per hour of the two oximeters which had been used in each study (RM50 and Pulsox-3i). Although the Sao2 dip counting algorithm was identical, the actual oximeter devices came from different manufacturers. We performed overnight oximetry studies using both oximeters on the same night, mostly in patients with confirmed OSA of variable severity from the Oxford Sleep Clinic. The recordings were downloaded and scored automatically with manual review. This was exactly the same as the analysis performed in both the current and previous studies. The results of the two readings were then compared and correlated. Linear regression was performed to calculate a conversion factor to enable direct comparison of results from the two oximeters. The recordings from the diabetes population and the previous general practice population could thus be directly compared, to compare the prevalence of OSA in the two populations.
Analysis of data
The data were analysed using SPSS Version 12.0 and expressed as mean (SD, 0–100% range). Comparison of multiple groups was performed by one way analysis of variance (ANOVA), with Duncan’s multiple ranging for post hoc analysis. Differences between the “high” and “low” risk groups and between the two different study populations were assessed using unpaired t tests and χ2 tests when comparing proportions. A multiple linear regression analysis was performed using the two different study populations to determine predictors of >4% Sao2 dips per hour. A p value of <0.05 was considered to be statistically significant.
RESULTS
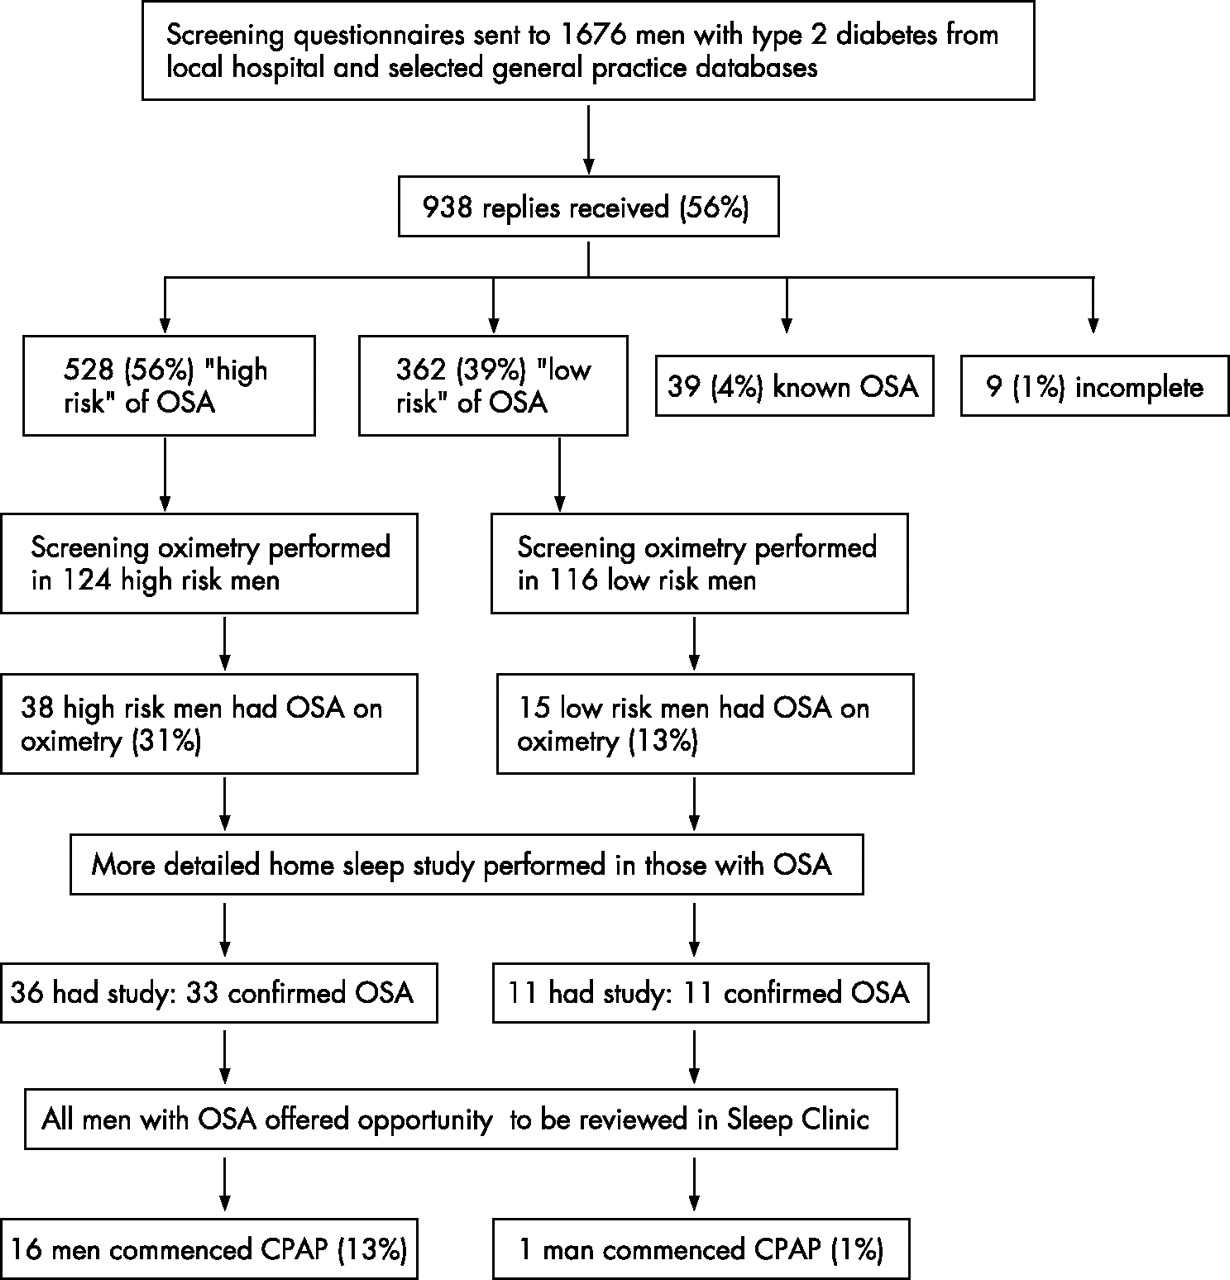
A flow diagram of the study is shown in fig 1.

Flow diagram of study.
Questionnaire response rate
Questionnaires were sent to a total of 1433 men from the Oxford Centre for Diabetes, Endocrinology and Metabolism database and to 243 men from primary care databases. Sixty five men were on both databases but were only contacted via the hospital centre. The population of Oxfordshire is of mixed ethnicity, but is predominantly Caucasian. There were 793 replies (55%) in total from the hospital database and 145 (60%) from the primary care databases, representing a 56% overall response rate; 63% of the hospital database replies and 45% of the primary care database replies were received after the first mailing.
Questionnaire responses
Table 1 shows the physical characteristics of the respondents. The hospital and primary care database groups did not differ in their basic characteristics, other than the mean duration of diabetes (12.1 v 7 years) and the treatment taken for this (hospital: 32% insulin, 22% insulin and oral hypoglycaemics, 41% oral hypoglycaemics, 5% diet; primary care: 4% insulin, 4% insulin and oral hypoglycaemics, 77% oral hypoglycaemics, 14% diet). The hospital database is likely to reflect those with more severe disease referred for specialist input. As the two groups did not differ otherwise in their characteristics, their results were analysed together.
Physical characteristics of questionnaire respondents
Risk of OSA
From the 938 questionnaire responses, 528 men (56.2%) scored as being “high” risk of OSA, 362 (38.6%) scored as “low” risk, and 39 (4.1%) stated they had already been diagnosed with OSA, with 30 (3%) receiving treatment for this with CPAP. Nine questionnaires were incomplete and prevented assignment to a risk group. The characteristics of the groups are shown in table 2.
Characteristics of known OSA, “high” and “low” risk questionnaire respondents
Sleep studies
Overnight oximetry studies were performed in 124 “high” risk and 116 “low” risk subjects. Ninety further men contacted refused to have oximetry performed. Comparison of the characteristics of those individuals selected for oximetry with their risk group as a whole showed no significant differences. In the “high” risk group, 38 (31%) had traces consistent with a diagnosis of OSA (29 with more than 10 >4% Sao2 dips/hour and nine with fewer than 10 >4% Sao2 dips/hour but oxygen saturation tracing consistent with a diagnosis of OSA), and 36 (29%) went on to have a portable monitor home sleep study. In the “low” risk group 15 (13%) had oximetry traces consistent with OSA (11 with more than 10 >4% Sao2 dips/hour and four with fewer than 10 >4% Sao2 dips/hour but oxygen saturation tracing consistent with a diagnosis of OSA) and 11 (9%) proceeded to have a portable monitor home sleep study. Those who did not have portable monitor sleep studies after completing overnight oximetry declined consent.
In the “high” risk group, automatic analysis and manual review of the portable monitor home sleep studies confirmed that 33 of the 36 people had OSA (27%). Two of these also had some central sleep apnoea and one had OSA and obesity hypoventilation. One of the 36 patients had only central sleep apnoea and he died soon after taking part in the study from a myocardial infarction and possibly left ventricular failure. One patient had low baseline oxygen saturations known to be due to concurrent chronic obstructive pulmonary disease with little evidence of OSA. One patient had difficulty performing the home sleep study and the recording was inadequate; this was not repeated. These three people who did not have confirmed OSA have been excluded from further analysis. In the “low” risk group the portable monitor home sleep study showed that all 11 had confirmed OSA (9%). These results are shown in table 3.
Sleep study results according to questionnaire risk group
Of the 33 subjects found to have OSA on their portable monitor sleep studies in the “high” risk group, 16 (13%) were symptomatic with daytime sleepiness and were commenced on CPAP treatment following clinic review. In the “low” risk group, of the 11 people found to have OSA on their portable monitor sleep studies, one (1%) was symptomatic and commenced CPAP (p<0.001, χ2 test).
Correlation of OSA indices with HbA1c
There was no significant difference in HbA1c levels between the “high” or “low” risk groups (table 2). There was also no significant correlation in the two groups combined between the number of >4% Sao2 dips per hour from oximetry and HbA1c % (n = 240, r = 0.11, p = 0.1). If the hospital and primary care groups were analysed separately, however, there was a positive correlation in the hospital group (r = 0.2, p = 0.006) but not in the primary care group. A multiple linear regression model using HbA1c as the dependent variable showed that the strength of this correlation decreased when allowing for BMI, although it remained statistically significant (p = 0.03).
Comparison of results with previous primary care population study
Twenty nine individuals completed overnight oximetry studies with both the Pulsox-3i and RM50 recorders to investigate equivalence. There was a close positive correlation between the >4% Sao2 dip rate from the Pulsox-3i recordings and the RM50 recordings (r = 0.97, p = 0.01). Both recorders use the same algorithm for calculating the number of >4% Sao2 dips per hour, which presumably accounts for the strong correlation. A small conversion factor was calculated to allow direct comparison of the RM50 oximetry recordings in the previous primary care population and the current Minolta oximetry recordings (Minolta reading = 1.26×RM50 reading − 2.56). The results of the two study populations are shown in table 4.
Characteristics and overnight oximetry results from two study populations: men in primary care (Bicester, Oxfordshire, 1999)10 and current diabetes study
The number of >4% Sao2 dips per hour, unadjusted for any covariate, was significantly higher in the diabetes population (p<0.001), as was age, BMI, and neck size. In multiple linear regression models of the two populations, using >4% Sao2 dips per hour as the dependent variable, significant predictors were BMI and diabetes status (having or not having diabetes). Once BMI was allowed for, neck size and age were not significant predictors. Diabetes status gave an additional small increase in the R2 after correction for BMI (R2 = 0.13 (13%) for BMI and 0.21 (21%) for diabetes status in addition). This shows that 13% of the variance in >4% SaO2 dips per hour can be explained by BMI, but an additional 8% is explained by diabetes. The β coefficients of Sao2 for BMI and diabetes were 0.6 and 5.2, respectively (p<0.001). Thus, for every 1 point increase in BMI, the >4% Sao2 dips per hour rose by 0.6, and having type 2 diabetes increased the >4% Sao2 dips per hour on average by 5, independent of BMI, neck size, and age (table 5). This confirms a significant independent effect of diabetes on >4% Sao2 dips per hour.
Multiple linear regression results for >4% Sao2 dips per hour of the two populations (primary care population and current diabetes study)
DISCUSSION
This study shows that OSA is common in this population of men with type 2 diabetes. Based on answers to the Berlin questionnaire, 56% of men were considered to be at “high” risk of OSA and 4% stated they had known OSA. Of the subset of men studied, 22% had an overnight oximetry study compatible with a diagnosis of OSA. Diagnostic home monitor sleep studies largely confirmed these findings. If the results of the home monitor sleep studies are extrapolated proportionally to the whole questionnaire respondent population and added to those with known OSA, 213 of the 938 respondents (23%) would be likely to have OSA.
The number of men with type 2 diabetes scoring as “high” risk of OSA (57%) was higher than in the original Berlin questionnaire study in which 45% of 741 men scored as “high” risk.11 The number of men with type 2 diabetes in our study confirmed as having OSA on oximetry was much higher than the number of men found to have OSA in a control primary care population in Bicester, Oxfordshire: 6% of 275 men in Bicester had overnight oximetry compatible with a diagnosis of OSA (based on more than 10 >4% Sao2 dips/hour) compared with 17% of our diabetes population diagnosed on these criteria.10 Although BMI was the best predictor of OSA, type 2 diabetes conferred a significant extra increase in the likelihood of having OSA after allowing for BMI, age, and neck size. On average, having type 2 diabetes increased the number of >4% Sao2 dips per hour by 5. Although the comparison of the previous primary care and the diabetes populations was not ideal (different selection criteria, neck size and weight measured by nurse or individual, different oximeters requiring correction factor to be applied, studied at different times, and the possibility of some men in the Bicester sample having type 2 diabetes), we regard the results as valid. The population with type 2 diabetes studied here was predominantly hospital treated, which may add some bias to the sample. A high proportion (44%) were using insulin which causes weight gain, although this would have been taken into account by the multiple linear regression analysis.
OSA may therefore be a particular problem in men with type 2 diabetes. The reasons for this are not clear. There may be an aspect of central obesity in type 2 diabetes that contributes to the OSA which is not captured in BMI or neck size, despite the fact that neck size itself is a significant independent predictor of the rate of overnight hypoxic dipping in OSA.12 It could be that OSA is a close correlate of the same central obesity distribution that also predisposes to insulin resistance. It is accepted that CT scanning is the gold standard method of quantifying abdominal fat; BMI, waist and waist to hip measurements are poorer correlates.16,17 Using these indirect measurements to allow for this important central obesity distribution is probably not adequate.18 Diabetic autonomic neuropathy may cause increased OSA, and this has been noted in other studies.19,20 This study shows that, whatever the mechanism, OSA is extremely common in men with type 2 diabetes and may well be underdiagnosed. Women were not included in this study, and the sex differences in body fat distribution mean that further studies would be needed to gain an estimate of the prevalence of OSA in women with type 2 diabetes.
Clinicians who manage patients with type 2 diabetes must be aware of the increased likelihood of OSA, routinely asking about habitual snoring, witnessed apnoeas, nocturnal choking, and daytime sleepiness as part of their patient assessment, or using the ESS.13 If OSA is considered likely, referral to the local sleep service for a diagnostic sleep study is appropriate. It may be difficult without a sleep study to differentiate sleepiness due to OSA from fatigue and tiredness associated with diabetes and co-morbid disease. As we have shown, screening questionnaires can predict risk but have poor sensitivities and specificities. Daytime sleepiness contributed to a “high risk” score on the questionnaire, and this is one of the main factors which determine whether someone is likely to receive and benefit from CPAP therapy. The Berlin questionnaire was useful in differentiating patients who were likely to require CPAP, evidenced by the fact that significantly more “high” risk than “low” risk patients found to have OSA received CPAP (13% v 1%; p<0.001). The benefits of CPAP to people with OSA are clear—namely, improvements in daytime sleepiness, cognitive function, driving ability, and blood pressure.5,21–24 Improvements in blood pressure are likely to translate to improved cardiovascular risk, which is particularly important in a diabetes population.25 It is not known whether CPAP improves glycaemic control in people with OSA and type 2 diabetes, as adequately controlled studies have not yet been performed.
We found no correlation between indices of sleep disordered breathing and HbA1c in the diabetes group as a whole, but the men with type 2 diabetes recruited from the hospital database did show a low but significant correlation when analysed separately. We postulated that the sleep fragmentation of OSA would lead to more disordered glucose metabolism, resulting in worse diabetic control. This was not the case overall, but may reflect the fact that the HbA1c level was closely controlled by physician intervention with extra hypoglycaemic treatment. This explanation is not, however, supported by examination of the proportions on diet versus oral hypoglycaemics versus insulin, there being no significant difference between “high” and “low” risk groups after allowing for obesity. The fact that there was a small correlation within the hospital population alone is interesting, and this remained significant after correction for BMI. It may be that the people with type 2 diabetes on the hospital database had more severe and perhaps less well controlled diabetes, allowing OSA to have an effect. This would be supported by the finding of a higher mean HbA1c level in the hospital group than in the primary care group (8.4 v 7.8, p = 0.001). There could, however, be other potential explanations.
Sleep disordered breathing has been found to be associated with insulin resistance independent of obesity, with higher levels of OSA associated with greater insulin resistance.7,8 As insulin resistance is the precursor to type 2 diabetes, it is questioned whether OSA itself is an independent risk factor for developing diabetes. A cohort of 2668 men was asked about habitual snoring and diabetes by postal questionnaire on two occasions 10 years apart.26 Habitual snorers had a significantly higher prevalence of diabetes on both occasions. The incidence of new diabetes after 10 years was higher among habitual snorers (p<0.001), and men who habitually snore had a more than twofold higher incidence of diabetes than non-habitual snorers in the same age group, with the risk largely attributable to obesity. A similar study sent two questionnaires asking about snoring and diabetes 10 years apart to 69 852 female nurses in the USA.27 Following adjustment for age and BMI, snoring was independently associated with an increased risk of type 2 diabetes (p<0.0001). In both of these studies, however, central obesity was only allowed for by the surrogate of BMI. As mentioned before, this is a poor correlate of true intra-abdominal obesity and allowing for this might have removed any significance, given that OSA correlates better with upper body obesity (neck size) than BMI.3,16
We conclude that men with type 2 diabetes have a very high prevalence of OSA, much higher than that of men in the general population. Recognition and treatment of this is likely to be beneficial to them if they are symptomatic with excessive daytime sleepiness.
Acknowledgments
The authors are grateful to Kate Mutendera who visited some of the patients, to the staff of the Oxford Centre for Diabetes, Endocrinology and Metabolism for their help, and to Dr Annabel Nickol for the loan of oximeters.
REFERENCES
Footnotes
-
Published Online First 23 August 2006
-
This study was funded by Diabetes UK and the Grand Charity, who had no role in its execution.
-
Competing interests: none.
Linked Articles
- Airwaves