Article Text

Abstract
Background Acute pulmonary exacerbations accelerate pulmonary decline in cystic fibrosis (CF). There is a critical need for better predictors of treatment response.
Objective To test whether expression of a panel of leucocyte genes directly measured from whole blood predicts reductions in sputum bacterial density.
Methods A previously validated 10-gene peripheral blood mononuclear cell (PBMC) signature was prospectively tested in PBMC and whole blood leucocyte RNA isolated from adult subjects with CF at the beginning and end of treatment for an acute pulmonary exacerbation. Gene expression was simultaneously quantified from PBMCs and whole blood RNA using real-time PCR amplification. Test characteristics including sensitivity, specificity, positive and negative predictive values were calculated and receiver operating characteristic curves determined the best cut-off to diagnose a microbiological response. The findings were then validated in a smaller independent sample.
Results Whole blood transcript measurements are more accurate than forced expiratory volume in 1 s (FEV1) or C reactive protein (CRP) alone in identifying reduction of airway infection. When added to FEV1, the whole blood gene panel improved diagnostic accuracy from 64% to 82%. The specificity of the test to detect reduced infection was 88% and the positive predictive value for the presence of persistent infection was 86%. The area under the curve for detecting treatment response was 0.81. Six genes were the most significant predictors for identifying reduction in airway bacterial load beyond FEV1 or CRP alone. The high specificity of the test was replicated in the validation cohort.
Conclusions The addition of blood leucocyte gene expression to FEV1 and CRP enhances specificity in predicting reduced pulmonary infection and may bolster the assessment of CF treatment outcomes.
- Cystic Fibrosis
- Respiratory Infection
- Neutrophil Biology
- Lymphocyte Biology
Statistics from Altmetric.com
Key messages
What is the key question?
-
Acute pulmonary exacerbations are common in cystic fibrosis and contribute to loss of lung function. Assessment of treatment outcomes is limited using current standard practices.
What is the bottom line?
-
Leucocyte mRNA expression measured from peripheral blood quantifies reduction in pulmonary infection and inflammation following treatment with greater accuracy than standard measures alone.
Why read on?
-
This is a potentially valuable, inexpensive and non-invasive tool for analysing current and future strategies to reduce the impact of exacerbations on the progression of disease.
Introduction
Acute pulmonary exacerbations are sentinel events in cystic fibrosis (CF) lung disease progression, increasing mortality and reducing lung function and quality of life.1 ,2 A quarter of patients with CF treated for exacerbations fail to return to their baseline forced expiratory volume in 1 s (FEV1).1 Despite an unquestioned need for early identification and evidence-based treatments, there has been no meaningful advancement in this aspect of CF care, in part due to the absence of objective measures of therapeutic response. Resolution of exacerbation is determined by improved FEV1, reduced patient symptoms and clinician judgment. Various sputum3 ,4 and serum5 ,6 molecular predictors have been evaluated, but none have been validated for identification of an optimal treatment response or for prognostication of the clinical course. A technically feasible peripheral blood measurement reflecting decreased infection would be invaluable in assessing interventions on exacerbation outcomes.
We have previously identified a gene expression signature detectable in peripheral blood mononuclear cells (PBMCs) of patients with CF which reflects resolution of acute exacerbation.7 The 10-gene panel is reproducibly measured by real-time PCR (RT-PCR) from PBMC mRNA. Ranges of expression of this panel in acutely ill patients with CF differed significantly from normal controls and outperformed FEV1 and C reactive protein (CRP) in predicting treatment response.7 However, isolated PBMCs may provide a limited assessment of pulmonary inflammation as they exclude the potential contribution by neutrophils. In the present study the 10-gene panel was tested as a predictor of reduced pulmonary infection in acute CF exacerbations when measured directly from whole blood in 57 subjects with CF using rapid RNA stabilisation. We found that six of the 10 whole blood genes strongly predicted a bacteriological response to treatment, and this panel was then validated in an independent cohort.
Methods
Full details of clinical measurements, assay protocols and statistical methods are given in the online supplement.
Study population
Adult subjects with CF presenting with an acute pulmonary exacerbation received intravenous antibiotics for a minimum of 2 weeks.8 Each subject served as their own control following antibiotic treatment. Blood was drawn at the initiation and completion (±2 days) of treatment. At each time point the following were sampled: blood for PBMC and whole blood RNA, leucocyte differentials, sputum quantitative microbiology, FEV1 and CRP. The concomitant use of inhaled antibiotics and systemic steroids was allowed. No treatments were modified based on study participation. Calculated Rosenfeld scores ≥2.6 were required for all subjects, indicating exacerbation.9
Measurement of leucocyte RNA from whole blood and PBMCs
Whole blood samples were collected into PAXgene tubes and RNA was isolated with the PAXgene Blood RNA Kit. RNA purification and first strand cDNA synthesis were fully automated. Transcript abundance was quantified by RT-PCR in pre- and post-antibiotic samples for 10 genes: CD36, CD64, CD163, Toll-like receptor 2 (TLR2), plexin D1 (PLXND1), hepatocellular carcinoma associated antigen 112 (HCA112), heparanase (HPSE), a disintegrin and metalloproteinase domain 9 (ADAM9), versican (CSPG2) and IL-32.7
Quantitative RT-PCR was also performed on RNA isolated from PBMCs.7
Statistics
All variables were natural-log transformed for correlations, t tests and descriptive statistics except FEV1 and Rosenfeld score. Associations of transcripts with FEV1 percentage predicted, neutrophil counts and CRP were evaluated using Pearson correlations. A multiple logistic regression model predicted the presence of an exacerbation (Rosenfeld score ≥2.6) versus its resolution (Rosenfeld score <2.6 and 0.3 log reduction in sputum bacteriological burden for all subjects, with <2×10⁷ colony forming units (cfu)/mL bacterial density after treatment) using FEV1, CRP and expression levels for the 10 genes as predictors by fitting a generalised linear model with the logit link. The endpoint values were extrapolated from previous studies in which 0.3 log was the minimum decrease following antibiotics to significantly reduce airway neutrophil DNA10 and <2×10⁷ cfu/mL was the lowest 75th percentile of Pseudomonas density after antibiotics in a multicentre trial.3 Performance statistics associated with the model were: sensitivity (proportion with persistent infection correctly identified as such); specificity (proportion with reduced infection correctly identified as such); positive predictive value (PPV) (proportion of ‘test positives’ in exacerbation state); negative predictive value (NPV) (proportion of ‘test negatives’ not in exacerbation state); and accuracy (average of sensitivity and specificity). These statistics were calculated for each probability cut-off point that classified subjects into exacerbation states (yes/no). Generalised estimating equations were used to fit the model using the independent working covariance structure for the two measures per subject, selected based on QICu.11 A backward selection approach was used to construct the final models using p=0.20 as the cut-off point to stay in the model. The benefit of genes as predictors was determined by comparing QICu and accuracy statistics for the full model with one with FEV1 and CRP alone. Receiver operating characteristic (ROC) curves demonstrated the optimal cut-off point for response to treatment. SAS V.9.3 software was used for all analyses.
Results
Patient demographics
The study populations were typical of adult patients with CF (table 1). In the test cohort, 60 (of 62) subjects completed both time points. High-quality whole blood RNA utilisable for analysis was obtained from 57 subjects (95%) and PBMC RNA from 55 subjects. Subjects overall had moderate airway disease and co-infection with two or more pathogens was common, predominantly Pseudomonas aeruginosa and Staphylococcus aureus. FEV1 percentage predicted, CRP and quantitative microbiology all improved in the test cohort with treatment (figure 1); the mean±SD increase in FEV1 percentage predicted was 9.2±9.6%, and the mean±SD reduction in CRP was −2.0±4.4 mg/dL. Bacterial density was calculated based on the sum total of all pathogens cultured from subjects. The mean reduction in global bacterial counts was 3.0±2.4 log10 cfu/mL. Following treatment, FEV1 improved to ≥90% of their best FEV1 in the previous year in 43 of the 51 subjects who had previous spirometry data available. Although the overall demographics for the validation group were similar, the median FEV1 was significantly higher but the change in FEV1 and the range of FEV1 for both groups were the same.
Characteristics of study cohort

Effect of antibiotics on standard variables before (Pre) and after (Post) treatment: forced expiratory volume in 1 s (FEV1) percentage predicted, C reactive protein (CRP) and sputum quantitative microbiology. Bars represent mean FEV1, geometric mean CRP and log mean sputum microbiology. Error bars represent SDs on the same scale as means. Comparison tests were based on paired t tests.
Change in PBMC and whole blood gene expression with treatment
In the test cohort, pre- versus post-exacerbation transcripts were compared for PBMC and whole blood samples (figure 2). Whole blood samples contain circulating neutrophil RNA in addition to all mononuclear leucocyte populations present in PBMC samples.

Effect of antibiotics on peripheral blood mononuclear cell (PBMC) and whole blood (WB) mean expression values before (Pre) and after (Post) treatment. Bars represent geometric means (with 95% CIs) relative to the detection of housekeeping gene, human hypoxanthine guanine phosphoribosyl transferase (paired t test comparisons were made within same blood compartment).
From the 10-gene panel, mean expression levels for five PBMC genes changed significantly following treatment: CD36 (p=0.035), CD64 (p=0.023), ADAM9 (p<0.001), CSPG2 (p=0.005) and HCA112 (p=0.009). Two further genes were nearly significant: TLR2 (p=0.079) and PLXND1 (p=0.056).
In comparison, seven of the 10 whole blood gene panel in the test cohort showed reduced expression with treatment: CD36 (p=0.008), CD64 (p<0.001), ADAM9 (p<0.001), CSPG2 (p=0.029), TLR2 (p=0.003), HCA112 (p=0.012) and HPSE (p=0.001). To better define the differences between PBMC and whole blood samples, we tested the expression of neutrophils as a subgroup. In figure 3A the 10-gene panel is compared between whole blood and PBMC samples at the initiation of treatment (n=55). Seven genes demonstrate at least twofold greater expression in whole blood. When neutrophils were simultaneously isolated with PBMCs from a subset of samples (n=7, samples chosen from those with quantity sufficient to assay all 10 genes and HPRT control in triplicate) and expression compared between time points (figure 3B), neutrophils manifested at least twofold greater expression of the following four genes: TLR2, HPSE, CD64 and ADAM9 (all p<0.050).

Ratio of mRNA expression in cystic fibrosis (CF) whole blood and CF neutrophils compared with CF peripheral blood mononuclear cells (PBMCs). (A) Whole blood to PBMC mRNA expression drawn simultaneously before antibiotic treatment and normalised per copy of human hypoxanthine guanine phosphoribosyl transferase using quantitative real-time PCR (n=55). (B) CF neutrophil to PBMC mRNA expression from the same blood samples (n=7) before antibiotic treatment by quantitative real-time PCR *p<0.05 (paired t tests on absolute differences in log expressions between sample types within subjects).
To test whether differences in expression originated from differences in white blood cell (WBC) counts between the two time points, absolute numbers of neutrophils, lymphocytes and monocytes were compared between pre and post samples by paired t tests following log transformation (data not shown). Neutrophils and lymphocytes were the most predominant leucocyte populations, representing, on average, 70% and 20% of total WBCs before treatment and 67% and 21% of total WBCs after treatment. Monocytes represented 7% of all WBCs before and after treatment. Neutrophil and lymphocyte counts did not differ significantly with treatment, although absolute monocyte counts did decrease (p=0.040).
In the test cohort the effect of steroid treatment on gene expression was analysed. Pre- versus post-antibiotic gene expression was not significantly different in steroid-treated and steroid-naïve subjects in PBMC and whole blood samples (unpaired t tests), nor in neutrophil, lymphocyte and monocyte counts before and after antibiotics (not shown). We also analysed pre-antibiotic gene expression, CRP and FEV1 between steroid-treated and steroid-naïve groups to test for increased inflammatory signal in the group ultimately treated with steroids. The decision to give glucocorticoids was made by the treating physician, with initiation at varying times during the exacerbation treatment. While pre-treatment FEV1 and CRP were not significantly different, four whole blood genes were more highly expressed in those receiving steroids: CD163 pre (p=0.003), ADAM9 pre (p=0.012), TLR2 pre (p=0.013) and IL32α pre (p=0.013) (unpaired t tests).
Association of gene expression with FEV1, circulating leucocytes and CRP
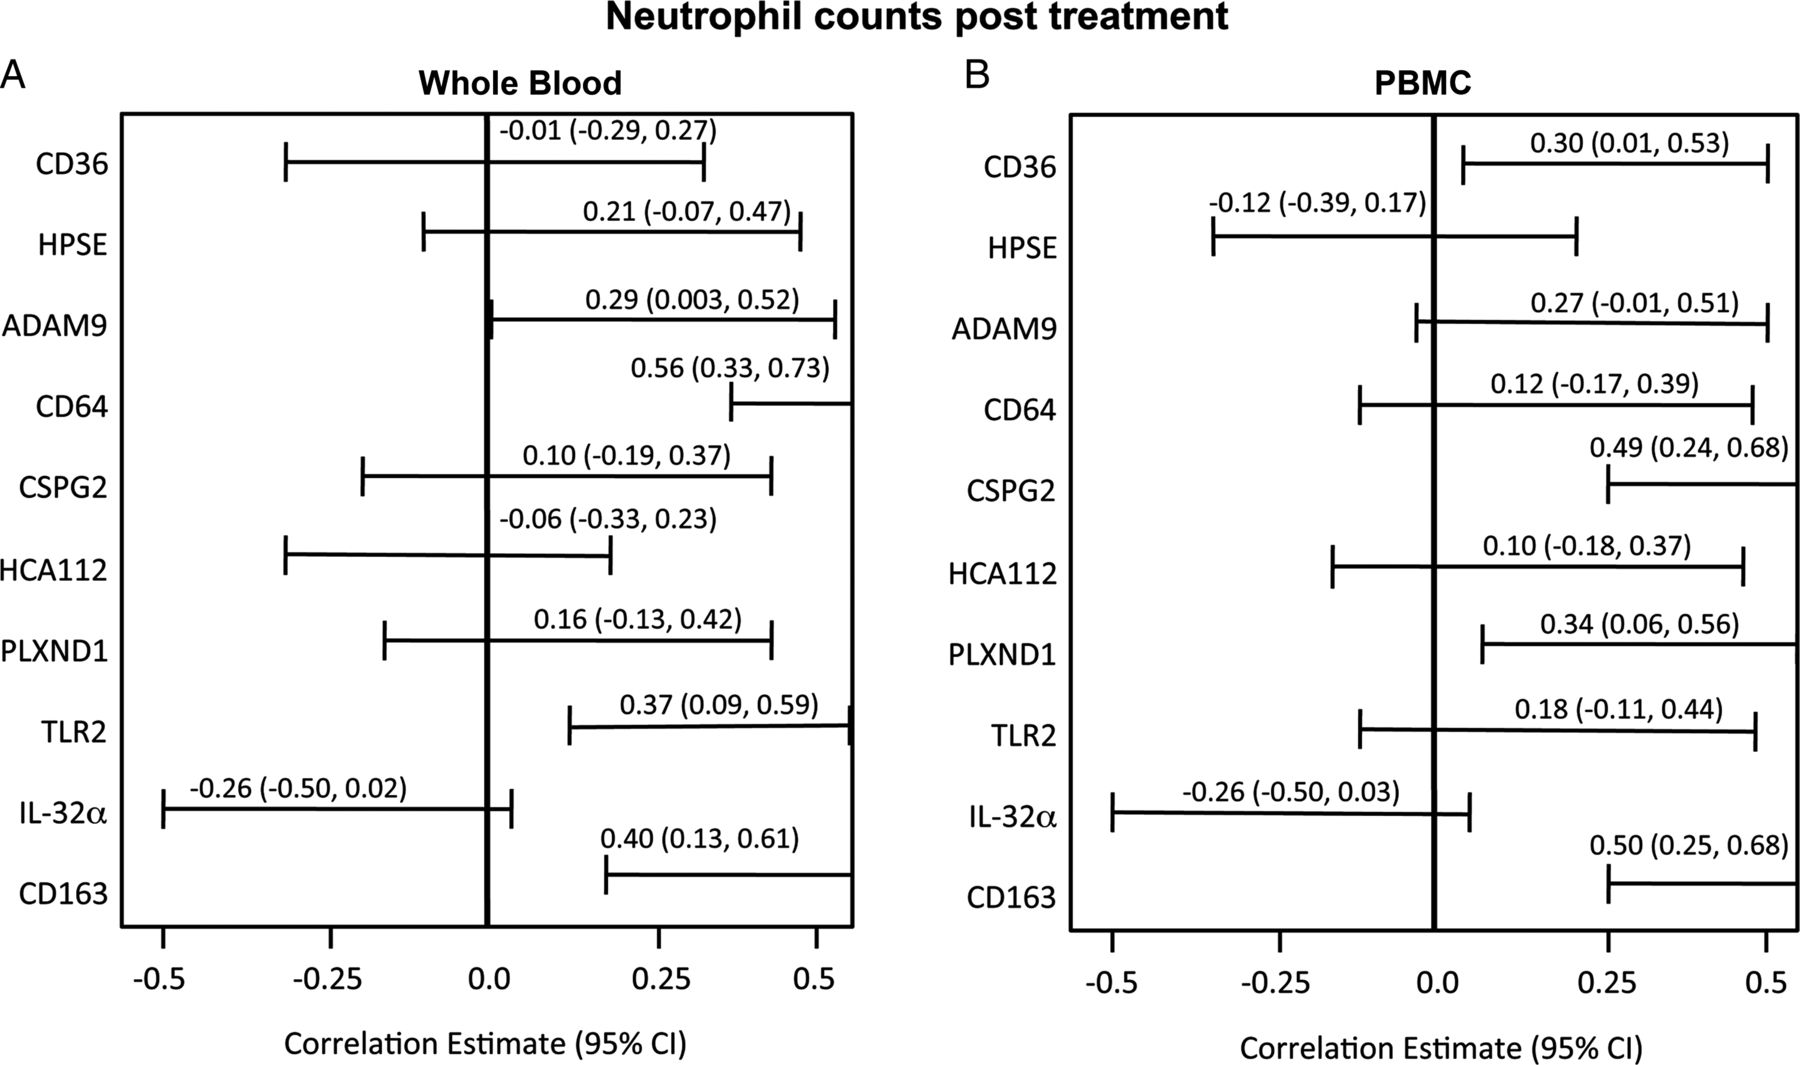
Post-treatment FEV1, WBC counts and CRP are commonly monitored to assess antibiotic response. In the test cohort, significant negative correlations existed between post-treatment FEV1 and four whole blood mRNA markers: CD36, CD64, ADAM9 and HPSE (figure 4). Whole blood CD36 mRNA expression had the greatest inverse correlation with FEV1 percentage predicted after treatment (r=−0.38, p=0.004). A significant positive association was present between the number of post-treatment neutrophils and four whole blood and PBMC mRNA transcripts at the completion of treatment (figure 5). While whole blood CD36 had the highest correlation with FEV1, other genes were more highly associated with neutrophil counts (CD64, r=0.56, p<0.001) and with CRP values (CD163, r=0.36, p=0.006, figure 6).

Association of peripheral blood mononuclear cell (PBMC) and whole blood genes with forced expiratory volume in 1 s (FEV1) percentage predicted after treatment (Pearson correlations with 95% CIs).

Association of peripheral blood mononuclear cell (PBMC) and whole blood genes with neutrophil counts after treatment (Pearson correlations with 95% CI).
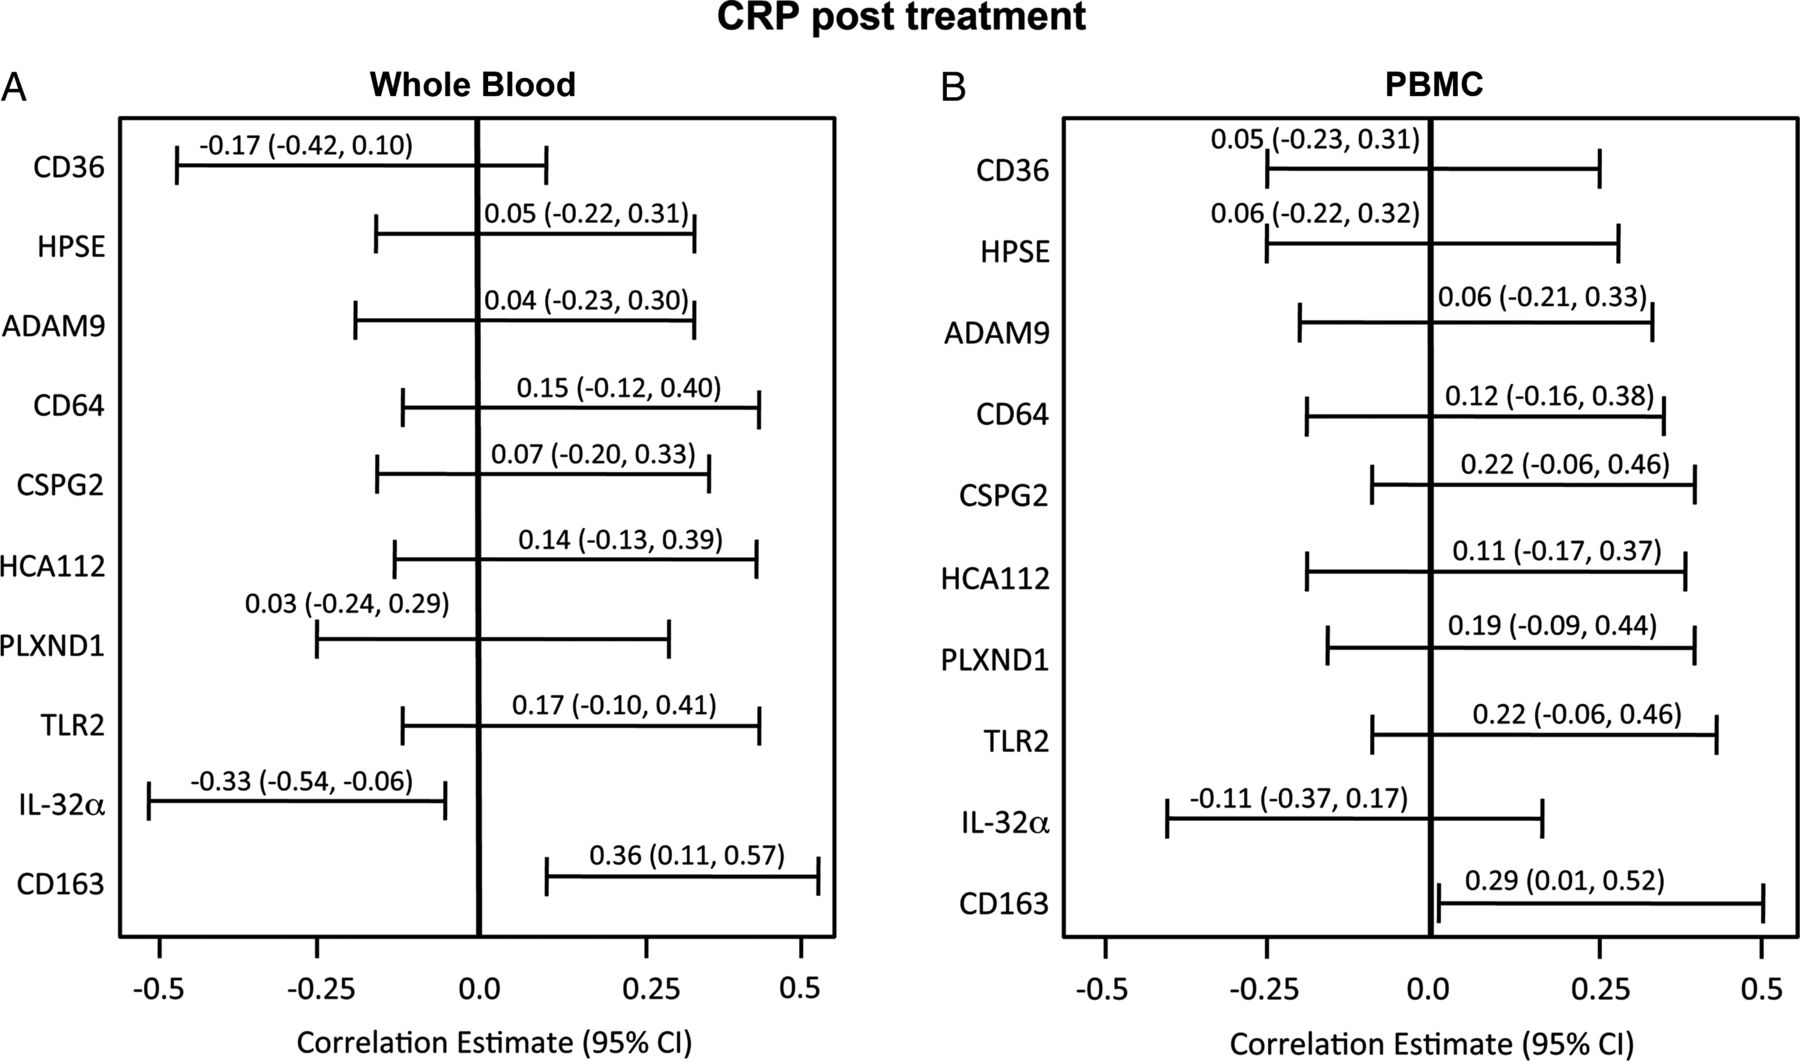
Association of peripheral blood mononuclear cell (PBMC) and whole blood genes with C reactive protein (CRP) after treatment (Pearson correlations with 95% CI).
Diagnostic accuracy of PBMC versus whole blood RNA for treatment effect
Performance statistics to predict the resolution of an exacerbation based on fitted logistic regression models for standard variables and for the most optimal combination of circulating mRNA transcripts are shown in table 2. Resolution was defined based on Rosenfeld score <2.6, a reduction of >0.3 log in total sputum cfu and <2×10⁷ cfu/mL global bacterial density after treatment. An ideal test would more accurately identify those who had responded to treatment than standard measures (specificity) while still predicting those with persistent illness (PPV). For the test cohort, a cut-off point of 0.5 on the probability outcome for the logistic regression model yielded a peak accuracy of 82% to determine reduction of infection when six whole blood gene predictors were incorporated and, at that cut-off point, the sensitivity of the panel was 77% and specificity 88%. The most sensitive standard predictor was CRP with a sensitivity of 82%, compared with FEV1 percentage predicted (74%); however, the specificity for either measure was not >54%. This six-gene panel combined with FEV1 had greater specificity (88%), improving the classification of subjects who had reduced infection after treatment (table 2), and demonstrated the highest accuracy from all possible combinations of genes entered into the model, with either FEV1 or CRP or both. Table 3 summarises ORs for each predictor. In the model, change in FEV1 percentage predicted is a strong predictor of treatment effect. For every 10% increase in FEV1, the odds of being resolved from exacerbation increased 23%. The strongest independent predictor of unresolved infection was CD64, the odds of which increased 37% for every 1000 unit increase in CD64 transcript.
Multivariate analysis of mRNA transcripts and standard outcome variables for treatment effect in cystic fibrosis (with 95% CIs)
Multiple logistic regression analysis of predictors of treatment effect in cystic fibrosis
We performed a post hoc analysis of the six-gene whole blood panel in subjects who recovered to ≥90% of their highest FEV1 in the preceding year. These pre-study data were available for 51 of 57 subjects who had prior FEV1 data and whole blood RNA samples from both time points. Baseline lung function following treatment was achieved in 43 of the 51 subjects (84%). The test was most accurate in this group (table 2), with greater specificity and PPV, due to a reduction in false positive results.
ROC curves (figure 7) demonstrate test performance of FEV1 combined with PBMC or whole blood expression compared with FEV1 alone (figures 7A and B). The most optimal pairing of PBMC genes (CD163, ADAM9, HPSE, IL32α, PLXND1) plus FEV1 slightly outperformed FEV1 alone (AUC=0.72 for combination vs 0.64). However, the combined explanatory power of six whole blood genes (CD163, CD64, IL32α, HCA112, PLXND1, TLR2) with FEV1 had an AUC of 0.81 compared with 0.64 for FEV1 alone (figure 7B) and 0.66 for CRP alone (not shown). Models with gene expression variables in addition to FEV1 yielded better (lower) QICu goodness of fit statistics than those with FEV1 alone (QICu=129.2 and 153.8, respectively, for whole blood; QICu=143.02 and 148.01, respectively, for PBMC).

Receiver operating characteristic (ROC) curves for peripheral blood mononuclear cell (PBMC) and whole blood gene combinations with forced expiratory volume in 1 s (FEV1) compared with FEV1 alone in predicting the microbiologic response with cut-offs for maximum accuracy. ROC curves depict the fraction of true positive (sensitivity) and false positive (1 − specificity) values plotted for RNA transcripts and FEV1 percentage predicted. A perfect test is indicated by AUC=1. (A) ROC curves for PBMC genes (CD163, ADAM9, HPSE, IL32α, PLXND1) plus FEV1 percentage predicted (AUC=0.72) versus FEV1 alone (AUC=0.64). (B) ROC curves for whole blood genes (CD163, CD64, IL32α, HCA112, PLXND1, TLR2) with FEV1 percentage predicted in the test cohort (AUC=0.81) and in the validation cohort (AUC=0.89) versus FEV1 alone (AUC=0.64).
As a validation, the fitted logistic regression model from the main study was used to predict outcomes in an independent cohort of the next 10 subjects admitted with a pulmonary exacerbation. Using the optimal probability cut-off point from the test cohort (0.5), the sensitivity was 50% and specificity was 100%, yielding an accuracy of 75%. The PPV was 100%. The AUC for the 10 validation subjects with the fitted model was 0.89, and lower probability cut-off points yielded even higher accuracy (up to 90% at a probability cut-off point of 0.3).
Discussion
This study is the first prospective evaluation of gene expression analysed directly from whole blood leucocytes to assess CF pulmonary inflammation. The assay obviates the difficulty encountered in measuring proteins from the serum compartment where dilution or binding to other molecules may decrease the signal and sensitivity. Multiple inflammatory pathways are represented by this panel (figure 8) such that the ‘orthogonal’ (uncorrelated) nature of these genes reflecting various disease pathways enhances the predictive value of the test.12 ,13

Known inflammatory signalling pathways as represented by the 10-gene panel. Pathways represent leucocyte activation and migration into tissues as well as phagocytosis and adaptive immune activation. ECM, extracellular matrix; EGF, epidermal growth factor; Hgb, haemoglobin.
To our knowledge, the current study represents the largest of a blood biomarker ever conducted in the context of CF treatment and is second only to a multicentre trial of sputum biomarkers.3 The markers allow comparisons of small cohorts, which is of key importance to the CF research community. The panel is broadly applicable to the scope of respiratory infections suffered by the US CF population as co-infection was common and pathogen prevalence closely approximated those for principal adult CF pathogens in the 2009 CF Registry (72% P aeruginosa infection, 23.8% with MRSA).14 The genes are sufficiently sensitive to register change even with reductions in bacterial density as small as 0.3 log. Furthermore, since blood was drawn within a 2-day time window of starting and ending treatment, the results conservatively estimate the true effect, with greater differences likely had all the measurements been obtained prior to treatment.
Expression of the gene panel is significantly associated with FEV1 (the current gold standard of CF pulmonary status), with CRP and with neutrophil counts. Neutrophils mediate CF airway pathogenesis, and the marked differences in expression (but not counts) before and after treatment suggest that circulating neutrophils are preactivated at the time of exacerbation as a prelude to recruitment towards their tissue targets in the lungs. In the model, the most significant predictor of treatment effect, outperforming FEV1, was CD64, which is expressed specifically with neutrophil activation and bacterial infection. CD64 has been shown to be a highly sensitive and specific biomarker for sepsis in adults and children in 24 studies, outperforming CRP and haematological assays.15–17 The assay demonstrates superior accuracy when neutrophil expression of the panel is incorporated, allowing for a test which is highly specific in identifying subjects who respond to exacerbation therapy, which was confirmed in an independent sample. Improvements in specificity, PPV and NPV all optimise classification of individuals who have had reductions in infectious burden compared with those who have not.
Measurements of mRNA are a potentially powerful tool to capture changes in disease state. Eukaryotic mRNA lifetimes last from minutes to days, and brisk turnover allows cells to rapidly modify protein synthesis in response to extracellular changes.18 Transcript measurements may serve as timely molecular signposts for the marked cellular changes accompanying important disease-specific events in a manner which cannot be captured by a WBC count or a CRP value. Furthermore, quantitative RT-PCR analysis is widely available in clinical laboratories. Our study confirms that RNA isolation from whole blood is straightforward, automatable and of high quality. Globin RNA does not interfere with quantification of relative changes in specific mRNAs from whole blood.19 ,20 The capacity to maintain RNA stability in whole blood, the availability of automated mRNA isolation and cDNA synthesis in addition to well-established PCR protocols now bring these measurements closer to clinical application. In future applications, prediction probabilities for resolution of inflammation could be calculated based on each individual's expression of transcripts within the panel.
The study setting of pulmonary exacerbation is an important consideration. A greater percentage of patients with CF require intravenous antibiotics to treat exacerbations with increasing age14 so, as patients live longer, the ratio of those who do not recover to baseline may certainly grow. A post hoc analysis of subjects in whom the FEV1 returned to baseline supports the utility of the panel as specificity was greater in that cohort. The potential exists for differential patterns of gene expression between patients with successful treatment and those who failed treatment. Future studies may determine how treating to ‘baseline’ inflammatory transcription compares with FEV1 as a therapeutic endpoint.
Corticosteroids were given to 37% of subjects in the test cohort. Steroid use did not affect the differences in gene panel expression, total WBC counts or leucocyte subset counts. The panel was originally identified in a cohort which did not receive corticosteroids, thus biasing gene selection away from those with a robust steroid response.7 When validated in a cohort in which steroids were allowed, nine of the 10 genes were independent of steroid regulation.7 In the current study steroids again did not significantly affect the primary outcome. However, significant differences existed in four genes before treatment in patients who ultimately received steroids, suggesting a possible role for pretreatment panel expression in quantifying more severe inflammation which merits steroid treatment, a decision which is currently based on clinical judgement. This observation may serve as an important exploratory endpoint to test in future multicentre trials.
Several study limitations should be acknowledged. The study was performed at a single large adult CF programme. Paediatric patients were not included and thus findings may not be generalisable to children with CF. The gene panel was studied in the absence of a gold standard diagnostic assay for CF inflammation. Sputum or bronchoalveolar lavage markers have the potential for direct assessment of airway inflammation. A multicentre study showed 0.5 log reductions in sputum neutrophil counts, interleukin 8 and neutrophil elastase after intravenous antibiotics.3 However, others have not found significant differences in sputum markers between periods of exacerbation and baseline health,5 ,21 ,22 and results have been mixed in clinical trials of therapeutic agents for CF lung inflammation.23–25 Technical issues may hamper validation of CF sputum biomarkers, and some patients may not be able to produce sputum samples after treatment. Thus, sputum markers were not included as a direct assessment of pulmonary inflammation. Instead, FEV1 and CRP, which represent the standard for assessing disease progression and response to treatment, were incorporated in modelling the best predictors of reduced bacterial counts. These circulating genes, all known mediators of inflammation,16 ,26–34 reflect local reductions in airway infection and inflammation, a possibility supported by recent data demonstrating the ability of systemic biomarkers to sensitively predict changes in CF inflammation.35 While small, the validation cohort replicated the high specificity and PPV seen in the test cohort. In this cohort with higher baseline FEV1 values, optimal accuracy was achieved at lower cut-off points than in the test cohort. Ultimately, a large multicentre trial with a broad representation of pulmonary function will be needed to determine the optimal cut-off points in a general CF population.
In conclusion, measurements of gene expression from whole blood are more accurate indicators of response to treatment than current standard measures alone. If testing of whole blood gene expression in a multicentre trial confirms these findings in larger populations, mRNA-based diagnostics may serve as a powerful and cost-effective tool to register timely changes in CF inflammation. The use of multiple gene transcripts as a composite endpoint incorporates multiple inflammatory pathways which may substantially empower future studies of strategies to modify the destructive impact of these important disease events on longitudinal lung health in CF.
References
Supplementary materials
Supplementary Data
This web only file has been produced by the BMJ Publishing Group from an electronic file supplied by the author(s) and has not been edited for content.
Files in this Data Supplement:
- Data supplement 1 - Online methods
Footnotes
-
Contributors JAN, MS and MTS conceived and designed the study and wrote the manuscript. LAS, BI, NJB and SMC performed the experiments. SJB, CSC, CMB, MCJ and CSC collected samples and compiled study subject clinical data. KCM, MS and MTS were responsible for data analysis and statistics. DPN, SDS and JLTC contributed to drafting of the manuscript. All authors approved the final draft for publication.
-
Funding Support for this work was provided by the Cystic Fibrosis Foundation, the National Institutes of Health (HL090991, to JAN) and the Rebecca Runyon Bryan Chair for Cystic Fibrosis.
-
Competing interests JAN has served on Advisory Boards for Gilead, Vertex, Novartis and Pharmaxis, received research funding from NIH, CFFT, Genentech and Gilead, and has performed clinical trials for Vertex which have been administered by his employer National Jewish Health. LAS, BI, NJB, SMC, KCM, SJB, CSC, CMB, MCJ, CSC, DPN and MS have no competing interests. JLTC has served on advisory boards for Genentech and Vertex, and has served as primary investigator for studies for Vertex and Glaxxo-Smith-Kline at National Jewish Health, with research funding from NIH and CFFT. SDS has received funding from CFF and NIH. MTS has served on Advisory Boards for Gilead and received research funding from CFFT and Gilead Sciences.
-
Ethics approval University of Colorado and National Jewish Health IRB.
-
Provenance and peer review Not commissioned; externally peer reviewed.
Linked Articles
- Airwaves