Article Text

Abstract
BACKGROUND Increased levels of exhaled nitric oxide (eNO) have been reported in asthmatic subjects but little information is available on eNO in patients with advanced chronic obstructive pulmonary disease (COPD). A study was undertaken to evaluate the levels of eNO in patients with stable COPD of different degrees of severity.
METHODS Peak and plateau values of eNO (PNO and PLNO, respectively) were evaluated in 53 patients with COPD and analysed according to the level of forced expiratory volume in one second (FEV1) and the presence of cor pulmonale (CP) (group 1, FEV1 <35% predicted with CP, n = 15; group 2, FEV1 <35% predicted without CP, n = 15; group 3, FEV1 >35% predicted, n = 23). Seventeen normal subjects served as controls.
RESULTS All the patients with COPD had reduced levels of PLNO compared with the controls (mean (SD) 6.3 (3.0) and 9.4 (2.8) ppb, respectively). In groups 1 and 2 PLNO levels were significantly lower than in subjects in group 3 (5.5 (2.9), 5.7 (3.5), and 7.1 (2.7) ppb, respectively; p<0.01 ANOVA). In all subjects % predicted FEV1 correlated slightly with PLNO but not with PNO.
CONCLUSION Patients with severe stable COPD have reduced levels of eNO compared with normal subjects. eNO levels are slightly related to the severity of airflow obstruction.
- exhaled nitric oxide
- chronic obstructive pulmonary disease
Statistics from Altmetric.com
Increased levels of exhaled nitric oxide (eNO), an index of NO synthesis in the respiratory system,1 have been detected in patients with asthma whereas smokers exhibit reduced levels of eNO.2 ,3 Similar levels of eNO were found in patients with chronic obstructive pulmonary disease (COPD) and in healthy subjects.4 More recently Maziak et al 5 have shown a negative correlation between forced expiratory volume in one second (FEV1) and eNO in patients with stable and exacerbated COPD. We wondered whether the levels of eNO might be influenced by the degree of severity of COPD as assessed by airway obstruction and by the presence or absence of cor pulmonale (CP). The aim of this study was therefore to measure the concentration of eNO in patients with stable COPD with different levels of airway obstruction, with and without CP.
Methods
SUBJECTS
Fifty three patients with COPD diagnosed according to the American Thoracic Society (ATS) criteria6 were enrolled, with a mean increase in FEV1 following inhaled bronchodilator (200 mg salbutamol) of 6 (2)% of the baseline. All patients were ex-smokers (mean pack years 24 (8)) without a history of atopy. At the start of the study they were all in a stable condition and had been free from exacerbations in the preceding four weeks. Patients with other organ failure, cancer, and inability to cooperate were excluded from the study. No patient was on long term oxygen therapy. All the patients received regular treatment according to the ATS guidelines.6
Patients were divided into three groups according to the severity of airflow obstruction (stage III or I–II of the ATS criteria)6 and the presence of cor pulmonale (CP): group 1, FEV1 <35% predicted and CP (n = 15, 14 M, mean (SD) age 66 (7) years, FEV1 23 (5)% predicted, forced vital capacity (FVC) 39 (7)% predicted, residual volume (RV) 174 (62)% predicted, total lung volume (TLC) 105 (29)% predicted); group 2, FEV1 <35% predicted without CP (n = 15, age 66 (9) years, 13 M, FEV1 32 (3)% predicted, FVC 48 (8)% predicted, RV 154 (36)% predicted, TLC 103 (22)% predicted); group 3, FEV1 >35% predicted (n = 23, age 67 (7) years, 21 M, FEV1 56 (10)% predicted, FVC 69 (10)% predicted, RV 130 (24)% predicted, TLC 100 (12)% predicted). Seventeen healthy non-smoking, non-atopic subjects (age 58 (11) years, 11 M) served as controls.
The study protocol was approved by the ethics committee of the Salvatore Maugeri Foundation, Gussago and the study was conducted according to the Declaration of Helsinki. Informed consent was obtained from the patients before enrolment into the study.
MEASUREMENTS
Static and dynamic lung volumes were measured with a volume constant body plethysmograph (CAD-NET System 1085, Medical Graphic Corp, St Pauls, Minnesota, USA). The predicted values were those of Quanjer.7
The presence of cor pulmonale was assessed by echo-colour Doppler evaluation (Sonotron, VingMed 750, Milan, Italy) using a mean pulmonary artery pressure of >35 mm Hg.
Exhaled nitric oxide was assessed with a high resolution (0.3 ppb) chemoluminescence analyser (LR 2000 Series, Logan Research, Kent, UK) adapted for on-line recording of NO concentration and equipped with a Teflon mouthpiece tubing. This feature obviates the need for collection into a reservoir with its variable loss of reactive NO; the sampling rate was 250 ml/min. The analyser also measured CO2 (resolution 0.1%, response time 0.2 s) by single beam infrared absorption as well as mouth pressure, exhaled flow, and volume. Mouth pressure and flow rate were calibrated using a water manometer and calibration analyser (Timeter RT-200, SLE Ltd, UK). An internal restrictor in the breathing circuit allowed expiration against a resistance in order to keep the soft palate closed and to prevent contamination of exhaled air with nasal NO; a single breath manoeuvre was performed according to the previously described methodology.5 ,8 Peak and plateau values of NO (PNO and PLNO, respectively, in ppb) were obtained from the eNO curve. The mean value of five reproducible measurements was used for analysis.
STUDY DESIGN
On the morning of the study day subjects free from medications for at least 12 hours performed spirometric tests according to the standard procedure. After a 30 minute rest in the sitting position they were asked to perform five consecutive manoeuvres to measure eNO according to the published recommendations.9
DATA ANALYSIS
All data are expressed as mean (SD). The PNO and PLNO values were transformed by square root to improve characteristics of data distribution. Intrapatient eNO data were analysed by ANOVA for repeated measures with Huynh-Feldt correction. As no significant difference within subjects was found, the mean of five consecutive measurements was used. The between group differences were evaluated by ANOVA and the post hoc test with Bonferroni correction was then used when requested. Linear regression by group was conducted to investigate the relationship between lung volumes and eNO variables in the study groups and to evaluate differences in slopes and intercepts. A p value of <0.05 was considered significant.
Results
Exhaled NO was detectable in all subjects. The mean (SD) coefficients of variation of intrapatient measurements were 5 (3)% and 6 (4)% for PNO and PLNO, respectively. The mean values of PLNO in patients with COPD were lower than in controls (table 1) but mean levels of PNO were not significantly different between the groups. All the patients with COPD had lower levels of PLNO than controls (6.3 (3.0) ppb and 9.4 (2.8) ppb, respectively). In groups 1 and 2 PLNO levels were significantly lower than in group 3 (5.5 (2.9), 5.7 (3.5), and 7.1 (2.7) ppb, p<0.01, ANOVA). The PLNO levels in patients in group 3 were not significantly lower than in controls but were significantly higher than in patients with more severe COPD, independent of the presence of CP.
Peak and plateau levels of expired nitric oxide (PNO and PLNO) in the study population and controls
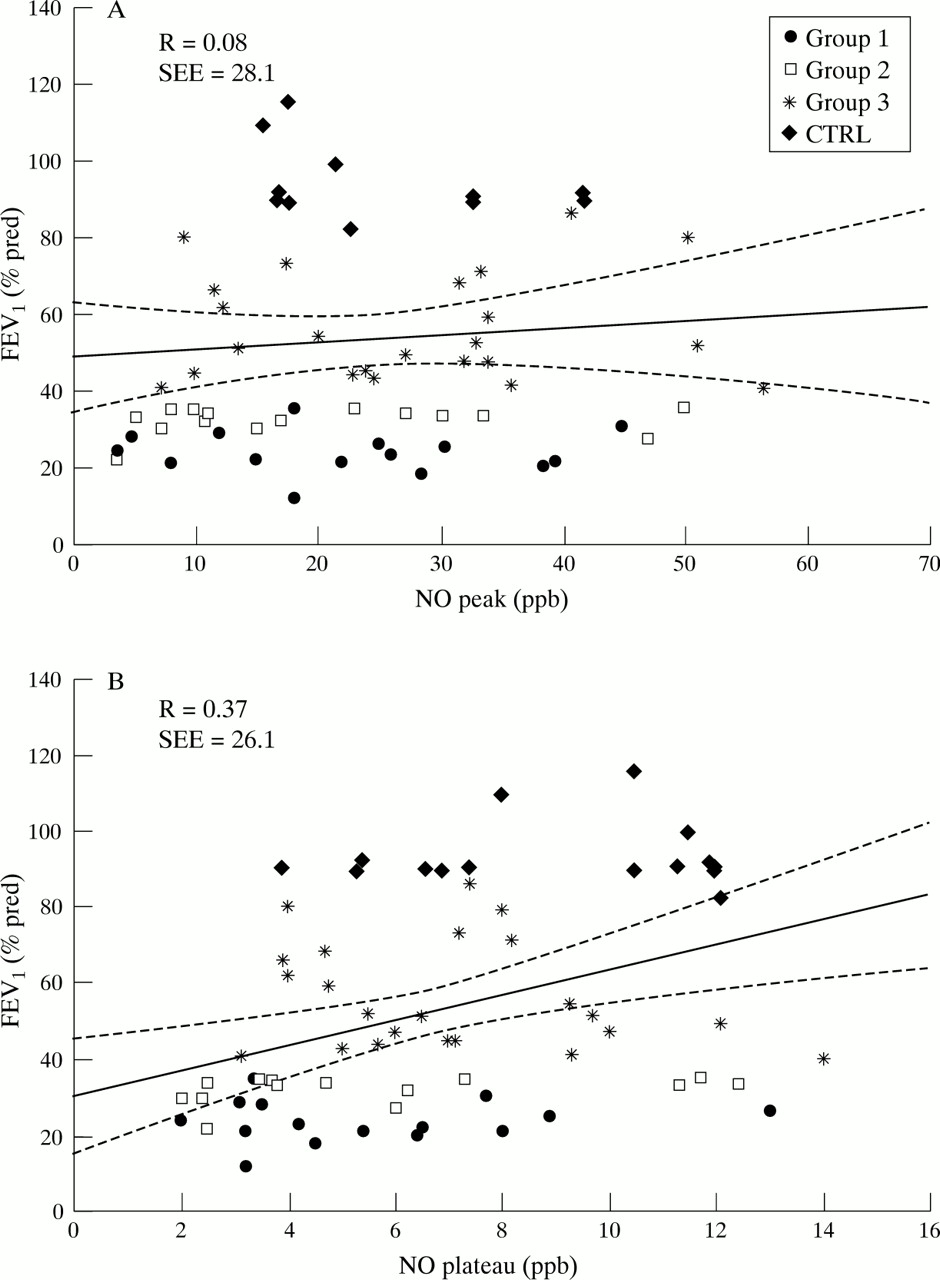
The linear regression analysis by group on all data for FEV1 % predicted versus PNO and PLNO (fig 1A and B) resulted in different slopes. A slight but significant correlation was found between FEV1 and PLNO (r = 0.37, p<0.01) and a less significant (p<0.05) relationship was found between FVC % predicted and PLNO. However, no significant correlations were found when only COPD data were analysed. No significant relationship was found between eNO (either assessed as PNO or PLNO) and RV and TLC, nor with the demographic data or previous smoking behaviour.
Scatterplot of linear regression by group between FEV1 % predicted and (A) peak and (B) plateau levels of exhaled nitric oxide (eNO). The continuous line on each graph fit all data when the study subjects were considered as a single group. For details of groups, see text.
Discussion
The results of this study show that, in patients with COPD, eNO levels are lower than in normal non-smoker subjects and are reduced in patients with more severe airway obstruction independent of the presence of cor pulmonale.
Robbins et al 4 found that peak oral NO levels in COPD patients with a mean FEV1 of 46 (5)% predicted were not significantly different from normal controls without any correlation between FEV1 or FVC and eNO. However, we found that patients in group 3, who were suffering from similar levels of airflow obstruction, had lower PLNO levels than controls. In addition, we extended the study to more severe COPD patients, both with and without CP.
The single breath technique used in our study is strongly recommended.9 We are confident that a constant flow exhalation was performed even in the most compromised subjects, as verified by the back-up visual control on-line system (flow and pressure) and by the reproducibility of the obtained values (mean variation coefficient less than 10% for both PNO and PLNO).
PNO is considered to be the result of the addition of eNO from previous exhalation and the unavoidable nasal contribution.10 PLNO better represents the production from the distal airways.10 Indeed, the different results in PLNO and PNO confirm the different sources of the two components.
Decreased levels of eNO have been associated with cigarette smoking and were found to be inversely related to cigarette consumption.3 In our sample of ex-smoker subjects with COPD we failed to find any relationship between eNO and previous smoking habit (pack years). In a recent paper by Maziak et al 5 eight ex-smokers with COPD (mean FEV1 48 (5)% predicted) had an eNO plateau level similar to that observed in our patients in group 3.
Giaid and Saleh11 have recently shown a reduced expression of endothelial NO synthase in pulmonary arteries of patients with pulmonary hypertension. In our study the presence of CP was not associated with different levels of eNO, at least not in our most severe patients (FEV1 <35% predicted).
The great scatter of individual values and the relatively small number of subjects could have limited the significance of the direct relationship between FEV1 or FVC and PLNO in our study group. In contrast to our results, Maziak et al 5 found an inverse relationship between FEV1 and eNO values in subjects with COPD and normal smoker controls. This is probably influenced by the fact that different groups involving smokers and ex-smokers were compared and by the presence of unstable COPD resulting in the development of acute infection and inflammation.