Article Text

Abstract
Background: Bronchial mucosal dendritic cells (DCs) initiate and regulate immune responses to inhaled antigens, viruses and bacteria. Currently, little is known of their numbers in patients with chronic obstructive pulmonary disease (COPD). While reductions in their numbers have been reported recently in smokers with asthma, nothing is known of the effects of cigarette smoking on bronchial DCs in COPD. The present study compares DC numbers in smokers and ex-smokers with COPD.
Methods: Endobronchial biopsies were obtained from 15 patients with moderate to severe COPD (10 current smokers with median forced expiratory volume in 1 s (FEV1) 45.5% predicted (range 23–68) and 5 ex-smokers with median FEV1 30% predicted (range 21–52)), 11 non-smokers with asthma (median FEV1 102% predicted (range 89–116)) and 11 non-smoker healthy controls (median FEV1 110% predicted (range 92–135)). Transmission electron microscopy (TEM) was used to identify the total population of DCs by their ultrastructure and their number in the epithelium and subepithelium was counted.
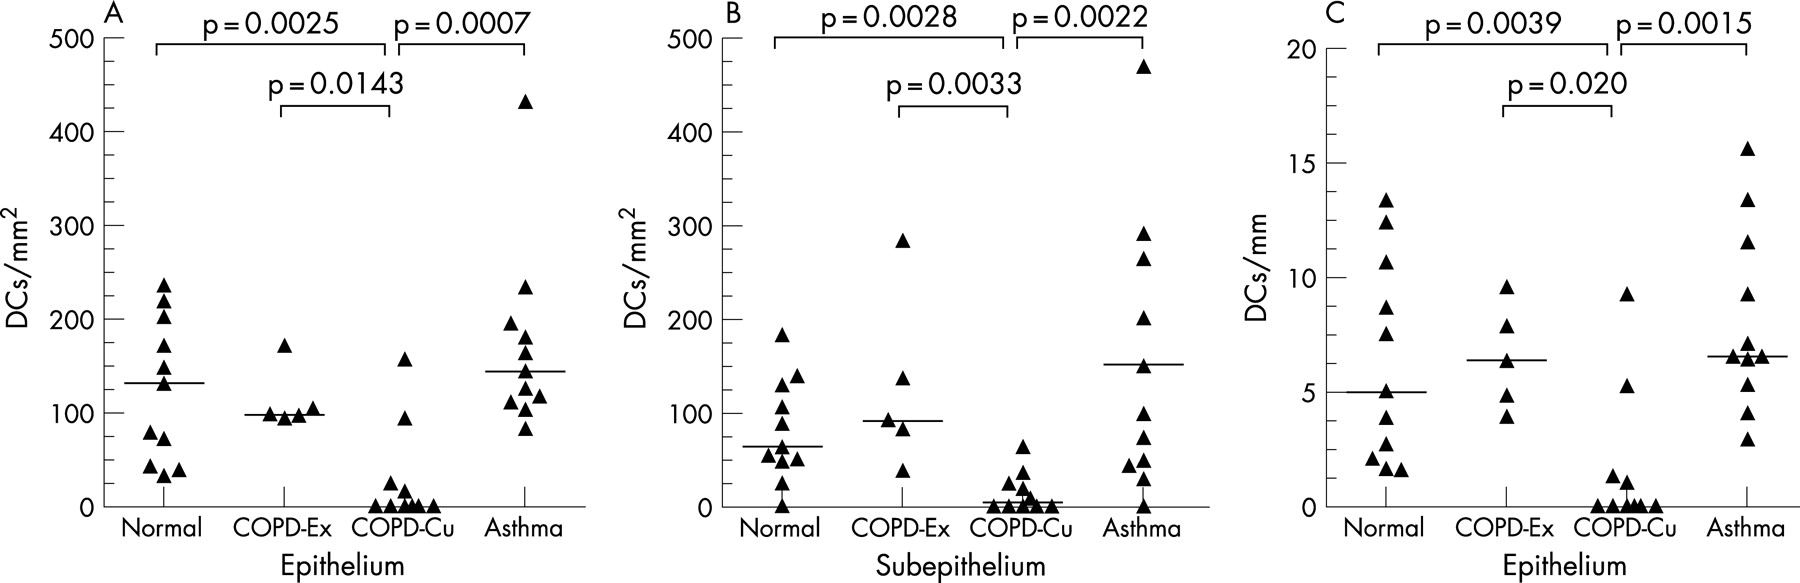
Results: Median (range) DC numbers were significantly lower in current smokers with COPD in the epithelium (0.0 (0.0–156.8) cells/mm2) and the subepithelium (4.5 (0.0–63.6) cells/mm2) compared with ex-smokers with COPD (97.9 (93.5–170.3) cells/mm2 in the epithelium (p<0.05); 91.8 (38.2–283.3) cells/mm2 in the subepithelium (p<0.01)). DC numbers in ex-smokers with COPD were similar to those in subjects with atopic asthma and healthy controls (131.6 (33.3–235.5) cells/mm2 in the epithelium and 64.4 (0.0–182.4) cells/mm2 in the subepithelium for the latter).
Conclusions: In COPD, bronchial mucosal DC numbers are lower in current smokers while, in those who quit, numbers are similar to non-smoking subjects with asthma and non-smoking healthy controls. The functional consequences of the reduction in mucosal DC numbers in smokers with COPD have yet to be determined.
Statistics from Altmetric.com
Chronic obstructive pulmonary disease (COPD) is a progressive inflammatory condition of the conducting airways and lung parenchyma and a major cause of death and increasing long-term care costs.1–3 Exposure to cigarette smoke in predisposed individuals is a major factor in the development of COPD.4 5 In COPD, increased numbers of CD8+ (cytotoxic) T lymphocytes are associated with reduced lung function.6–8 While inflammation is also increased in atopic asthma, the predominant T lymphocyte phenotype differs and is of the CD4+ (helper) phenotype.9–11 Bronchial dendritic cells (DCs) provide surveillance against inhaled allergen, viruses and/or bacteria that may breech the mucosal/environmental interface: they are the key antigen-presenting cells and influence the lung CD4+/CD8+ T cell ratio.
In smokers the bronchial mucosa and its transient DC population are exposed to the complex constituents of cigarette smoke. Nicotine has an immunosuppressive effect in vitro; cigarette smoke reduces the number of lung DCs experimentally and impairs the DC response to virus.12 In humans, cigarette smoking reduces DC precursors in cord blood13 and DCs have been shown to have a role in asthma.14 We have recently demonstrated, by immunohistology, a reduction of mature (CD83+) DCs in subjects with asthma who smoke,15 but it is unclear whether these effects are due to smoking per se or require an interaction between cigarette smoke and the asthma phenotype.16 Recently, two immunohistological studies have identified airway DCs in the airways of lungs surgically resected from patients with COPD, and an immunohistologically defined subset of DCs has been shown to be increased in the small airways (<2 mm) of patients with COPD.17 18 In contrast, nothing is known of their mucosal distribution in large airways and whether current smoking alters mucosal DC numbers in COPD.
Examination of airway tissues by transmission electron microscopy (TEM) potentially identifies all DCs, including the various subsets previously defined immunohistologically. TEM has already revealed the ultrastructural morphology of DCs in the lung19–21 and other tissues.22–24 In addition, we have validated the ultrastructural criteria required for the secure identification of DCs by TEM examination of a model system in which we have co-cultured DCs and bronchial epithelial cells. In this study we have used TEM to identify the entire population of DCs in bronchial biopsies, free of the complications of other pathologies and changes associated with end-stage disease. We have quantified DCs in endobronchial biopsy specimens from current and ex-smoker subjects with COPD and, as there has been no comparative study, we have included non-smoking subjects with asthma and normal healthy non-smoking control subjects. We tested the hypothesis that smoking reduces the number of DCs in the bronchial mucosa, independent of the asthma phenotype.
METHODS
Study population
The study complied with the declaration of Helsinki (see online supplement for further details). All subjects involved in the study gave written informed consent for endobronchial biopsies to be taken for analyses of inflammatory cells.
Four groups of subjects were studied (table 1): (1) 11 non-smoker non-atopic healthy control volunteers with normal lung function; (2) 5 ex-smokers with COPD who had moderate to severe airway obstruction by GOLD criteria;3 (3) 10 current smokers with COPD who had moderate to severe airway obstruction; and (4) 11 non-smokers with mild atopic asthma who required occasional bronchodilator treatment only. Patients with COPD and normal subjects were non-atopic. Patients with atopic asthma had a positive response to one or more skin prick tests with extracts of nine common allergens which included dog, cat, timothy, mugwort, birch, Dermatophagoides farinae, D pteronyssinus, Cladosporium and Alternaria (Phazet, Pharmacia, Uppsala, Sweden). Biopsy specimens were taken from the patients with asthma in the late autumn and winter to avoid the hay fever season; patients who had been exposed to a sensitising allergen within the previous 2 months were excluded. The patients with mild asthma were steroid naïve and none of the normal healthy controls had received such medication. Subjects with COPD taking inhaled corticosteroids at the time of recruitment had the drug withdrawn and were stable for at least 8 weeks before biopsy. Patients with a chest infection within 8 weeks were excluded from the study. All the remaining patients did not receive antibiotics.
Bronchoscopy
After an overnight fast and baseline spirometry tests, bronchoscopy was performed in the morning. In patients with COPD, biopsies were taken from the carinae of the second-order bronchi of the right middle and lower lobes. Biopsy specimens were taken from patients with asthma and normal control subjects at three sites in the left lung: (1) lobar carinae, (2) carinae of the basal segment, and (3) carinae of the lingular and upper divisions. A previous study of COPD has shown no differences in the inflammatory cell counts between segmental and subsegmental airway generations.6
Bronchial epithelial cell and DC co-culture
As myeloid CD1c+ DCs have been reported to predominate in the lung,25 26 we aimed to isolate and characterise ultrastructurally this population. Peripheral blood was obtained from a single non-atopic, non-smoker male donor (age 38 years) and CD1c (anti-BDCA-1) myeloid DC (CD1c+ LinnegCD11c+HLA-DR+) precursors27 were isolated by magnetic-activated cell sorting using a commercially available kit (Variomacs; Miltenyi Biotec, Bisley, Surrey, UK) (see online supplement for details of CD1c cell isolation). The isolated DCs were then co-cultured with epithelial layers formed from an immortalised bronchial epithelial cell line, BEAS-2B (a gift from Dr Curtis Harris, National Cancer Institute, Bethesda, Maryland, USA) grown on 5.0 μm pore size 6.5 mm polycarbonate Transwell membrane inserts (Corning Costar, Cambridge, Massachusetts, USA) (see online supplement for further details).
Transmission electron microscopy (TEM)
Bronchial biopsies obtained from two centres were prepared by a standard method for TEM. All the samples were fixed in 2.5% glutaraldehyde, post-fixed in 1.0% osmium tetroxide, dehydrated and embedded in epoxy resin, and all were subsequently examined at the Royal Brompton Hospital, London. Co-cultures were prepared in a similar manner. Areas of bronchial biopsy with intact epithelium and co-cultures were selected from 1.0 μm thick toluidine blue-stained survey sections. Ultrathin sections (70–80 nm) were contrast-stained and examined by TEM (Hitachi 7000; Nisei Sangyo, Japan).
Cell counts and image analysis
Nucleated cell profiles of DCs were counted (by AVR) in the epithelium and the entire subepithelium below the basement membrane, excluding areas with bronchial smooth muscle and submucosal gland. While not formally blinded, coded sections were used throughout and assessed randomly such that the investigator was unaware of smoking status or study group. TEM micrographs of bronchial mucosa at ×300 final magnification were scanned (ScanMaker X6; Microtek, California, USA) for determination of length and area by image analysis (NIH Image-based software, National Institute of Health, Maryland, USA).
Statistical analyses
The coefficient of variation (CV) for three repeat counts by one observer (AVR) of DC number by TEM was 3.5%. As the data were not normally distributed, non-parametric tests were applied (StatView 5 software; SAS Institute Inc, North Carolina, USA). The epithelial and subepithelial data from all four subject groups were compared first using the Kruskal-Wallis test. Where values of probability were ⩽0.05, selected pairs of groups were then investigated by the Mann-Whitney U test. Data are presented as median and range.
RESULTS
Ultrastructural identification and description of biopsy DCs
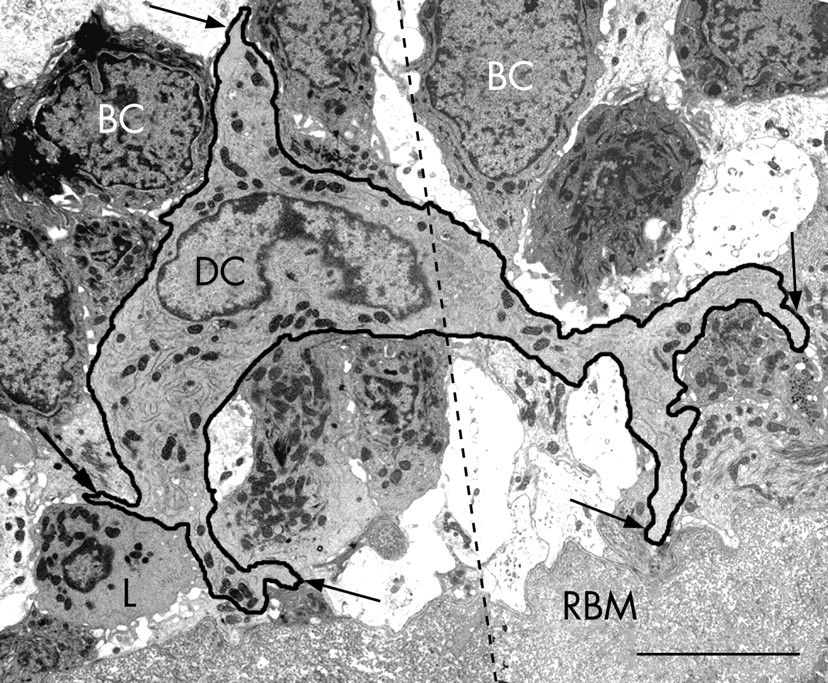
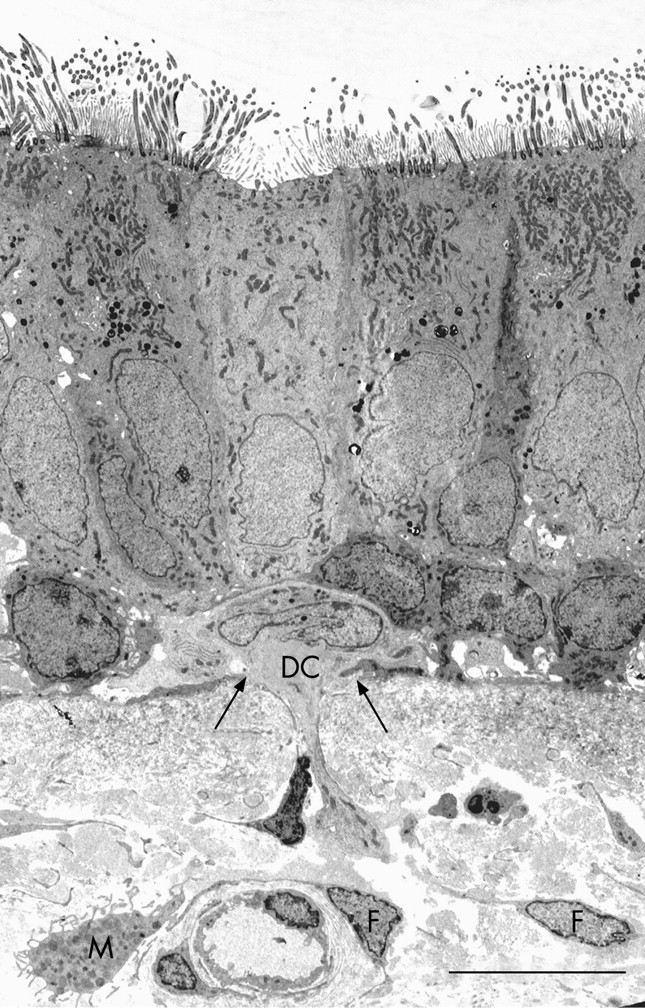
CD1c+ myeloid DCs in bronchial epithelial cell co-culture had indented nuclei with a peripheral distribution of heterochromatin, an abundance of cytoplasmic vesicles and, in those that migrated into the epithelial cell layer, cell body extensions/pseudopodia gave it a characteristic dendritic shape (fig 1A and B). The following features were used to identify myeloid DCs in the endobronchial biopsies: (1) the presence of pseudopodia; (2) nuclear indentation with peripheral distribution of heterochromatin; and (3) abundance of cytoplasm which was electron-lucent and containing numerous micropinocytic vesicles, profiles of endoplasmic reticulum and free ribosomes. Mucosal DCs also contained a Golgi apparatus, lysosomes and dense bodies (figs 2–5). Birbeck granules, the unique identifier of Langerhans cells (LC), were found in some but not all of the DCs present in two of the five ex-smokers with COPD. In all other respects, LCs shared the ultrastructural characteristics of DCs and were included in their counts (fig 3A–C). In the present study, no cell with the features of plasmacytoid DCs was found.19–24 28 29


Bronchial DCs were distinguished from other transient cells, for example: (1) lymphocytes with low cytoplasm to nuclear ratio and a non-peripheral distribution of nuclear heterochromatin; (2) plasma cells with abundant profiles of rough endoplasmic reticulum and a “clock-face” arrangement of nuclear heterochromatin; (3) mast cells with intracytoplasmic granules containing characteristic scrolls; (4) polymorphonuclear neutrophils with two types of small intracytoplasmic granules; (5) polymorphonuclear eosinophils with larger granules with crystalline cores; (6) basophils with large granules of homogenous content; (7) macrophages with numerous lysosomes and apoptotic bodies; (8) monocytes (rare) with their horseshoe-shaped nucleus; and (9) fibroblasts, elongate, bipolar, without the stellate cell body shape of DCs and present only in the subepithelium.
Distribution and counts of DCs in biopsy specimens
Epithelial DCs were distributed at the level of the basal cells, close to the basal lamina (figs 2A and 4), and subepithelial DCs were found adjacent to the reticular basement membrane (fig 2B and 3A and B). In healthy non-atopic individuals, DCs were identified traversing the epithelial basal lamina (fig 5) and were also observed in the lymphatic system (fig 6A–C). Table 2 summarises the DC counts and fig 7A–C shows dot plots of the individual subject data.

In smokers with COPD there were at least 100-fold fewer intraepithelial DCs/mm2 compared with ex-smokers with COPD (p<0.05). This was mirrored in the subepithelium where current smokers with COPD had 20-fold fewer cells/mm2 than ex-smokers with COPD (p<0.01). Intraepithelial DC numbers in smokers with COPD were 100-fold fewer than in healthy non-atopic controls (p<0.01) or subjects with atopic asthma (p<0.001). DCs (cells/mm2) in the subepithelium of current smokers with COPD were significantly lower than that of both normal non-atopic controls (p<0.01) and subjects with asthma (p<0.01) with 15-fold and 20-fold differences, respectively.
Expressed as cells/mm length in order to allow comparison with previously published data (see table 2 and fig 7C), smokers with COPD had at least sixfold fewer (cells/mm) intraepithelial DCs than ex-smokers with COPD (p<0.05). They also had fivefold fewer intraepithelial DCs than both normal non-atopic controls (p<0.01) and those with atopic asthma (p<0.01). DC numbers in subjects with atopic asthma were similar to those in non-atopic controls in both the epithelium and subepithelium. The findings are therefore consistent no matter which way the data are expressed.
DISCUSSION
We have applied an ultrastructural approach to identify all bronchial mucosal DCs, irrespective of their immunophenotype. We present, for the first time in COPD, the ultrastructure of bronchial DCs and show that current smoking is associated with abnormally low numbers of these sentinel cells. Current smokers with COPD had 100-fold fewer intraepithelial DCs and 20-fold fewer DCs in their subepithelium compared with the bronchi of ex-smokers with COPD. Moreover, the effect appears to be driven primarily by current smoking per se and is not dependent on its interaction with an asthma phenotype, a possibility considered recently by Tsoumakidou and colleagues.15
Our DC counts in normal healthy individuals were of a similar order to those of CD1a+ cells/mm reported previously for normal lung tissue of non-smokers.20 Also in agreement with Moller and co-workers, we found no difference in DC counts expressed per mm epithelium between healthy controls and subjects with asthma. However, in absolute terms, our count in subjects with asthma of 6.5 (3.9–9.5) DCs/mm by electron microscopy was higher than theirs of 0.4 (0.0–5.3) CD1a+ cells/mm.14 Jahnsen and co-workers reported bronchial epithelial DC counts of 1.7 cells/mm in patients with asthma, increasing to 3.0 cells/mm after challenge, which is considerably less than our counts. This was mirrored in the subepithelium (baseline DC number 7.8 CD1c+ HLA-DR (Ia)+ cells/mm2 increasing to 22.4 cells/mm2 following allergen challenge).25 In contrast, the subepithelium of our patients with stable asthma, although biopsied outside the hay fever season, had more than 10 times this number. These divergent results support the idea that the number of DCs identified by existing immunomarkers underestimates the total DC population, and emphasises the need to find and validate a pan-specific immunomarker that will identify all DCs. While DC-SIGN has been considered a putative pan-specific marker, this has recently been thrown into question as its epitope may also be expressed by B lymphocytes.30
The recent immunohistological study of small airways by Demedts and colleagues17 and earlier studies in vivo20 31 reported an increased accumulation of bronchial DCs in smokers whose lungs had either been resected primarily for cancer or sampled by bronchoalveolar lavage. The antibody used by Demedts and co-workers was directed against Langerin expression which is lost as DCs mature, suggesting that their data do not reveal the total DC population. In an earlier study, Soler and colleagues applied an antibody (OKT6) that identifies the CD1a DC subset and found that their numbers in the large airways were unchanged by smoking whereas there were greater numbers in the lung parenchyma of smokers than in non-smokers.20 In murine studies, D’hulst et al showed that cigarette smoke increased the level of putative DCs in both bronchoalveolar lavage fluid and the lung parenchyma.26 Also, Zeid and Muller studied smoke-induced Langerhans cell granulomatosis and observed accumulations of lung Langerhans cells, but these returned to control levels after cessation of exposure.32 We consider that the differences between these studies and ours lie in the distinct populations of DC quantified, the lack of exclusivity for DC by immunohistochemistry and/or the nature and site of the tissue examined (eg, surgically resected tissue in which small airways and lung parenchyma are examined versus endobronchial biopsy of large airways).15 18 Moreover, in support of our present findings, Robbins and colleagues have shown that exposure to cigarette smoke in mice reduces lung DC numbers and impairs the DC response to virus.12 Nouri-Shirazi and Guinet demonstrate further, in vitro, that nicotine contributes to the immunosuppressive effect of smoke on DCs by reducing their capacity to stimulate T cells33 and to secrete interleukin-12 which promotes Th1 T cell polarisation.34–36 Accordingly, cigarette smoke has been shown in vitro to suppress DC maturation,37 and incubation of lipopolysaccharide-matured DCs with sputum from patients with COPD decreases expression of co-stimulatory molecules on mature DCs and inhibits DC maturation.38 Another immunohistochemical study of endobronchial biopsies from patients with asthma has recently reported that current smokers have reduced numbers of mature (ie, CD83+) DCs in their bronchial mucosa compared with never-smokers with asthma or healthy never-smokers. The alteration of this mature DC subset was accompanied by a significant reduction in B lymphocytes and a trend towards decreased numbers of cells expressing the Th1 cytokine interferon-γ.15 We have thus added our ultrastructural approach to the apparent controversy and demonstrate that cigarette smoke is associated with lower overall numbers of DCs per se rather than modulation of their immunomarkers alone. We speculate that cigarette smoke exposure is associated with migration of DCs away from the mucosa to local lymph nodes or with suppression of their recruitment to and accumulation in the bronchial mucosa. Cigarette smoke may also induce apoptosis of DCs, but ultrastructural evidence of apoptosis was not observed in our study.
Immunohistochemical studies alone are likely to underestimate the total numbers of bronchial DCs. Immunomarkers such as CD1a identify DCs, but this marker is expressed only by approximately 30% of all bronchial epithelial DCs: these are primarily within the surface epithelium and include Langerhans cells.18 39 An immunomarker identifying CD1c (blood dendritic cell antigen (BDCA-1) has also identified a further DC subset in human bronchial mucosa, but this subset is primarily located within the subepithelium.18 20 Other light microscopic investigations of the bronchial mucosa in normal subjects have shown that HLA-DR (Ia)+ cells of dendritic morphology form a contiguous network within the epithelium of conducting airways,40 41 but this marker is also expressed by macrophages/monocytes42 and by epithelial cells.43 For these reasons, we have applied the ultrastructural approach to identify and count the total DC population, independent of their immunostaining characteristics. Thus, our data indicate that current cigarette smokers have fewer of these cells in their bronchial mucosa than ex-smokers or never-smokers, a consistent finding unrelated to whether the patients have COPD or asthma.
We acknowledge that the major site of pathology and obstruction in COPD are the small airways, whereas we and others (cited above) have sampled the large airways (ie, bronchi). However, the inflammatory process and its pattern is known to be present throughout the entire tracheobronchial tree—for example, in respect of CD8+ cells, B lymphocytes and in the identification of DCs.6–8 18 We therefore consider that the changes in DCs identified in the bronchial mucosa by TEM may also occur in the small airways but are missed owing to application of immunohistology alone. Alternatively, we have sampled large airways by bronchial biopsy which restricts our examination to the mucosal zone where the effects and concentrations of smoke may be quite different from those occurring deeper in the bronchiolar wall. We also appreciate that differences in the ages of the subject groups might affect our interpretation of the data. However, the ex-smokers and current smokers in our COPD group had a similar median age. Moreover, in the paper by Tsoumakidou and colleagues,15 patients with asthma were matched for age but there were still fewer DCs in the smokers. We therefore consider that the differences we report cannot be accounted for by age alone. We accept that inclusion of a control group of smokers without COPD would have provided additional information as to the effects of smoking per se. Finally, this was an exploratory study and no formal sample size was calculated so we acknowledge that small additional differences between our groups could have been missed. We hope that our observations will assist in the planning of future studies.
In summary, the application of TEM in the present study allowed enumeration of all DCs. Our novel findings demonstrate that there are markedly fewer DCs in the bronchial mucosa of patients with COPD who currently smoke, whereas ex-smokers with COPD have DC numbers that do not differ from healthy subjects or those with mild asthma. Thus, quitting smoking would appear to have the effect of returning DC numbers in smokers with COPD to levels similar to those seen in non-smoking healthy individuals. We consider it reasonable to speculate that smoke-induced reduction of the overall number of DCs in COPD and of their mature subset in asthma, together with the findings of reduced DC function reported by others, would in consequence alter normal immunity and the pattern of inflammation. This may facilitate infection by virus and lead to increased exacerbation frequency. The relationships between DC number, the underlying chronic inflammation of COPD and susceptibility to acute infection and exacerbation require further study.
Acknowledgments
The authors thank the subjects and are grateful to Professors Neil Barnes and Paul O’Byrne for their help and support.
REFERENCES
Footnotes
-
Funding: The study was supported by Lung Pathology departmental funds.
-
Competing interests: None.
Linked Articles
- Airwaves