Article Text

Abstract
Background Collateral ventilation has been proposed as a mechanism of compensation of respiratory function in obstructive lung diseases but observations of it in vivo are limited. The assessment of collateral ventilation with an imaging technique might help to gain insight into lung physiology and assist the planning of new bronchoscopic techniques for treating emphysema.
Objective To obtain images of delayed ventilation that might be related to collateral ventilation over the period of a single breath-hold in patients with chronic obstructive pulmonary disease (COPD).
Methods Time-resolved breath-hold hyperpolarised 3He MRI was used to obtain images of the progressive influx of polarised gas into initially non-ventilated defects.
Results A time-series of images showed that 3He moves into lung regions which were initially non-ventilated. Ventilation defects with delayed filling were observed in 8 of the 10 patients scanned.
Conclusions A method for direct imaging of delayed ventilation within a single breath-hold has been demonstrated in patients with COPD. Images of what is believed to be collateral ventilation and slow filling of peripheral airspaces due to increased flow resistance are presented. The technique provides 3D whole-lung coverage with sensitivity to regional information, and is non-invasive and non-ionising.
- Collateral ventilation
- COPD
- MRI
- patho-physiology
- COPD pathology
- imaging/CT MRI etc
- lung physiology
- asthma
- COPD mechanisms
- emphysema
- exercise
- non-invasive ventilation
- sleep apnoea
- not applicable
- cystic fibrosis
Statistics from Altmetric.com
- Collateral ventilation
- COPD
- MRI
- patho-physiology
- COPD pathology
- imaging/CT MRI etc
- lung physiology
- asthma
- COPD mechanisms
- emphysema
- exercise
- non-invasive ventilation
- sleep apnoea
- not applicable
- cystic fibrosis
Key messages
What is the key question?
Is it possible to visualise collateral ventilation in chronic obstructive pulmonary disease (COPD) during a single breath-hold using a non-invasive, non-ionising imaging technique?
What is the bottom line?
We demonstrate direct imaging of delayed gas filling in what we believe to be collateral ventilation in patients with COPD, using hyperpolarised gas MRI.
Why read on?
The ability to image and quantify collateral ventilation pathways directly may increase the understanding of pathophysiology in COPD and aid assessment for treatments.
Introduction
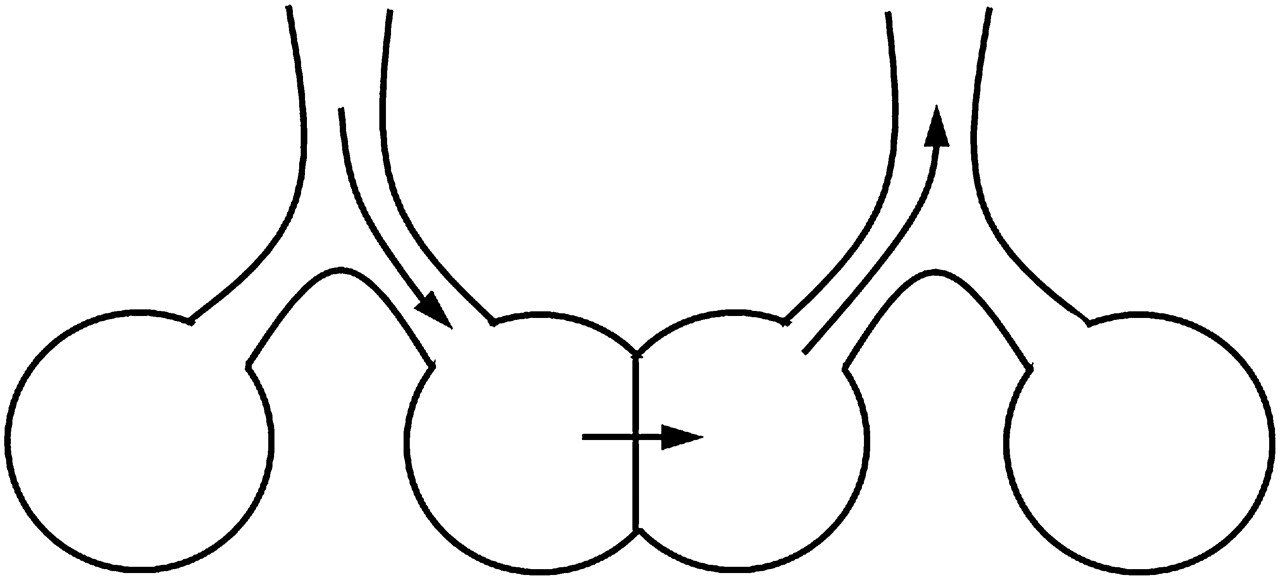
Collateral ventilation pathways have been proposed as a mechanism of increased tolerance to obstructive lung diseases by enabling alternative respiratory pathways to carry out gas exchange,1 ,2 see figure 1. In addition to gaining insight into lung physiology, the assessment of collateral ventilation with an imaging technique might help with the planning of new bronchoscopic techniques for treating emphysema.2 ,3 In bronchoscopic lung volume reduction, collateral ventilation from adjacent lobes prevents the target atelectasis,4 whereas in airway bypass treatment the presence of collateral ventilation can be advantageous.5

A graphical representation of collateral ventilation, adapted from Hogg et al.1
Catheter-based techniques6 have been used to measure collateral ventilation but a non-invasive method is desirable. Radiological CT scores of emphysema are significantly linked to interlobar collateral ventilation,7 and 133Xe scintigraphy8 and xenon-enhanced dynamic dual-energy CT9–11 have been used to obtain images of collateral ventilation. However, these techniques monitor the wash-in and wash-out of a tracer gas over multiple breathing cycles, and both use ionising radiation. Long-range diffusion measurements with hyperpolarised 3He MRI are also potentially sensitive to collateral ventilation.12–14 Lung structure at the acinar level influences the long-range apparent diffusion coefficient (ADC), which is related to the path of gas through the peripheral airways. High long-range ADC values suggest the presence of collateral pathways because the gas has diffused more quickly than it could have done by navigating healthy airways.13 However, the measurement of long-range ADC is indirect and as such can only imply that collateral ventilation is taking place.
Here we present direct visual evidence of delayed gas ventilation at breath-hold in what we believe to be collateral ventilation in chronic obstructive pulmonary disease (COPD). Images were acquired over the period of a single breath-hold using a non-invasive and non-ionising imaging modality. Delayed filling of peripheral regions was also seen in some patients, which is thought to be due to increased resistance in the small airways. Time-resolved hyperpolarised 3He MRI was used to image delayed ventilation in patients with COPD with whole-lung coverage.
Methods
Ten patients with COPD were scanned using a 1.5 T whole-body MRI system (GE HDx, Milwaukee, Wisconsin, USA) equipped for hyperpolarised 3He imaging. The inclusion criteria were COPD without other significant respiratory disease as diagnosed by a respiratory physician, post-bronchodilator ratio of forced expiratory volume in 1 s (FEV1) to forced vital capacity <0.7, post-bronchodilator FEV1 ≥30% and ≤80% of predicted, cigarette smoking history of ≥10 pack-years and resting pulse oximeter oxygen saturation of >90% on room air.
3He was polarised on site to 25% using rubidium spin-exchange15 apparatus (GE Healthcare, Amersham, UK) under a regulatory approved licence. Imaging was performed with ethics committee approval and written consent. Subjects were positioned in a 3He quadrature transmit–receive vest coil (Clinical MR Solutions, Brookfield, WI, USA). A mix of 200 ml hyperpolarised 3He and 800 ml N2 was inhaled from a state of relaxed expiration, and 3He images were acquired during the breath-hold. A 3D coronal spoiled gradient echo sequence16 with full lung coverage was used for imaging with the following parameters: field of view 35 cm2, in-plane matrix 64×32, 16×20 mm slices, flip angle 1°, band width 62 kHz, echo time 0.8 ms and repetition time 2.5 ms. This 3D volume was acquired at six time-points during the single breath-hold; at 0, 1.3, 5.8, 10.3, 14.8 and 19.3 s.
The time-course images were analysed for any ventilation defects present in the first time-point image, which subsequently filled with gas during the breath-hold. A pattern of gas filling with gas moving gradually from the edges of the defect towards the centre was identified as being suggestive of collateral ventilation.
Results
The patients with COPD scanned (five male, five female) had a mean age of 60.6 years, a mean smoking history of 39.5 pack years and a mean FEV1% predicted of 49.6%. Ventilation defects with delayed filling were seen in eight of the 10 patients with COPD scanned (table 1). These examples varied in defect size, number and fill-rate from the most visibly striking case shown in figure 2 to much more subtle effects such as those seen in patient 3 in figure 3. Fifteen slow-filling ventilation defects were identified, eight of these were seen to fill from the edge(s) of the defect and seven were too small to determine the gas fill pattern.
Patient demographics, lung function and delayed-filling ventilation defect information

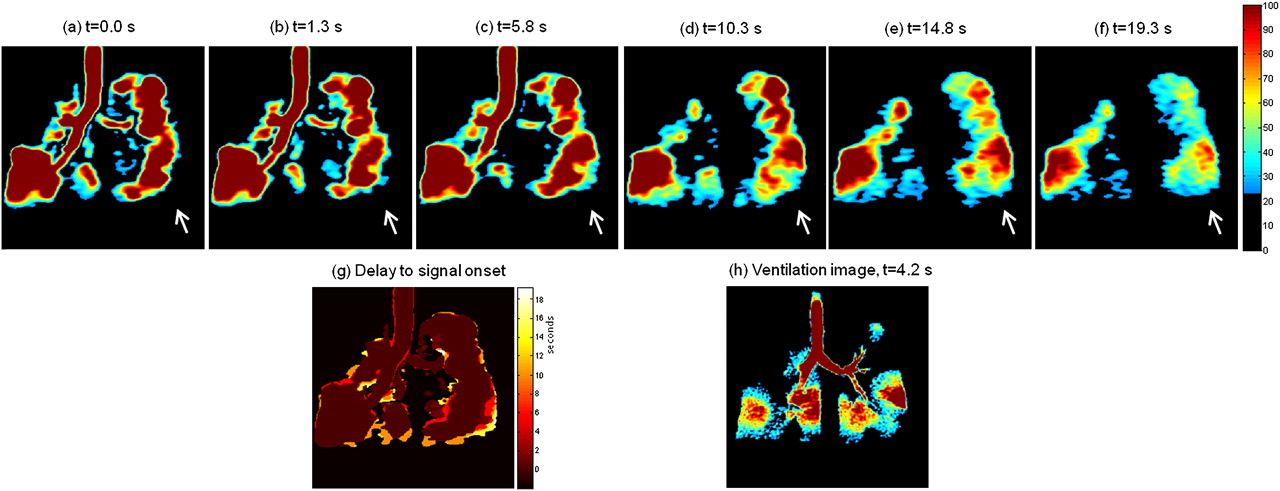
Images tracking collateral ventilation in a patient with chronic obstructive pulmonary disease (COPD). Images (A) to (F) show the same coronal slice at six different time points during a single breath-hold. The colour scale is the same for all images (A) to (F). The arrows indicate two collaterally ventilated defects, and the top row shows magnifications of the largest defect. (G) A sagittal reformat of the first time-point data and (H) A sagittal reformat of the last time-point data with the coronal slice position indicated with a dashed white line. (I) A delay to signal onset map for the coronal slice with time scale in seconds. (J) A high-resolution CT (HRCT) image of a similar slice. (K) A high-resolution 3He MRI ventilation image of the same coronal slice acquired in the same scanning session.

Images showing delayed ventilation in two other patients with chronic obstructive pulmonary disease (COPD); (top row) patient 2, (bottom row) patient 3. (A) The first time-point data. (B) The last time-point data, arrows highlight ventilation defects which fill with gas during the course of the breath-hold. (C) The delay to signal onset map. (D) A high-resolution ventilation image of the same slice. (E) to (H) show the same respectively for patient 3.
Figure 2A–F shows a single coronal image slice acquired from one of the patients at the six time-points. Two initially non-ventilated defects, which gradually filled with 3He over the time-course of the breath-hold are highlighted with arrows. The largest defect is magnified in the top row. The images are all displayed with the same colour scale, the magnitude of which is proportional to the density of 3He in that pixel. The hyperpolarised 3He MR signal is non-renewable and diminishes over time owing to both the imaging procedure and natural T1 relaxation processes due to the presence of oxygen.16 In normally ventilated regions of the lung this expected signal decay over time is observed and has been used to infer lung oxygen partial pressure.17 However, in the regions indicated the signal increases over time, with a progressive influx of polarised gas from the edge of the defects towards the centre. Sagittal reformats through the right lung at time-points t=0 s (G) and t=19.3 s (H) illustrate the 3D nature of the upper lobe ventilation defect and the related wash-in of gas. The delay to signal onset map (figure 2I) shows the time taken in seconds from the start of the data acquisition until gas arrived at each pixel. The gas-filling pattern from both of the defect edges towards the centre is not consistent with the defects being ventilated via their feeding bronchi. This suggests that gas is entering the defects via collateral pathways at the defect edges.
High-resolution CT images (eg, figure 2J) show that this patient has severe bilateral emphysema—in particular, pan-lobar disease affecting the right upper and lower lobes. The two ventilation defects in the right lung seen in figure 2 correspond to more severe disease than the surrounding tissue. There is no difference in lung structure discernible by high-resolution CT between the slow-ventilated upper defect and the defect in the lower right lung, which does not ventilate at all.
Figure 3 shows examples of slow-filling ventilation defects in two other patients. In one patient (top row) several wedge-shaped defects along the peripheral edge of the right lung are filled over the course of the breath-hold. In another patient (bottom row) delayed ventilation of a wedge defect on the outside edge of the left lung is seen.
An example of delayed filling of a peripheral ventilation defect is shown in figure 4. The slow filling of the defect at the lower left lung edge, with a front of gas progressing slowly towards the lung edge, may be due to increased resistance to air flow in the peripheral airways.

Images showing slow filling of a peripheral ventilation defect. Images (A) to (F) A coronal slice at six time-points during the breath-hold. (G) A delay to signal onset map and (H) A high-resolution ventilation image of the same slice.
Discussion
Ventilation defects with delayed filling in a pattern consistent with collateral ventilation were seen in 40% of the patients scanned. Delayed-filling ventilation defects were present in 80% of the patients but some were too small to suggest which mechanism might cause the delayed ventilation.
Delayed filling of ventilation defects may be due to collateral ventilation, partial obstruction, lung hyperinflation (air trapping), narrowing of the peripheral airways or a mixture of such mechanisms. However, in cases where the pattern of 3He filling is visibly seen to progress from the defect edges towards the centre (eg, figure 2) we believe that the slow filling is due to collateral ventilation. The example shown in figure 4 with peripheral delayed filling might represent sensitivity to peripheral airways flow resistance in the ‘quiet zone’18 of the lungs.
Collaterally ventilated defects may arise from centrilobular emphysema,19 where centrilobular spaces form in lobules with obliterated terminal bronchioles20 and may become ventilated via collateral pathways. The larger collaterally ventilated defects might be networks of lobules with interconnecting centrilobular spaces.
High-resolution 3He ventilation images, which were acquired as a single time-frame snapshot during the same scanning sessions (figures 2K, 3D,H and 4H) show no information about the collateral wash-in of gas. A whole breath-hold is needed for a single acquisition of the lung volume with high-resolution multislice imaging, meaning that there is no time-resolved aspect to the data and changes over time cannot be detected. The slice acquisition timing of a high-resolution ventilation dataset will change the appearance of defects with delayed ventilation. For example, if images of a slow-filling defect are obtained near the start of a breath-hold it will appear as a signal void (eg, figure 2K) but if images of the same defect are obtained later in the multislice acquisition, after gas has entered it, the ventilation defect will contain some signal (eg, figure 3H).
The case of collateral ventilation presented here appears to be intersegmental, which is consistent with previously reported collateral ventilation in COPD detected using xenon-enhanced dual-energy CT.21
By virtue of its low atomic mass 3He in air is more diffusive than xenon in air or pure air alone, so it is likely to show a faster and potentially amplified effect, allowing delayed/collateral ventilation to be visualised directly over the period of a single breath-hold (within 20 s). The use of this technique with hyperpolarised 129Xe MRI may also allow visualisation of delayed/collateral ventilation, although the lower diffusivity of 129Xe may slow the process to beyond a realistic single breath-hold time in patients.
The imaging sequence used is simple and available on all MRI systems equipped for hyperpolarised gas lung imaging. The sequence is readily adaptable, and from these initial data a breath-hold of 15 s with four evenly spaced data acquisition time-points should be sufficient to capture delayed-ventilation effects similar to those seen here, with the potential for an associated increased spatial resolution in the images.
In conclusion, a method is demonstrated for direct imaging of delayed ventilation within a single breath-hold, which can visualise what we believe to be collateral ventilation in COPD. The technique gives 3D full lung coverage, allowing global assessment of delayed and collateral ventilation pathways with regional sensitivity.
Acknowledgments
Steven Parnell and Peggy Xu for help with hyperpolarised gas dispensing. Thanks to Professor Jim Hogg at the University of British Columbia for useful comments on possible disease mechanisms of collateral ventilation in the review process.
References
Footnotes
Funding Funded by GlaxoSmithKline (RES111175) and UK EPSRC (EP/D070252/1). Polariser support from GE Healthcare.
Competing interests None.
Ethics approval South Yorkshire REC (REC reference: 10/H1310/11).
Provenance and peer review Not commissioned; externally peer reviewed.