Article Text

Abstract
Background The value of quantitative CT (QCT) to identify chronic obstructive pulmonary disease (COPD) phenotypes is increasingly appreciated. The authors hypothesised that QCT-defined emphysema and airway abnormalities relate to St George's Respiratory Questionnaire (SGRQ) and Body-Mass Index, Airflow Obstruction, Dyspnea and Exercise Capacity Index (BODE).
Methods 1200 COPDGene subjects meeting Global Initiative for Chronic Obstructive Lung Disease (GOLD) criteria for COPD with QCT analysis were included. Total lung emphysema was measured using the density mask technique with a −950 Hounsfield unit threshold. An automated programme measured mean wall thickness (WT), wall area percentage (WA%) and 10 mm lumenal perimeter (pi10) in six segmental bronchi. Separate multivariate analyses examined the relative influence of airway measures and emphysema on SGRQ and BODE.
Results In separate models predicting SGRQ score, a 1 unit SD increase in each airway measure predicted higher SGRQ scores (for WT, 1.90 points higher, p=0.002; for WA%, 1.52 points higher, p=0.02; for pi10, 2.83 points higher p<0.001). The comparable increase in SGRQ for a 1 unit SD increase in emphysema percentage in these models was relatively weaker, significant only in the pi10 model (for emphysema percentage, 1.45 points higher, p=0.01). In separate models predicting BODE, a 1 unit SD increase in each airway measure predicted higher BODE scores (for WT, 1.07-fold increase, p<0.001; for WA%, 1.20-fold increase, p<0.001; for pi10, 1.16-fold increase, p<0.001). In these models, emphysema more strongly influenced BODE (range 1.24–1.26-fold increase, p<0.001).
Conclusion Emphysema and airway disease both relate to clinically important parameters. The relative influence of airway disease is greater for SGRQ; the relative influence of emphysema is greater for BODE.
- Imaging
- COPD
- emphysema
- pleural disease
- COPD mechanisms
- COPD epidemiology
- allergic lung disease
- COPD exacerbations
- COPD pathology
- cytokine biology
- innate immunity
- lymphocyte biology
- macrophage biology
- respiratory infection
- tobacco and the lung
- imaging/CT MRI etc
- asthma epidemiology
- asthma genetics
- COPD pharmacology
- emphysema
- interstitial fibrosis
- long-term oxygen therapy (LTOT)
- lung physiology
- lung transplantation
- lung volume reduction surgery
- pulmonary rehabilitation
Statistics from Altmetric.com
- Imaging
- COPD
- emphysema
- pleural disease
- COPD mechanisms
- COPD epidemiology
- allergic lung disease
- COPD exacerbations
- COPD pathology
- cytokine biology
- innate immunity
- lymphocyte biology
- macrophage biology
- respiratory infection
- tobacco and the lung
- imaging/CT MRI etc
- asthma epidemiology
- asthma genetics
- COPD pharmacology
- emphysema
- interstitial fibrosis
- long-term oxygen therapy (LTOT)
- lung physiology
- lung transplantation
- lung volume reduction surgery
- pulmonary rehabilitation
Key messages
What is the key question?
Do measures of chronic obstructive pulmonary disease (COPD) severity as assessed by quantitative CT relate to clinically relevant outcomes?
What is the bottom line?
The relative influence of airway disease is greater for St George's Respiratory Questionnaire (SGRQ); the relative influence of emphysema is greater for BODE.
Why read on?
To learn about how quantitative CT can be used to identify unique clinical phenotypes in COPD.
Introduction
The importance of identifying distinct phenotypes within chronic obstructive pulmonary disease (COPD) is becoming increasingly appreciated, for the purpose of establishing prognosis and for identifying appropriate patients for therapies.1 Although multiple methods for describing the heterogeneity intrinsic to this disease have been developed, quantitative CT (QCT) may have significant value as a non-invasive means to identify distinct phenotypes in COPD. To establish the validity of COPD phenotyping based on QCT characteristics, correlations must be made in large groups of comprehensively assessed patients with COPD. We have previously reported that CT measures of emphysema and airways disease relate to COPD exacerbation frequency, a significant disease outcome for patients with COPD.2 The relationship between QCT phenotype and other important patient-centred outcomes is unknown. In this study, we describe a comprehensive evaluation of 1200 patients with COPD who underwent clinical, physiological and radiological evaluation with the goal of assessing the relationship between QCT-defined emphysema severity, airway abnormality and clinically relevant outcomes, including St George's Respiratory Questionnaire (SGRQ) and the BODE index.3 4
Methods
Patient selection
The COPDGene Study is a National Heart Lung Blood Institute funded multicentre investigation to examine the genetic epidemiology of smoking-related lung disease. Patients were selected for participation in the study based on the following criteria: age 45–80 years, non-smoker or cigarette smoking ≥10 pack years, and willingness to undergo study-related testing that included spirometry, CT scan of the chest, and blood collection for biomarker and genetic analysis. In our analysis patients were selected from the first 2500 dataset from the COPDGene study, April 2010, and included 1200 patients who met GOLD criteria5 for stages 1–4 fixed airflow obstruction with a post-bronchodilator forced expiratory volume in 1 s (FEV1)/forced vital capacity (FVC) ratio ≤0.7 and additionally had complete QCT-based emphysema and airway analyses available. Our analyses included all 1200 patients except for the BODE analyses, which included a smaller subset of 1179 patients who had complete data available to calculate the BODE index. All participants provided written informed consent. This research protocol was approved by the institutional review board at each participating institution.
Data collection and exacerbation determination
Demographical data, smoking and medical history were collected via interview or self-administered questionnaires. Dyspnoea was quantified using the modified Medical Research Council dyspnoea scale (MMRC),6 which is a five-point scale that asks respondents to rate dyspnoea from 0 (absent) to 4 (dyspnoea when dressing/undressing). The SGRQ is a health-related quality of life (HRQL), obstructive lung disease-specific instrument with three domains (symptoms, activities and impact), all scored from 0 to 100. Higher scores correspond to worse HRQL.3 All patients underwent the standard 6-min walk distance (6MWD) test. The BODE index was calculated using 6MWD, FEV1 % predicted, MMRC and body mass index (BMI), as previously described.7
Physiological testing
Patients underwent spirometry before and after the administration of short acting bronchodilating medication (albuterol). All spirometric tracings were independently reviewed to ensure that ATS criteria were met.8
Imaging
Objective analysis of the lung parenchyma and airways was performed on volumetric CT scans of the chest obtained at full inflation. All CT scans were obtained under a standardised protocol.2 Parenchymal analysis and airway analyses were performed using VIDA Pulmonary Workstation 2 (http://www.vidadiagnostics.com). Lung area with a CT attenuation value of less than −950 Hounsfield Units (HU) on the inspiratory scan was considered to be emphysematous tissue. Reconstruction of CT inspiratory images allowed for estimation of total lung capacity (TLC). TLC % predicted was calculated based on a previously published equation.9 Airway morphology was examined in six segmental airways: apical segment, right upper lobe (RB1), lateral segment, right middle lobe (RB4), posterior basal segment, right lower lobe (RB10), apicoposterior segment, left upper lobe (LB1), superior lingular segment (LB4), and posterior basal segment, left lower lobe (LB10).10 CT-based metrics of airway disease included mean bronchial wall thickness calculated as an average of the six segmental values for each patient, wall area percentage (WA%) (100*WA/total bronchial area)11 obtained at the same sites as those used for bronchial wall thickness, and the square root of the wall area of a theoretical airway of 10 mm lumenal perimeter (Pi10), as previously described.12 13
Statistical analyses
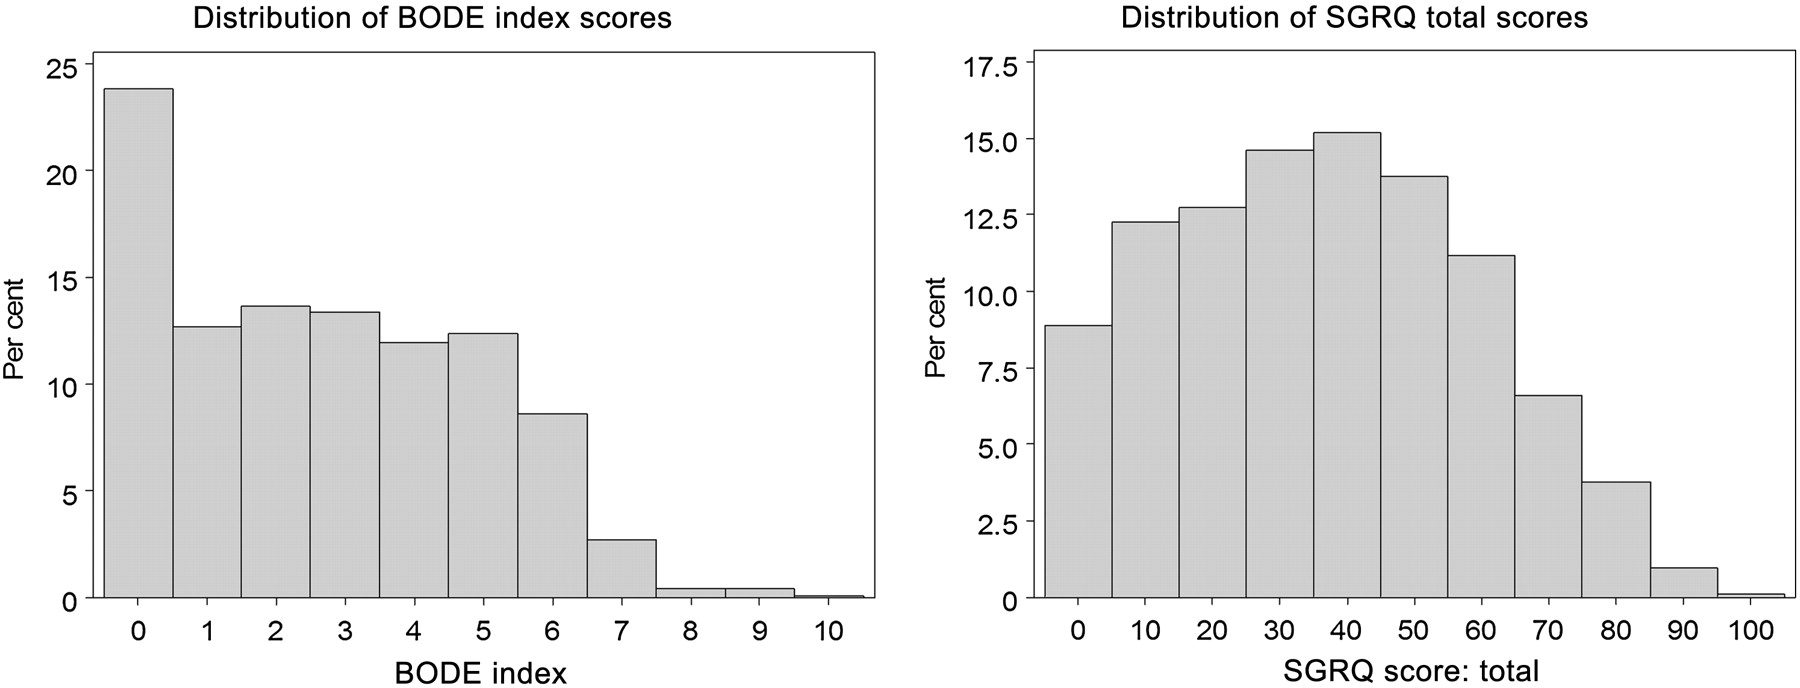
All statistical analyses were conducted with the SAS statistical analysis package (V.9.2; SAS Institute Inc). For univariate and multivariate analyses, data are presented for ‘normalised’ and ‘unnormalised’ radiological parameters. For ‘normalised’ radiological parameters, airway disease measures and emphysema values have been scaled and centred as follows: (value – mean)/SD. Hence a 1 unit increase in a normalised measure is 1 SD. For SGRQ total score, multivariate linear regression models were used, adjusted for age, gender, current smoking status, height, FEV1 % predicted and scanner type. For BODE, zero-inflated Poisson regression was used, adjusted for age, gender, smoking status and scanner type. This model is more appropriate as the BODE distribution of values in this cohort was skewed, with more patients displaying lower BODE scores (see figure 1). p Values <0.05 were considered to be statistically significant. The three-dimensional, smoothed surface plots of the raw data (figure 2A,C) were created with SAS V.9.2 statistical software, using PROC G3GRID, which uses spline interpolation as the smoothing algorithm. The density plots of the raw data (figure 2B,D) were also created with SAS V.9.2 statistical software, using PROC KDE, which utilises a non-parametric technique for density estimation.

Frequency distribution of BODE index scores (left panel) and St George's Respiratory Questionnaire (SGRQ) total scores (right panel).

(A) Three-dimensional plot demonstrating the relationship between increasing 10 mm lumenal perimeter (pi10), emphysema percentage and St George's Respiratory Questionnaire (SGRQ) score. (B) Density plot of patients with chronic obstructive pulmonary disease (COPD) with SGRQ score approximately in the 90th percentile (score ≥64, n=146) demonstrating degree of pi10 and emphysema in this subgroup. High density in red, low density in blue. (C) Three-dimensional plot demonstrating the relationship between increasing pi10, emphysema percentage and BODE index score. (D) Density plot of patients with COPD with BODE score approximately in the 90th percentile (score ≥6, n=142) demonstrating the degree of pi10 and emphysema in this subgroup. High density in red, low density in blue.
Results
Data from 1200 patients were available for analysis. Their demographical and physiological data are outlined in table 1. This dataset is roughly split between men and women. The majority were ex-smokers (63.2%) with moderate COPD by spirometric criteria, median FEV1 % predicted 56%. A broad range of disease severity as defined by BODE and SGRQ were also present (see figure 1).
Baseline demographical and physiological data
In univariate models, airway measures and emphysema demonstrated statistically significant associations with BODE and SGRQ (see table 2), except segmental wall thickness which did not show a statistically significant relationship with BODE. Because the units for each of these radiological predictors differs widely with respect to the range of values seen in the population, a better interpretation of the relative importance of each can be seen with the normalised parameter estimates, which are also displayed in table 2. For normalised estimates, a 1 unit change corresponds to 1 SD change for that variable. When examining the normalised estimates, the strongest signal for SGRQ is seen for pi10. The strongest signal for BODE is seen with emphysema percentage.
Univariate associations between unnormalised and normalised radiological parameters, St George's Respiratory Questionnaire (SGRQ) total score and BODE
To visualise the relationships between pi10 and emphysema with respect to SGRQ, a three-dimensional plot was created (figure 2A), which demonstrates that regardless of emphysema extent, increasing pi10 is associated with increasing SGRQ score. Similarly, increasing emphysema is also associated with increasing SGRQ score regardless of pi10. To understand these relationships further, we selected patients in approximately the highest 10th percentile of SGRQ scores and created density plots depicting the relationship between emphysema and airway measures (figure 2B). Although a wide range of pi10 and emphysema values are still represented, for the highest density of patients depicted in red, normalised pi10 values were higher than the average pi10 (3.78) whereas emphysema values were lower than the group average for emphysema (13.9%).
By contrast, a similar three-dimensional plot for BODE (figure 2C), showing the independent relationship between pi10, emphysema and BODE revealed that even at extreme values of pi10 in the absence of emphysema, increases in BODE are modest. A density plot for patients with approximately the 10th highest percentile BODE scores is depicted in figure 2D. While a wide range of pi10 and emphysema values are present, the highest density of patients in red have a much greater amount of emphysema than either the group mean (13.9%) or patients with SGRQ scores in figure 2B, whereas pi10 values are similar to the group mean (3.78) but lower than patients with high SGRQ scores in figure 2B. Additional density plots by airway measure for the entire cohort are presented in online supplemental figures S1–S3.
Further analysis of the relationships between airway disease measures, emphysema, SGRQ and BODE was carried out via individual multivariate models including each airway disease measure separately to compare their relative effect on emphysema, adjusting for other relevant confounders. The results of analyses predicting SGRQ are presented in tables 3 and 4. In table 4, radiological predictors are normalised so that the relative importance of airway measures in emphysema can be compared.
Multivariate analysis predicting St George's Respiratory Questionnaire (SGRQ) total score using unnormalised radiological parameters* (n=1200)
Multivariate analysis of St George's Respiratory Questionnaire (SGRQ) total score using normalised radiological parameters* (n=1200)
Table 3 shows that each airway parameter significantly predicts increasing SGRQ score, with emphysema percentage also being accounted for. A 1 mm increase in segmental wall thickness results in an 8.49-point increase in SGRQ score (95% CI 3.19 to 13.79; p=0.002); a 1% increase in WA% results in a 0.47-point increase in SGRQ (95% CI 0.08 to 0.85; p=0.02); a 1 unit increase in pi10 results in a 22.13-point increase in SGRQ (95% CI 12.99 to 31.29; p<0.001). Only in the model utilising pi10 is emphysema statistically significant, and a positive association between increasing emphysema and greater SGRQ score can be seen. Table 4 further emphasises the relative importance of airway parameters to emphysema in predicting SGRQ as the normalised airway estimates are all significantly larger than the emphysema estimates. A 1 unit SD increase in segmental wall thickness results in a 1.90-point increase in SGRQ score (95% CI 0.72 to 3.09; p=0.002); a 1 unit SD increase in WA% results in a 1.52-point increase in SGRQ (95% CI 0.27 to 2.76; p=0.02); a 1 SD unit increase in pi10 results in a 2.83-point increase in SGRQ (95% CI 1.66 to 4.00; p<0.001). In the model using pi10, a 1 unit SD increase in emphysema results in a 1.45-point increase in SGRQ (95% CI 0.33 to 2.57; p=0.02). As all parameters in table 4 are for a SD change for that predictor, the scale of change for each predictor in all models is comparable. To ensure differences in full inspiratory capacity did not bias results, TLC % predicted calculated from the CT was also added to tables 3 and 4 models but did not demonstrate any significant change in results (data not shown).
Additional multivariate models for SGRQ subscores using normalised pi10 and emphysema measures are presented in online supplemental table 1. This analysis demonstrates that the strongest relationship for radiological parameters exists with the activity subscore. A 1 unit SD increase for pi10 results in a 3.38-point increase in SGRQ activity subscore (95% CI 1.91 to 4.84; p<0.001), and a 1 unit SD increase in emphysema results in a 3.06-point increase in activity subscore (95% CI 1.54 to 4.60; p<0.001.
Multivariate analyses for predicting BODE index are reported in tables 5 and 6, for unnormalised and normalised radiological parameters respectively. In table 5, each of the three airway parameters predict increasing BODE index when additionally adjusted for emphysema. A 1 mm increase in segmental wall thickness results in a 1.36-fold increase in BODE index score (95% CI 1.14 to 1.62; p<0.001); a 1% increase in WA% results in a 1.06-fold increase in BODE index score (95% CI 1.05 to 1.07; p<0.001); a 1 unit increase in pi10 results in a 3.30-fold increase in BODE index score (95% CI 2.48 to 4.40; p<0.001). In all three models, an increase in emphysema is also associated with approximately a 1.02-fold increase in BODE index score (p<0.001 for all models). Once again, all parameters in table 6 are for a SD change in that predictor so that the scale of change for each predictor in all models is comparable. Here we see that, in contrast to the model for SGRQ, the emphysema parameter is larger than the airway parameters for every model and is statistically significant.
Multivariate analysis predicting BODE index score using unnormalised radiological parameters* (n=1179)
Multivariate analysis of BODE index score using normalised radiological parameters* (n=1179)
The fold increase in BODE score for a 1 SD increase in emphysema ranges between 1.24 and 1.26 (p<0.001) in all three models, exceeding the upper bound of the 95% CI for the fold changes seen in airway parameters. The relative weight for the three airway parameters is less, yet still independently predictive when adjusted for emphysema. A 1 unit SD increase in segmental wall thickness results in a 1.07-fold increase in BODE index score (p<0.001), a 1 unit SD increase in segmental WA% results in a 1.20-fold increase in BODE index score (p<0.001); a 1 unit SD increase in pi10 results in a 1.16-fold increase in BODE index score (p<0.001). To correct for differences in inspiratory capacity during the imaging maneuver, tables 5 and 6 models were additionally adjusted for TLC % predicted that was calculated from reconstruction of inspiratory CT images. This did not result in a significant change in results (data not shown).
To better understand the relationship between radiological parameters and BODE components, Spearman's correlations were performed between radiological parameters and BODE components. These results are displayed in online supplemental table 2. Emphysema correlates most strongly with FEV1% predicted (r=−0.54, p<0.001). Pi10 correlates most strongly with FEV1% predicted, r=−0.37, p<0.001. Online supplemental table 3 displays additional analyses subdividing the cohort based on presence (≥75th percentile) or absence (≤25th percentile) of emphysema and airways disease (using pi10 as a representative airway metric). These analyses further highlight the relationship between increasing emphysema and BODE, and increasing airway disease and SGRQ.
Discussion
The results of this study establish a relationship between QCT metrics and two indices of disease impact, a specific measure of respiratory health status (SGRQ) and a multidimensional index of COPD severity, BODE, that has been correlated with mortality. In multivariate models, increases in both QCT measures of airway disease and emphysema were associated with higher SGRQ and BODE scores. However, in models that were centred and scaled so that the relative weight of airway disease measures and of emphysema measures could be compared, a 1 unit SD increase in airway disease measures had a greater relative effect on increasing SGRQ total score than a 1 unit SD increase in emphysema. In contrast, a similar analysis performed on the BODE index indicated a greater relative increase in BODE index scores for a 1 unit SD increase in emphysema as opposed to airway measures. The colour-coded density plots of patients with high SGRQ and BODE scores also emphasise that an airway disease predominant phenotype is associated with more impaired higher SGRQ whereas an emphysema predominant phenotype is associated with higher BODE index scores.
This analysis extends the findings of other studies on the association between QCT measures of airway disease and symptoms in COPD. In a prior report of the COPDGene cohort, segmental airway wall thickening but not emphysema was associated with the presence of cough and sputum.14 Grydeland, et al reported that in COPD, both pi10 and emphysema were related to dyspnoea, but only pi10 was associated with cough and wheeze.15 Here we broaden these findings by examining the relationships between QCT measures and SGRQ. While cough, phlegm production and shortness of breath are all important items assessed by the SGRQ, the SGRQ is an important independent measure of HRQL in COPD.3 In this study, we help to demonstrate a significant relationship between increasing airways disease and emphysema with SGRQ, but also through normalising the QCT parameters, demonstrate that the relative influence of airway disease on SGRQ is significantly stronger than that of emphysema.
While univariate analysis suggests a relationship between disease severity as quantified by emphysema and SGRQ score does exist, the multivariate analyses data suggest that airway disease plays the relatively stronger role. In our multivariate analysis, a 0.20-point increase in pi10 would correlate with a four-point increase in SGRQ, the generally accepted minimal important difference for SGRQ.16 The relationship between pi10 and the activity subscore of the SGRQ appears to be the strongest. A ready explanation for this is not obvious, although it may be that patients who have more significant airway disease represent a unique subgroup of patients who, due to pulmonary physiology or comorbid conditions, experience greater decrements in functional status. The current results differ from our prior analysis of 156 patients with COPD, which demonstrated a relationship between increasing emphysema and SGRQ score but not right upper lobe WA%.17 However, that cohort was very small and composed of a unique study population who were being evaluated for lung surgery (tumour resection, lung volume reduction surgery or lung transplantation). This current analysis is significantly larger and includes a more representative sample of the general COPD population.
While we and others have documented a relationship between QCT emphysema measures and BODE score,17 18 in this analysis we demonstrated a relationship between airway disease measures and BODE score and between emphysema and BODE score. However, we are also able to examine the relative relationship between airway disease, emphysema and BODE. The relationship between emphysema and BODE is stronger than the relationship between airway disease and BODE. This is suggested by the relative weight of the normalised parameter estimates in the multivariate models (table 6) and the density plot (figure 2D), in which it is evident that patients with high BODE scores have a much greater burden of emphysema than airway disease. To put this in perspective, our multivariate analysis suggests that a 10% increase in emphysema would correlate with a 1.23-fold increase in BODE score. While an Minimal Important Difference (MID) for BODE is difficult to define with certainty, a 1.19-fold increase in BODE has been reported with pulmonary rehabilitation, which was also associated with improved survival.19
The relationship between emphysema and BODE appears to be driven most strongly by its relationship with FEV1, but not surprisingly significant relationships between emphysema and the other BODE components including BMI, MMRC and 6MWD are also seen. Weight loss20 and hyperinflation21 are known associations with emphysema that likely contribute to these relationships.
Previously we reported no significant relationship between airway disease as measured by right upper lobe WA% and BODE. However, this prior analysis was performed on a small, highly selected COPD cohort compared with the significantly larger cohort described here and also used a very localised measure of airway disease (right upper lobe) as opposed to the measures used here that are averaged from six separate bronchial segments throughout the lung.
This analysis also demonstrates that three of the QCT airway measures currently in use do not behave identically in multivariate modelling. Currently no gold standard airway disease measure has been identified and hence all three are included here. As derivation of the airway measures differs significantly, it is reasonable to expect that they each may contribute different information. For instance, because WA% reflects wall thickness relative to airway size, that measure will not be changed if both elements increase. WA% and pi10 also have a stronger relationship with FEV1 than wall thickness. Determining the airway measure that best characterises patients with COPD is certainly an issue that deserves further attention so that we can better understand which aspects of airway dimensions relate to characteristics intrinsic to normal development as opposed to disease.
These data also raise several questions about the interplay between QCT phenotypes and clinical descriptors of disease. The SGRQ was developed and has been tested in large numbers of patients and can safely be assumed to be a valid indicator of quality of life in patients with COPD with a wide variety of phenotypes. However, our data suggest that the relationship between SGRQ and pathological abnormality is complex as SGRQ appears to be more influenced by changes in airway disease than emphysema. Hence therapies targeted at different aspects of the disease may result in different relative changes in SGRQ, which should be considered when planning clinical trials and determining appropriate outcome measures. Hypothetically speaking, a therapy targeted at slowing emphysema, for instance, may not be expected to have the same influence on SGRQ as therapies targeted at airways disease. While improving quality of life for patients with COPD is an important goal in itself, these data underscore the complexity of inferring a relationship between SGRQ and disease pathology in patient populations that are not well phenotyped.
An additional question raised is whether the relationship between BODE and mortality is driven by the presence of emphysema. Would emphysema itself be a better predictor of mortality? Emphysema is associated with systemic inflammation, and interestingly, lung volume reduction surgery in patients with upper lobe predominant emphysema results in improved survival and a decrease in inflammatory mediators, including tumour necrosis factor α and interleukin-8, as well as an increase in α1-antitrypsin and BMI.22 23 Another question raised by this analysis is whether the BODE index is the best predictor of mortality among patients with an airway predominant disease phenotype. Although longitudinal data will be required to answer these questions definitively, previously published data underscore the potential importance of CT characterisation to identify subsets of COPD for specific therapies. Emphysema distribution helps to identify suitable patients for lung volume reduction therapy.23 We have also previously demonstrated that QCT can be used to identify airway disease predominant and emphysema predominant patient populations with increased risk for exacerbations.2
A limitation to our analysis is that while emphysema and airway disease measures were adjusted for scanner model, these CT data were not corrected for variation within any particular scanner model due to tube calibration or other factors. This is a difficulty associated with performing QCT studies across multiple sites and scanners. The methodology to do this is currently being developed through the use of CT phantoms to standardise images, but the algorithms to perform such corrections are still being researched. Such corrections become even more important when performing longitudinal studies in which both intrascanner and interscanner variations may risk obscuring signal detection.
In summary, our analyses demonstrate that radiological indices of airway disease and emphysema influence BODE and SGRQ. Airway disease, however, appears to be more closely associated with higher SGRQ scores and emphysema appears to be more closely associated with BODE. These analyses all demonstrate the ability of QCT measures to relate to clinically relevant outcomes and add to our ability to understand the heterogeneity implicit to COPD. Future prospective studies will allow us to better understand the predictive value of radiological indices compared with composite indices such as SGRQ and BODE.
Appendix 1 Members of the COPDGene study group as of June 2010
Ann Arbor VA: Jeffrey Curtis, MD (PI), Ella Kazerooni, MD (RAD). Baylor College of Medicine, Houston, Texas: Nicola Hanania, MD, MS (PI), Philip Alapat, MD, Venkata Bandi, MD, Kalpalatha Guntupalli, MD, Elizabeth Guy, MD, Antara Mallampalli, MD, Charles Trinh, MD (RAD), Mustafa Atik, MD. Brigham and Women's Hospital, Boston, Massachusetts: Dawn DeMeo, MD, MPH (Co-PI), Craig Hersh, MD, MPH (Co-PI), George Washko, MD, Francine Jacobson, MD, MPH (RAD). Columbia University, New York: R. Graham Barr, MD, DrPH (PI), Byron Thomashow, MD, John Austin, MD (RAD). Duke University Medical Center, Durham, North Carolina: Neil MacIntyre, Jr, MD (PI), Lacey Washington, MD (RAD), H Page McAdams, MD (RAD). Fallon Clinic, Worcester, Massachusetts: Richard Rosiello, MD (PI), Timothy Bresnahan, MD (RAD). Health Partners Research Foundation, Minneapolis, Minnesota: Charlene McEvoy, MD, MPH (PI), Joseph Tashjian, MD (RAD). Johns Hopkins University, Baltimore, Maryland: Robert Wise, MD (PI), Nadia Hansel, MD, MPH, Robert Brown, MD (RAD), Gregory Diette, MD. Los Angeles Biomedical Research Institute at Harbor UCLA Medical Center, Los Angeles, California: Richard Casaburi, MD (PI), Janos Porszasz, MD, PhD, Hans Fischer, MD, PhD (RAD), Matt Budoff, MD. Michael E. DeBakey VAMC, Houston, Texas: Amir Sharafkhaneh, MD (PI), Charles Trinh, MD (RAD), Hirani Kamal, MD, Roham Darvishi, MD. Minneapolis VA: Dennis Niewoehner, MD (PI), Tadashi Allen, MD (RAD), Quentin Anderson, MD (RAD), Kathryn Rice, MD. Morehouse School of Medicine, Atlanta, Georgia: Marilyn Foreman, MD, MS (PI), Gloria Westney, MD, MS, Eugene Berkowitz, MD, PhD (RAD). National Jewish Health, Denver, Colorado: Russell Bowler, MD, PhD (PI), Adam Friedlander, MD, David Lynch, MB (RAD), Joyce Schroeder, MD (RAD), John Newell, Jr., MD (RAD). Temple University, Philadelphia, Pennsylvania: Gerard Criner, MD (PI), Victor Kim, MD, Nathaniel Marchetti, DO, Aditi Satti, MD, A. James Mamary, MD, Robert Steiner, MD (RAD), Chandra Dass, MD (RAD). University of Alabama, Birmingham, AL: William Bailey, MD (PI), Mark Dransfield, MD (Co-PI), Hrudaya Nath, MD (RAD). University of California, San Diego, California: Joe Ramsdell, MD (PI), Paul Friedman, MD (RAD). University of Iowa, Iowa City, Iowa: Geoffrey McLennan, MD, PhD (PI), Edwin JR van Beek, MD, PhD (RAD), Brad Thompson, MD (RAD), Dwight Look, MD. University of Michigan, Ann Arbor, Michigan: Fernando Martinez, MD (PI), MeiLan Han, MD, Ella Kazerooni, MD (RAD). University of Minnesota, Minneapolis, Minnesota: Christine Wendt, MD (PI), Tadashi Allen, MD (RAD). University of Pittsburgh, Pittsburgh, Pennsylvania: Frank Sciurba, MD (PI), Joel Weissfeld, MD, MPH, Carl Fuhrman, MD (RAD), Jessica Bon, MD. University of Texas Health Science Center at San Antonio, San Antonio, Texas: Antonio Anzueto, MD (PI), Sandra Adams, MD, Carlos Orozco, MD, Mario Ruiz, MD (RAD). Administrative Core: James Crapo, MD (PI), Edwin Silverman, MD, PhD (PI), Barry Make, MD, Elizabeth Regan, MD, Sarah Moyle, MS, Douglas Stinson. Genetic Analysis Core: Terri Beaty, PhD, Barbara Klanderman, PhD, Nan Laird, PhD, Christoph Lange, PhD, Michael Cho, MD, Stephanie Santorico, PhD, John Hokanson, MPH, PhD, Dawn DeMeo, MD, MPH, Nadia Hansel, MD, MPH, Craig Hersh, MD, MPH, Jacqueline Hetmanski, MS, Tanda Murray. Imaging Core: David Lynch, MB, Joyce Schroeder, MD, John Newell, Jr., MD, John Reilly, MD, Harvey Coxson, PhD, Philip Judy, PhD, Eric Hoffman, PhD, George Washko, MD, Raul San Jose Estepar, PhD, James Ross, MSc, Rebecca Leek, Jordan Zach, Alex Kluiber, Jered Sieren, Heather Baumhauer, Verity McArthur, Dzimitry Kazlouski, Andrew Allen, Tanya Mann, Anastasia Rodionova. PFT QA Core, LDS Hospital, Salt Lake City, Utah: Robert Jensen, PhD. Biological Repository, Johns Hopkins University, Baltimore, Maryland: Homayoon Farzadegan, PhD, Stacey Meyerer, Shivam Chandan, Samantha Bragan. Data Coordinating Center and Biostatistics, National Jewish Health, Denver, Colorado: James Murphy, PhD, Douglas Everett, PhD, Carla Wilson, MS, Ruthie Knowles, Amber Powell, Joe Piccoli, Maura Robinson, Margaret Forbes, Martina Wamboldt. Epidemiology Core, University of Colorado School of Public Health, Denver, Colorado: John Hokanson, MPH, PhD, Marci Sontag, PhD, Jennifer Black-Shinn, MPH, Gregory Kinney, MPH.
References
Footnotes
Link to study protocol: http://www.copdgene.org/sites/default/files/COPDGeneProtocol-5-0_06-19-2009.pdf
↵* COPDGene Investigators are listed in appendix 1.
Funding COPDGene is supported by NHLBI Grant Nos U01HL089897 and U01Hl089856. Dr Han is supported by funding from NHLBI Grant No. K23 HL093351. Dr Washko is supported by funding from NHLBI Grant No. K23 HL089353 and an award from the Parker B. Francis Foundation. The COPDGene project is also supported by the COPD Foundation through contributions made to an Industry Advisory Board comprised of AstraZeneca, Boehringer Ingelheim, Novartis and Sepracor.
Competing interests None.
Ethics approval Ethics approval was provided by National Jewish IRB Protocol No. HS-1883a.
Provenance and peer review Not commissioned; externally peer reviewed.