Article Text

Abstract
The protein and molecular characteristics of variants of the α1-antitrypsin (AAT) gene are described, and available data on the genetic epidemiology of AAT deficiency are presented.
- α1-antitrypsin deficiency
- genotype
- isoelectric focusing
- population screening
Statistics from Altmetric.com
In the last 40 years, following the publication of the seminal paper by Laurell and Eriksson,1 there have been significant advances in the understanding of genetic abnormalities related to α1-antitrypsin (AAT) deficiency and of the pathophysiology of the associated lung and liver diseases. During the same period, data from a number of genetic epidemiology surveys have been accumulated. As a result, we now have a fairly comprehensive picture of the distribution of AAT deficiency, especially in developed countries, and some soundly based hypotheses about AAT gene evolution, the origin of AAT deficiency, and its spread. This paper reviews the available data on the genetic epidemiology of AAT deficiency. A preliminary discussion on the protein and molecular characteristics of AAT variants provide a background to facilitate a better understanding of the nomenclature and epidemiology data discussed.
THE AAT PROTEIN
α1-antitrypsin (AAT or α1-AT, also referred to as α1-proteinase (or protease) inhibitor (α1-PI)) is a 52 kD glycoprotein mostly secreted by hepatocytes and, to a lesser extent, by lung epithelial cells and phagocytes. It inhibits a variety of serine proteinases but its preferred target is human neutrophil elastase (HNE), for which it demonstrates the highest association rate constant.2 The major function of AAT in the lungs is to protect the connective tissue from HNE released from triggered neutrophils, as supported by the development of pulmonary emphysema early in life in subjects affected by severe inherited deficiency of AAT.3 In the majority of humans the lungs are defended from HNE attack by normal AAT plasma levels ranging from 100 to 200 mg/dl (as measured by nephelometry). Although AAT is a well known acute phase reactant, this wide variability in its normal plasma levels mostly reflects the marked pleomorphism of the glycoprotein. More than 100 genetic variants of AAT have been identified and these are strictly associated with specific AAT plasma levels in a co-dominantly inherited fashion4,5—in other words, plasma AAT levels are determined by both AAT gene alleles independently of each other.
The nomenclature currently used to identify the AAT variants is a sort of compromise resulting from the evolution of the different techniques applied to separate and characterise the proteins over the last 40 years. The AAT variants included in an allelic system called the Pi (protease inhibitor) system were initially named on the basis of their migration velocity in starch-gel electrophoresis as M (medium), S (slow), F (fast), or Z (very slow).6 Subsequently, when proteins began to be separated on the basis of their isoelectric point (pH 4–5 isoelectric focusing (IEF) on thin layer polyacrylamide gel), to cope with the previous nomenclature system the AAT variants were classified with the first letters of the alphabet if displaying anodal migration and with the last letters if displaying cathodal migration. At the advent of the genomic era the former Pi system was renamed PI* to identify the AAT gene locus.5
After the original paper by Laurell and Eriksson1 and the subsequent evidence that most subjects with inherited severe deficiency of AAT were predisposed to an early onset of emphysema,7 it became useful for clinical purposes to classify AAT variants into three major categories:4
-
Normal, characterised by AAT plasma levels within general population reference ranges, not associated with a risk of lung or liver disease. This category includes the four most common middle migrating M variants (M1→M4) and a number of less common variants identified on the basis of the alphabet letter, as indicated above, and the city of the oldest living carrier of the variant8—for example, Lfrankfurt.
-
Deficient, characterised by reduced but detectable AAT plasma levels, associated with an increased risk of developing lung or liver disease. This category includes the most frequent deficient variants, Z and S, and a number of less frequent variants including the so called M-like variants (Mmalton, Mprocida, etc), with a middle migrating pattern. The upper limit of the plasma AAT level to include an AAT variant in this category is 80 mg/dl—that is, that displayed by most subjects with the PI*SZ genotype.
-
Null (currently designated QO), with no detectable plasma AAT level, associated with an increased risk of developing emphysema.
THE AAT GENE AND ITS EVOLUTION
Knowledge of the molecular structure of the AAT gene began to emerge roughly two decades after the report of the serum protein deficiency.9 The AAT gene is part of a gene cluster, located on human chromosome 14q32.1, called the SERPIN (SERine Proteinase INhibitor) supergene. This gene cluster includes the corticosteroid binding globulin (CBG), AAT-like pseudogene (PIL), AAT, protein C inhibitor (PCI), and α1-antichymotrypsin (AACT) genes (centromere to telomere). The AAT gene spans 12.2 kb in length and has three non-coding (IA, IB, IC) and four coding (II, III, IV, V) exons; exon V contains the sequence coding for the reactive site of the AAT protein (Met358–Ser359). There is a close genetic linkage between the AAT and AACT genes, and it is likely that the two loci differentiated relatively recently (100–250 million years ago).10 Only a few nucleotide differences have been detected between AAT in higher primates (baboons, gorillas, and chimpanzees) and the human AAT ancestral variant, all displaying the Arg101-Ala213-Glu376 combination.11 Based on substitutions of these three major amino acids as haplotype markers, it has been possible to draw a likely phylogenetic tree of the major normal AAT variants and of the most frequently detected deficient variants (fig 1).
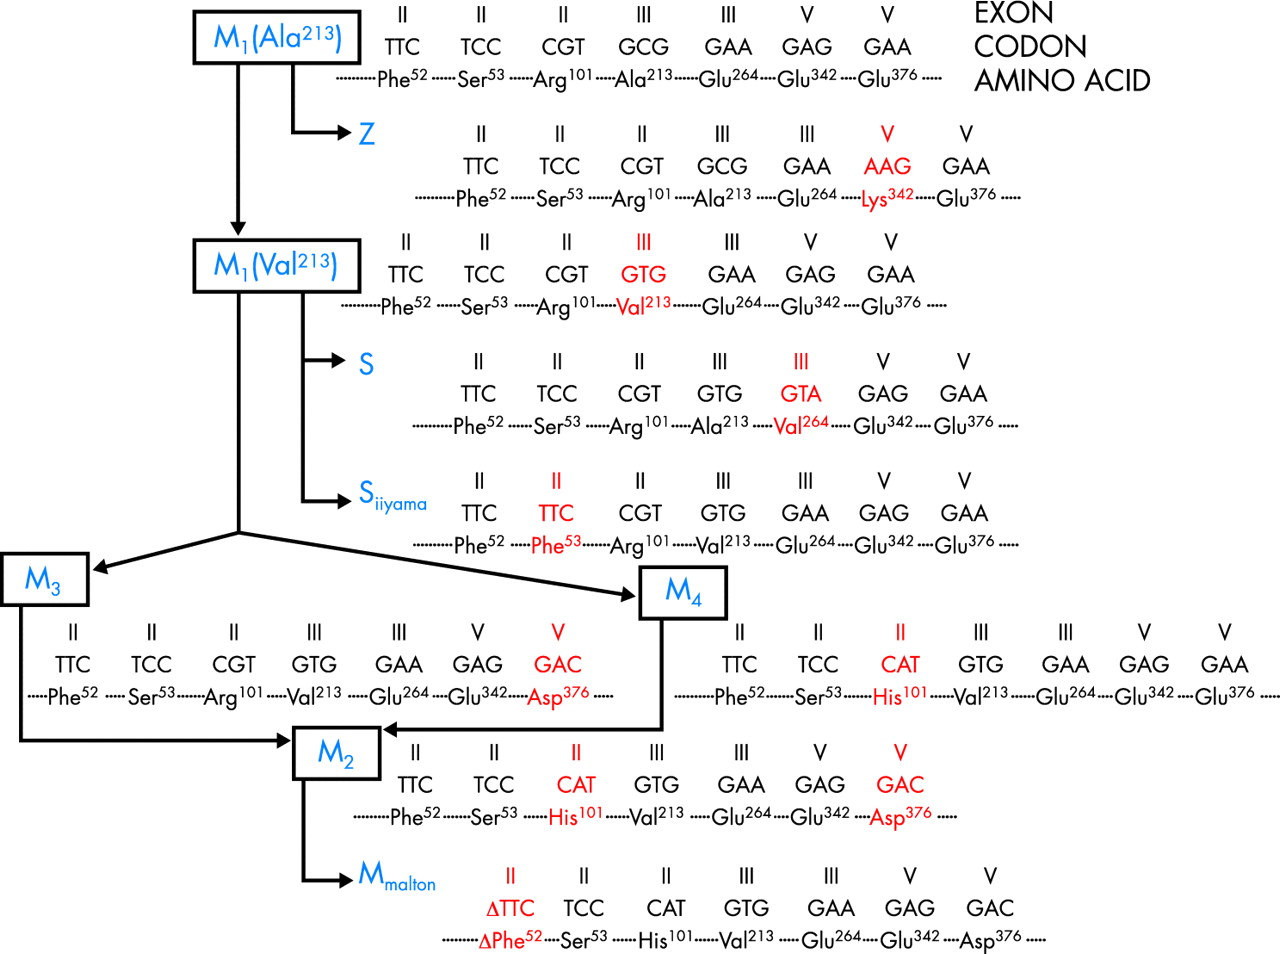
Phylogenetic tree of the AAT gene. Modified from Nukiwa et al.11
STUDIES ON THE DISTRIBUTION OF AAT DEFICIENCY
Although, as discussed below, a huge number of cohorts have been investigated, there have been only a few population based studies on AAT allele frequencies, mostly based on blood donor screening. Two seminal papers have recently reviewed the available data on the geographical distribution of AAT deficiency.12,13 Given the widespread acceptance that the disorder arose in European populations, it was logical for Hutchison to address his paper on the distribution of AAT deficiency in Europe.12 However, in the light of growing awareness of genetic conditions, de Serres13 recently enlarged the previous analysis to a summary of worldwide surveys, also looking at racial/ethnic differences in the prevalence of AAT deficiency. Both reviews drew on published genetic epidemiology surveys and a huge number of studies (373 control cohorts in de Serres’ paper13) so that, for the first time, we have a global—if not yet comprehensive—view of AAT deficiency. Of course, both reviews have the limitations inherent in meta-analyses of studies that differ in several aspects.12
Selection of cohorts
The surveys include a wide variety of subjects: blood donors, neonates, pregnant women, various groups of workers, students, and subjects submitted to parentage tests, laboratory or hospital staff, or “randomly” selected individuals. In many instances no details about selection criteria are available.
Sample size
The survey sample sizes vary from a few dozen to several thousands of subjects, with a high percentage of surveys including 100–500 subjects. Gene frequency estimates from cohorts of fewer than 200 individuals have a high risk of error.
Methods of ascertainment of AAT variants
In most of the studies the AAT variants were determined by IEF (also referred to as “phenotyping”), although crossed immunoelectrophoresis was used in many of the older surveys published before the 1980s. The two methods are not completely interchangeable.5 To date, no genetic epidemiology surveys on AAT deficiency using molecular methods (“genotyping”) have been reported. Given these differences, some degree of bias may have been introduced into the global analysis of the surveys.
Analysis of the genetic epidemiology surveys
The prevalence of the three major AAT variants (PI*M, PI*Z, and PI*S) is reported in most surveys as gene frequencies—that is, the frequency of a variant in homozygotes (where the variant contributes two alleles) or in heterozygotes (where the variant contributes one allele), and quoted as 0.0 ... n (or n per 1000 individuals). A step beyond is to use gene frequencies with the Hardy-Weinberg equilibrium formula to estimate the total number of carriers (PI*MS and PI*MZ) and subjects with deficiency variant combinations (PI*SS, PI*SZ, and PI*ZZ). This approach was used by de Serres13 to estimate the population at risk (carriers + subjects with deficiency variants) in a given country or geographical region, taking into account the overall population.
GENETIC EPIDEMIOLOGY OF AAT DEFICIENCY
Europe
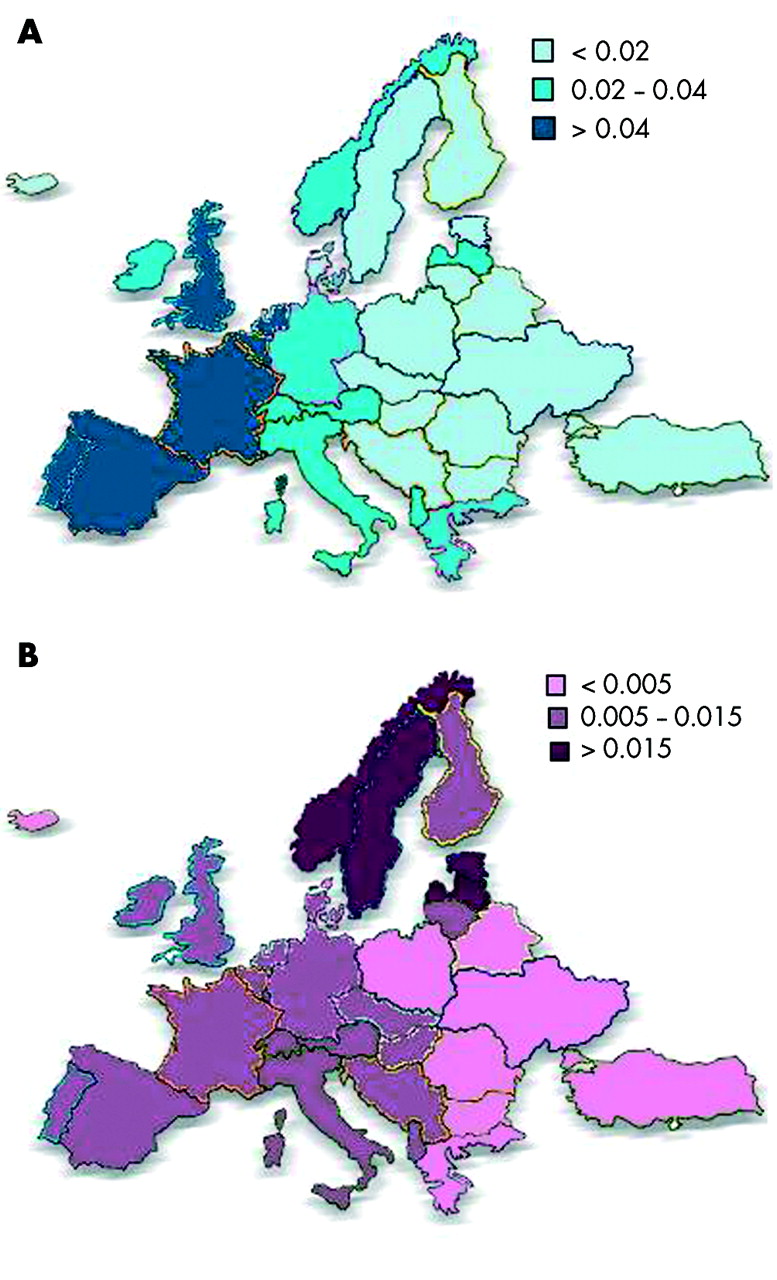
The highest prevalence of the PI*Z variant was recorded in northern and western European countries (mean gene frequency 0.0140),13 peaking in southern Scandinavia, Denmark, the Netherlands, the UK, and northern France (gene frequency >0.0200).14–20 The results of mass screening of the whole population of neonates in Sweden performed over a 2 year period were published in 1976.21 Of the 200 000 infants screened, 129 had the PI*Z variant, yielding a frequency of 1 in 1550 individuals and a gene frequency of 0.026. Sveger also screened 11 000 healthy 18 year old men and found five PI*Z and 10 PI*SZ individuals.22 The most recently published study on the subject is that from the Copenhagen City Heart Study in which 9187 randomly selected subjects were investigated.23 The prevalence found in this study (1 in 1500 individuals) is the same as that in the Swedish study,21 but the PI*Z gene frequency was found to be 0.049. The prevalence of PI*Z gradually decreases throughout European countries in a north-west → south-east direction, the lowest figures being recorded in eastern Europe.12
The distribution of PI*S differs markedly from that of PI*Z and is more homogeneous.24 The highest frequency of PI*S is in southern Europe (mean gene frequency 0.0564),13 peaking in the Iberian peninsula (gene frequency >0.1400).25,26 The distribution of PI*S gradually decreases along a south-west → north-east gradient. The distributions of both PI*Z and PI*S in Europe are summarised in fig 2.

Frequencies of (A) PI*S and (B) PI*Z genes in Europe.
The mean ratios of PI*S:PI*Z are 4.5:1 in southern Europe, 3.5:1 in western Europe, and 1.1:1 in northern Europe (calculated from de Serres et al13).
Genetic epidemiology of AAT deficiency in particular European populations
As stated above, Scandinavia is one of the European regions with the highest figures for the PI*Z type; nevertheless, gene frequencies for both PI*S and PI*Z among Finnish and Swedish Lapps are at the lowest end of the European frequencies.27,28
Analysis of 40 cohorts from Italy (reviewed by de Serres et al29) showed that the gene frequencies of PI*S and PI*Z are highest in northern Italy and decrease gradually from north to south. In one of the few available population based surveys performed in 9000 neonates in South Tyrol, a comparison between German and Italian individuals yielded a PI*Z gene frequency of 0.019 and 0.015, respectively.30 In Sardinians the gene frequency of PI*S is higher than in continental Italy whereas that of PI*Z is much lower.
The frequency of PI*S in the Basque region is as high as in the rest of the Iberian peninsula, whereas the frequency of the PI*Z type is much lower.31,32
Although one could suppose that, at least for the Lapps, susceptibility genes for pulmonary diseases such as PI*S and PI*Z may have been eliminated by the unfavourable climate, a more likely explanation for the diversity in PI* gene frequencies lies in the great isolation of the Lapp, Sardinian, and Basque populations from other genetic influences. In fact, analysis of major histocompatibility complex class I alleles revealed that these populations have marked genetic differences from other surrounding populations.33
Other developed countries
North America
Since it is widely accepted that AAT deficiency arose in European populations, the spread of the disorder in countries whose inhabitants have a European background is not surprising.34 However, the average gene frequency of PI*Z in North America is 0.0092 (at the lowest end of the range reported in Europe), whereas the frequency of the PI*S gene is 0.0328 which is higher than that reported for Northern Europe.13 This figure might be due to very mixed populations in North America and to the limited number of cohorts available (43) with respect to the overall population. A population based survey performed in 20 000 blood donors in the St Louis area yielded a PI*Z prevalence of 1 in 2800 individuals.35
Australia and New Zealand
The gene frequencies of PI*Z and PI*S in Australia and New Zealand are very close to those reported for North America (0.0151 and 0.0395, respectively), probably for the same reasons.
Far East Asia
Very limited cohorts have been reported from Japan, China, and South Korea.13 The gene frequency of PI*Z is 0.0002 in Japan, 0 in China, and 0.0061 in South Korea, whereas the respective figures for PI*S are 0.0004, 0.0006, and 0.0070. Interestingly, the AAT M1 (Ala213) variant, found in approximately 20–23% of AAT deficient white subjects,11 was not detected in any of 156 Japanese subjects. Since the Z variant has developed on the M1 (Ala213) base allele (fig 1), this may account for the extreme rarity of the PI*Z gene in the Japanese and other Far Eastern populations. These findings also account for the prevalence of the Siiyama deficiency variant in the Japanese; this variant arose on the M1 (Val 213) base allele (fig 1)36,37 and was present in 100% of the 156 Japanese investigated.
South America
Only a few cohorts from Southern America have been reported, so no firm data can be presented.13
Developing countries
The belief that AAT deficiency is a disorder which mostly affects white subjects has been, in part, shaken by the analysis of the worldwide surveys performed by de Serres.13 He provided evidence for a significant prevalence of both PI*Z and PI*S in populations from the Middle East and North Africa, Central and Southern Africa, and Central and South-East Asia, suggesting that AAT deficiency has prevailed over racial and ethnic boundaries.
AGE ESTIMATES OF AAT DEFICIENT VARIANTS AND THEIR DIFFUSION THROUGH POPULATIONS
The analysis of allelic variants within the serpin gene cluster in defined populations may yield useful information about the time and site of origin of AAT deficient variants. In an investigation of white PI*Z families of northern European origin, Byth and coworkers38 found that 97% of cases had a unique haplotype of 60 kB encompassing the CBG, PIL, and AAT genes associated with the PI*Z allele, thus supporting the theory of a single origin for the PI*Z mutation.39 Haplotype analysis also allows an estimate of the time the PI*Z mutation first occurred. Based on the assumption of random recombination in a given area, Byth hypothesised that the PI*Z mutation might have arisen 66 generations ago—that is, assuming 33 years to be the mean lag for each generation, ~2000 years ago. This estimate differs from a previous hypothesis of 216 generations (~7000 years ago39) and a more recently advanced estimate of 120 generations (~4000 years ago40). Interestingly, according to the last estimate, the PI*Z mutation could have been dispersed during the Neolithic era, as has been suggested for the cystic fibrosis ΔF508 mutation.40,41 According to the hypothesis that the higher the gene frequency in a given country, the more likely it is that the gene first occurred there,12 it is commonly accepted that the PI*Z gene arose in northern Europe (and maybe more precisely in southern Scandinavia) and subsequently spread to other European countries and to countries bordering the Mediterranean Sea, following the known major population movements in Europe such as the Viking voyages. Nevertheless, the facts that patterns of haplotype diversity contrast with the expected stepwise reduction if the mutation spread from north to south, as demonstrated in populations from the Iberian peninsula,40 and that PI*Z types are found in populations from Central and South Africa and from Asia,13 suggest a diffusion against the main known directions of population movements or, alternatively, a multiregional origin for the PI*Z gene.
The finding that the prevalence of PI*S is highest in the Iberian peninsula indicates that the PI*S gene probably originated in this area, and perhaps more precisely in the Portuguese population.40 Interestingly, serpin haplotype investigation in this population suggests that this event occurred 15 000–10 000 years (450–300 generations) ago, making the PI*S mutation much older than the PI*Z one. At variance with the European spread of PI*Z, the west to east gradient of PI*S mutation indicates a diffusion against the known major population movements in Europe.
WORLDWIDE ESTIMATES OF SUBJECTS WITH AAT DEFICIENCY
Taking into account the gene frequencies of PI*S and PI*Z reported in the genetic epidemiology surveys retrieved from the international literature and the number of individuals in the total populations in different countries, de Serres13 calculated worldwide estimates of subjects affected by intermediate AAT deficiency (that is, carriers) and of subjects at high risk of developing lung/liver disease associated with AAT deficiency (that is, PI*Z homozygotes and PI*SZ compound heterozygotes). Of course, such an approach incorporates potential biases: in addition to the above reported limitations of the studies considered, some investigations were performed in selected populations which were poorly representative of the general population.29 As an example, the cohorts examined for Italy included a number from the valleys on the south side of the Alps30 (where geological barriers are evident, separating these cohorts from those recruited among inhabitants of the nearby plains), and from Sardinia (whose genetic isolation has been already discussed33). These results should therefore be considered with caution. Despite these caveats, the overall estimates of approximately 116 000 000 carriers and 1 100 000 subjects with severe AAT deficiency worldwide are astonishing and indicate that AAT deficiency is probably one of the most common severe hereditary disorders in the world (table 1).
Estimates of the worldwide numbers of carriers (Pi MS and PiMZ) and subjects at high risk for developing lung/liver disease associated with AAT deficiency (excluding Central and South America)
OPEN QUESTIONS AND FUTURE DIRECTIONS
AAT deficiency is an under-recognised condition
Taking into account the above mentioned estimates, it is evident—not only to physicians actively involved in the diagnosis and management of AAT deficiency—that this is a largely under-recognised condition. The availability of AAT replacement therapy for individuals with pulmonary emphysema associated with AAT deficiency42 encouraged the scientific community to establish and reinforce AAT deficiency screening programmes in developed countries, even in those not previously considered to have a high prevalence of the disorder, and to implement national registries.43 In response to a suggestion forwarded during a WHO meeting on AAT deficiency,34 an international registry confederating national registries from several countries was established in 1996.44,45 In spite of the extensive efforts made to identify cases with AAT deficiency, it is clear that only a small minority of subjects are actually recognised (table 2).
Relationship between expected and diagnosed cases of AAT deficiency (Pi ZZ + Pi SZ) in selected countries
There are at least two reasons for this under-recognition. Firstly, the clinical phenotypes associated with AAT deficiency (pulmonary emphysema, chronic bronchitis, bronchiectasis, asthma and, to a lesser extent, chronic liver disease) are not exclusive to the condition. Even familial aggregation of the phenotype, a typical feature of inherited disorders, is not a useful sign since common chronic obstructive pulmonary disease often tends to cluster in families.46 Secondly, the PI*Z gene is characterised by an incomplete penetrance—that is, the relationship between genotype and clinical phenotype is not strong. Silverman and coworkers examined pulmonary function in a cohort of 52 PI*Z subjects: 20 out of the 52 subjects (38%) had a forced expiratory volume in 1 second (FEV1) over 65% predicted and frequently within the normal range.47 These PI*Z subjects with normal or only mildly impaired lung function are usually identified as non-index cases—that is, cases ascertained during family screening. The same authors also found that the severity of the disease manifestations is affected by some variables such as cigarette smoking and lower respiratory tract infections (gene × environment interaction). The percentage of subjects with asymptomatic or mild AAT deficiency was even higher among a series of 94 individuals with PI*SZ compound heterozygosity.48 In conclusion, there is evidence that many individuals with severe AAT deficiency do not have clinically significant lung function impairment. This feature of AAT deficiency deserves further investigation, both from the epidemiological and genetic viewpoints.
Epidemiology of rare (non-Z, non-S) AAT deficient variants
Little is known about the genetic epidemiology of rare AAT deficient variants which are considered not to exceed 2–4% of all variants.49 However, the prevalence of these variants may be higher than was previously believed because rare AAT deficient variants can be mistaken for the PI*Z variant and therefore misdiagnosed. Indeed, we have preliminary data from the Italian Registry for AAT Deficiency to indicate that as many as 22% of the total AAT deficient variants are rare.50 The nomenclature of some of these variants (see above) reflects their probable Italian origin (Mprocida, Mpalermo, QOisola di procida, QOtrastevere).5 An intriguing question is: are the rare AAT deficient variants more frequent in those countries in which the gene frequency of PiZ is lower? Data from the island of Sardinia seem to support this hypothesis.51 Clinical phenotypes associated with the common AAT deficient variant PI*Z are reasonably well defined, as will be discussed later in this review series, but no information is so far available on clinical phenotypes associated with rare AAT deficient variants. This should be addressed by future studies.
Acknowledgments
The authors are grateful to Drs Jordan Baccheschi, Ilaria Ferrarotti, and Michele Zorzetto for their help in preparing this manuscript, and to Dr Rachel Stenner for editing it.
REFERENCES
Footnotes
-
In part supported by IRCCS Policlinico San Matteo Ricerca Corrente Grants, Italian MIUR Progetti di Interesse Nazionale 2002, Fondazione Cariplo, Bayer EU, and Altana Pharma.