Article Text

Abstract
BACKGROUND The gold standard diagnostic test for obstructive sleep apnoea (OSA) is overnight polysomnography (PSG) which is costly in terms of time and money. Consequently, a number of alternatives to PSG have been proposed. Oximetry is appealing because of its widespread availability and ease of application. The diagnostic performance of an automated analysis algorithm based on falls and recovery of digitally recorded oxygen saturation was compared with PSG.
METHODS Two hundred and forty six patients with suspected OSA were randomly selected for PSG and automated off line analysis of the digitally recorded oximeter signal.
RESULTS The PSG derived apnoea hypopnoea index (AHI) and oximeter derived respiratory disturbance index (RDI) were highly correlated (R = 0.97). The mean (2SD) of the differences between AHI and RDI was 2.18 (12.34)/h. The sensitivity and specificity of the algorithm depended on the AHI and RDI criteria selected for OSA case designation. Using case designation criteria of 15/h for AHI and RDI, the sensitivity and specificity were 98% and 88%, respectively. If the PSG derived AHI included EEG based arousals as part of the hypopnoea definition, the mean (2SD) of the differences between RDI and AHI was –0.12 (15.62)/h and the sensitivity and specificity profile did not change significantly.
CONCLUSIONS In a population of patients suspected of having OSA, off line automated analysis of the oximetry signal provides a close estimate of AHI as well as excellent diagnostic sensitivity and specificity for OSA.
- sleep apnoea
- polysomnography
- oximetry
- portable monitor
Statistics from Altmetric.com
Obstructive sleep apnoea (OSA) is a common disorder, occurring in 2% and 4% of middle aged women and men, respectively.1 The gold standard diagnostic test for OSA is overnight polysomnography (PSG). Because of the cost and requirement for technical expertise, a number of alternatives to PSG have been proposed.2 Oximetry is particularly appealing because of its widespread availability but results from previous studies have been variable, with sensitivities ranging from 40% to 100%.3-8 In 240 consecutive patients Sérieset al found that oximetry had a 98% sensitivity for diagnosing OSA (apnoea hypopnoea index (AHI) ⩾10/h) but a specificity of only 48%.8
We have previously described a monitor which used snoring (primarily) and oxygen saturation (secondarily) to identify respiratory events.9 In 129 patients referred for assessment of sleep apnoea who were evaluated with simultaneously performed PSG, the sensitivity and specificity ranged from 84% to 90% and from 95% to 98%, respectively, depending on the AHI diagnostic criterion employed. However, these findings were limited by possible bias since a prospective consecutive sample of patients was not used and the interpretative algorithm was developed retrospectively.
In a subsequent unpublished pilot study the diagnostic performance of this monitor was improved by modifying the oximetry analysis algorithm and eliminating the snoring signal from the analysis process entirely. We prospectively validated the new automated analysis algorithm (AAA) in a randomly selected group of patients referred to a university-based tertiary sleep referral centre.
Methods
Patients were recruited from the Alberta Lung Association Sleep Centre, which is the major sleep referral centre for southern Alberta. All referrals were considered eligible unless they met one or more of the following exclusion criteria: age <18 years, history of neuromuscular disease, severe lung disease (forced expiratory volume in one second (FEV1) <50% predicted), severe daytime hypoxaemia (Pao 2 <7.3 kPa), severe coronary artery disease (unstable angina, more than three angina episodes/week, myocardial infarction, or coronary artery bypass surgery in the previous six months), out of town residence, referral for chronic insomnia (without symptoms of snoring, gasping or choking), restless leg syndrome, night terrors, history of psychiatric conditions requiring the use of tranquillisers, or a language barrier.
The number of patients referred to the sleep centre exceeded the ability of the laboratory to study a consecutive sample of patients in a timely fashion so a random sample (n = 326) of consecutive patients referred for possible OSA was identified prior to physician assessment. The first 81 patients underwent in-laboratory PSG and home monitoring and the remaining 245 patients underwent in-laboratory PSG and the oximeter signal was digitally recorded for use by the off line automated analysis algorithm. This group formed the population sample for this study. Simultaneous PSG and digital recording of oximetry was initiated after differences in PSG derived AHI and home monitor derived respiratory disturbance index (RDI) were observed in the first 81 patients. In order to determine whether differences between the home monitor and PSG were due to variability associated with the home environment, night to night variability, or bias intrinsic to the analysis algorithm, it was necessary to analyse in-laboratory performance of the automated analysis algorithm independent of the home environment. The home monitoring study will be reported in a separate paper.
The study was approved by the University of Calgary Conjoint Medical Research ethics committee and all participants provided written informed consent.
POLYSOMNOGRAPHY
PSG data were recorded by a computerised polysomnographic system (Alice3, Healthdyne Technologies, Atlanta, Georgia, USA). This included a standardised montage: two channel electroencephalograms (EEG; C4/A1, C3/A2), bilateral electro-oculograms (EOG), submental electromyogram (EMG), bilateral leg EMGs, and electrocardiography (ECG). Airflow was measured using a thermistor (Healthdyne Technologies), respiratory effort was assessed by inductance plethysmography (Respitrace, Ambulatory Monitoring, Ardsley, New York, USA), and oxygen saturation was recorded using a finger or ear probe (953 Finger Flex Sensor; Healthdyne Technologies). The oxygen saturation signal was digitally sampled at 1 Hz and stored both on the PSG record and in a separate monitor for off line analysis.
POLYSOMNOGRAPHIC SCORING
A single trained observer, blinded to the off line analysis results, reviewed the PSG records. Sleep stages were scored according to the criteria of Rechtschaffen and Kales.10 Arousals were defined as episodes lasting three seconds or longer in which there was a return of alpha activity associated with a discernible increase in EMG activity. An apnoea was defined as a cessation of oronasal airflow for a minimum of 10 seconds.
Oximetry has been criticised for its inability to detect respiratory events associated with arousals but without significant falls in oxygen saturation. Consequently, the RDI values in a subset of patients were compared with the AHI derived from a hypopnoea definition that also incorporated EEG based arousals. Hypopnoea was independently identified using two different criteria, defined as a reduction in thoracoabdominal movement for >10 seconds associated with (1) a reduction in oxygen saturation of ⩾4% (type A) and (2) either a fall in oxygen saturation of ⩾4% or an arousal (type B). Oxygen desaturation was defined as a decrease in oxygen saturation of ⩾4% (at nadir) followed by an increase to within 1% of the pre-hypopnoea baseline value. A reduction in thoracoabdominal movement was defined as a >30% reduction in either the thoracic or abdominal Respitrace channel.
The AHI was calculated as the total number of apnoeas plus hypopnoeas divided by the total sleep time and was calculated separately using type A hypopnoea criteria (AHI-A) and type B criteria (AHI-B). The calculation of AHI-B involved a labour intensive process of independently re-scoring PSG records, so a random subset of 94 patients was chosen for comparing AHI-B with the RDI.
AUTOMATED OFF LINE ANALYSIS ALGORITHM
Nocturnal oxygen saturation was sampled at 1 Hz, converted from an analogue to a digital signal, and stored in a portable monitor. The monitor employed a Healthdyne 202-11 oximeter (Healthdyne Technologies). The following morning the data were downloaded into a personal computer where they were interpreted by the non-proprietary automated analysis algorithm. Only the oxygen saturation signal was used to determine the monitor RDI. The algorithm sequentially scanned each recorded oxygen saturation value (1 Hz). Whenever a drop in a sampled oxygen saturation value was detected the program assigned an event marker to that reading. Because oxygen saturation values were sampled and recorded at 1 Hz, event markers were separated by no less than one second. When an increase in oxygen saturation was detected, the program determined if at least three consecutive event markers—that is, three consecutive falls in recorded oxygen saturation readings—were present prior to this rise. If this criterion was met and one of the event markers was associated with an oxygen saturation value ⩾4% lower than the baseline oxygen saturation, then a respiratory disturbance was designated. Baseline Sao 2 was calculated as a moving time average. The mean of the top fifth percentile of oxygen saturation values over the five minutes preceding the event was taken as baseline. The RDI was calculated by dividing the total number of respiratory disturbances by the total monitor probe-on time. The RDI was generated by automated analysis only, and no attempt was made to score the oximetry record manually.
ANALYSIS OF DATA
Differences in mean AHI-A, AHI-B, and RDI were assessed by analysis of variance. The strength of association between the RDI and AHI was explored using scatterplots and Spearman's rank test. Modified Bland-Altman plots were constructed to assess the agreement between PSG and RDI.11 The mean of the differences between PSG and RDI (instrument bias) and the limits of agreement (2SD of the mean of the differences) were calculated. Receiver operating characteristic (ROC) curves were constructed to evaluate the automated analysis algorithm diagnostic performance at four commonly used AHI diagnostic criterion values (10, 15, 20, and 30/h). Sensitivity and specificity may be altered by small, clinically insignificant differences in AHI and RDI if the measured values just lie on either side of an OSA diagnostic cut off value. We therefore also assessed the algorithm performance after the exclusion of patients with small differences between AHI and RDI ((AHI-B − RDI) <5/h) which straddled the diagnostic threshold values—that is, one result above and the other result below the OSA diagnostic threshold. The number of patients in whom a diagnosis of OSA was missed (false negative) and the number in whom a diagnosis of OSA was inappropriately made (false positive) were recorded.
Results
PATIENT CHARACTERISTICS
A total of 915 referral letters were reviewed and 681 patients were deemed eligible for study. Two hundred and thirty four patients were excluded from the study because of out of town residence (n = 178), chronic insomnia (n = 30), age <18 years (n = 5), neuromuscular disease (n = 4), severe coronary artery disease (n = 4), severe lung disease (n = 2), significant daytime hypoxaemia (n = 2), restless leg syndrome (n = 2), night terrors (n = 2), psychiatric illness (n = 2), or narcolepsy (n = 3). Of the 681 eligible patients 326 were randomly selected to participate in the study. Seven patients refused to participate, giving a participation rate of 98%. Of the 319 patients studied four had technically inadequate PSG studies leaving a total of 315 patients for final analysis. All patients underwent in-hospital PSG and a home monitoring study. The automated analysis algorithm was validated on the last three quartiles (245 patients) by comparing the PSG derived AHI with the RDI derived from off line analysis of the oximetry signal. Of the 245 patients recruited for AAA validation, four of the oximetry records were deemed inadequate, thus leaving 241 patients for analysis. The oxygen saturation signal was derived from either an ear probe (n = 103) or a finger probe (n = 138). AHI-B was calculated from a randomly selected subset of patients who were evaluated using the finger probe (n = 94).
Patient characteristics and PSG results are summarised in table 1. The prevalence of OSA was 59%, 49%, 38%, or 27% based on AHI-A diagnostic cut off values of 10, 15, 20, or 30/h, respectively.
Summary of patient characteristics (n = 241) and polysomnographic results
MEASURES OF ASSOCIATION AND AGREEMENT
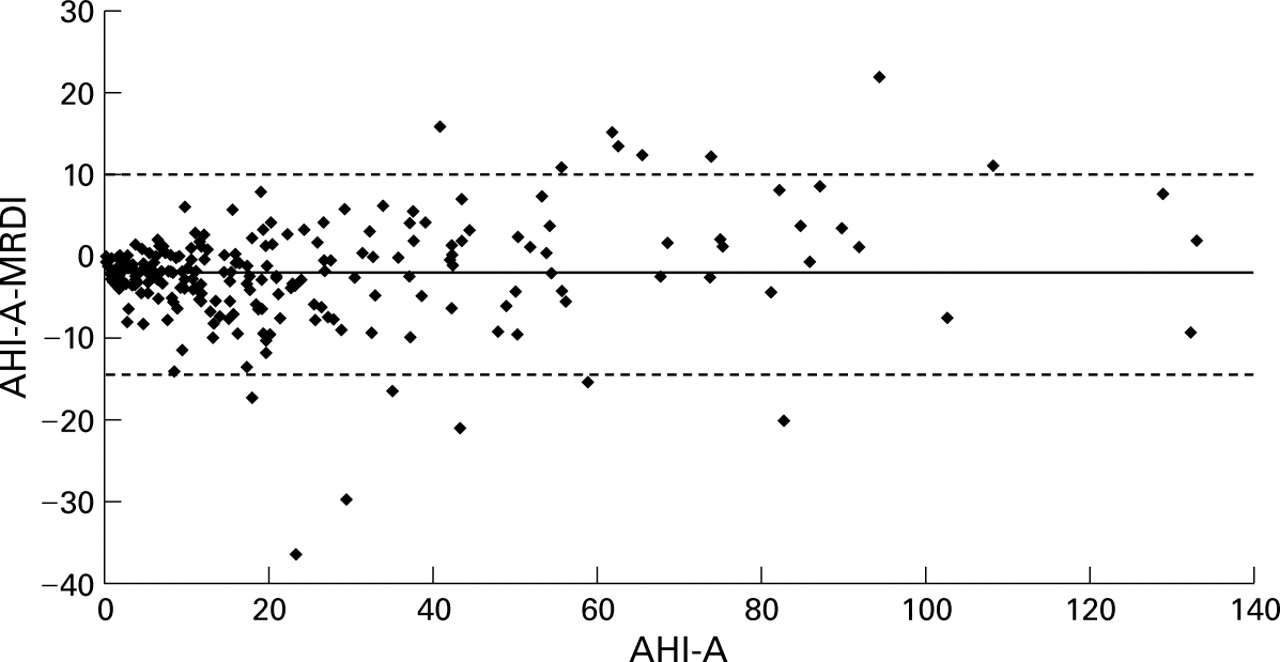
As illustrated in fig 1, the PSG derived AHI-A and the oximetry derived RDI were strongly correlated (R = 0.97). The mean of the differences between AHI-A and RDI was small (2.18 (12.34)/h). The modified Bland-Altman plot (fig 2) illustrates the distribution of the differences between RDI and AHI-A. Visual inspection indicates that large differences between the RDI and AHI were associated with high AHI values where the discrepancy would have little impact on the diagnosis of OSA. The sensitivity and specificity depended on the AHI and RDI case designation criterion values chosen for diagnosing OSA (table 2). At an AHI and RDI cut off value of >15/h the automated analysis algorithm had a sensitivity of 98% and a specificity of 88%. At an AHI and RDI criterion value of >20/h the oximetry analysis algorithm had a sensitivity of 97% and a specificity of 85%. The diagnostic performance of the analysis algorithm, using a spectrum of RDI cut off values, is graphically presented in fig3.

Correlation between (A) PSG determined AHI-A and RDI (n = 241) and (B) PSG determined AHI-B and RDI (n = 94). The solid line is the line of identity (AHI = RDI).

Modified Bland-Altman plot illustrating the agreement between AHI-A and RDI. A mean difference of 2.18/h existed between AHI-A − RDI (bias, thick solid line). This difference between test results will fall within 12.34/h of the mean difference 95% of the time (broken lines).
Sensitivity and specificity of the off line automated analysis algorithm at a variety of AHI and RDI OSA diagnostic criterion values

Receiver operating characteristic (ROC) curves of the analysis algorithm sensitivity and specificity at a variety of AHI and RDI diagnostic criterion values. (A) Summary of AAA performance using a PSG derived AHI of (A) ⩾10/h and (B) ⩾15/h as the OSA case designation criterion values. The symbols represent the sensitivity and specificity for diagnosing OSA at different RDI cut off values: line (⩾30/h), diamond (⩾20/h), square (⩾15/h), triangle (⩾10/h), circle (⩾5/h).
Patients with a discordance in OSA diagnosis—that is, one test above and one test below the diagnostic threshold level—but with only small differences between the AHI and RDI of <5/h were excluded for the purposes of assessing clinically significant agreement. A total of 16 patients were excluded, thus leaving 225 patients. The algorithm missed a diagnosis of OSA (AHI >15/h) in two patients (false negative rate 1.7%) but misdiagnosed OSA in 10 patients (false positive rate 10.3%). The false negative rate remained less than 3% regardless of the AHI criterion value used to diagnose OSA.
EFFECTS OF AROUSAL BASED SCORING CRITERIA ON DIAGNOSTIC PERFORMANCE
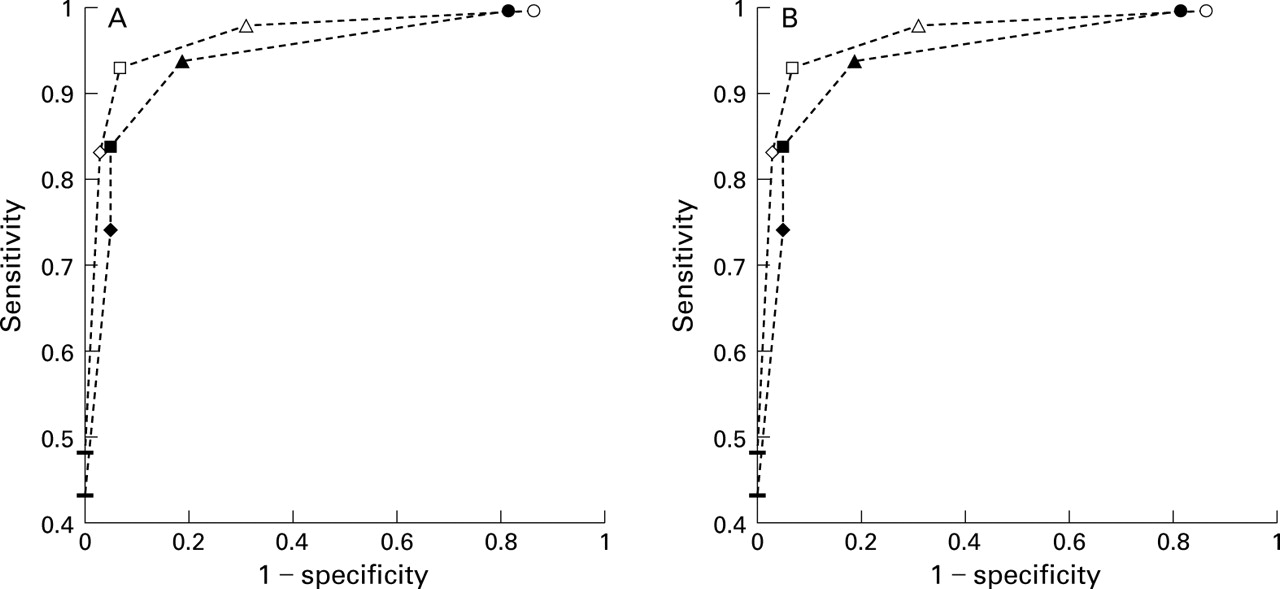
The effect of adding arousal criteria to the hypopnoea definition was evaluated in a randomly selected subset of 94 patients who were studied by finger probe. The mean AHI-A, AHI-B, and RDI were 15.8/h, 18.6/h, and 19.5/h, respectively, and were not significantly different (p = 0.11). The correlation between AHI-B and RDI was 0.98 (fig 1). The mean of the differences between AHI-B and RDI was −0.12 (15.62)/h. As demonstrated by the ROC curve (fig 4), the diagnostic performance of the analysis algorithm was similar whether patients were scored using AHI-A or AHI-B criteria.

Receiver operating characteristic (ROC) curves of the analysis algorithm sensitivity and specificity at a variety of AHI and RDI diagnostic criterion values. Summary of AAA performance using a PSG derived AHI of (A) ⩾10/h and (B) ⩾15/h as the OSA case designation criterion values. The symbols represent the sensitivity and specificity for diagnosing OSA at different RDI cut off values: line (⩾30/h), diamond (⩾20/h), square (⩾15/h), triangle (⩾10/h), circle (⩾5/h). The dotted lines with solid symbols are the ROC curves for patients evaluated by finger probe (n = 94) and scored using hypopnoea criteria incorporating arousals (AHI-B). The dotted lines with open symbols are the ROC curves for the same population (n = 94) where the oxygen saturation was scored using hypopnoea criteria incorporating oxygen saturation.
Discussion
This study evaluated the diagnostic performance of an automated algorithm for analysing digital oximetry in a large, prospective, randomly selected clinic population referred for OSA. Excellent correlation existed between the PSG determined AHI and the oximetry derived RDI. The RDI overestimated AHI-A by 2.18 (12.34)/h. The inclusion of arousal based hypopnoea criteria (type B) reduced the instrument bias (–0.12 (15.64)/h) and did not degrade the correlation. The automated analysis algorithm has a high sensitivity and specificity that is not significantly affected by an inability to detect arousals from sleep.
A number of epidemiological and statistical techniques were employed to ensure internal validity. The value of oximetry is influenced by the pre-test clinical suspicion of OSA.7 In order to obtain a relatively “pure” estimate of the instrument characteristics, patients were randomly selected for inclusion in the study prior to physician assessment, thus decreasing the chance of selection bias.
The recruitment process may be criticised as the first 81 patients underwent only in-laboratory PSG and home recording of digital oximetry. This study cohort was derived from the last 245 patients. The initial 81 patients did not undergo in-laboratory recording of digital oximetry. In-laboratory evaluation of the analysis algorithm was implemented in order to determine whether differences found between the home monitor and PSG were due to variability associated with the home environment, night to night variability, or bias intrinsic to the analysis algorithm. Patient recruitment occurred over a two year period (June 1994 to October 1996), with recruitment of the last 245 patients commencing within one year (March 1995) of initial recruitment. It is unlikely that a significant difference occurred in the patient population over this period of time.
Because of a lack of established AHI diagnostic criterion values for OSA, ROC curves were generated at several values: 10, 15, 20, and 30/h (fig 3). As expected, the algorithm sensitivity and specificity depended on the RDI and AHI case designation values chosen. If OSA is defined using an AHI and RDI cut off value of 15/h, then the automated analysis algorithm has a sensitivity and specificity of 98% and 88%, respectively. This level of diagnostic performance has never been previously reported for a monitor based on the oxygen saturation signal alone. Indeed, for the purposes of diagnosing OSA it is comparable to the sensitivity and specificity observed with level II ASDA class monitors (comprehensive portable polysomnography).12 In one of the few publications in which a level II ASDA device was compared with standard polysomnography, Orr et al reported that their recorder had a sensitivity of 100% and a specificity of 93% for diagnosing OSA (AHI >15/h). Level III ASDA devices assess cardiorespiratory variables but do not record EEG, EOG, or chin EMG, and therefore do not allow for direct determination of wakefulness and sleep staging. These typically yield diagnostic sensitivities of 91–100% and specificities of 86–100%.13-15
The choice of hypopnoea definition is controversial since the prevalence of OSA is dependent on the definition of hypopnoea chosen. An oxygen desaturation threshold of ⩾4% was selected because of its widespread use in the research literature1 ,16 ,17 and the threshold should be above the 2% variability associated with oximetry.
We have previously shown that the addition of arousal based scoring criteria for hypopnoea causes only small changes in AHI.18As illustrated by the ROC curves in fig 4, there was little change in diagnostic sensitivity or specificity regardless of whether the AHI incorporated arousal criteria (AHI-B) or not (AHI-A).
Small differences between AHI and RDI that straddle OSA diagnostic cut off values may alter sensitivity or specificity, despite being of little clinical significance. Consequently, we determined the false negative and false positive rates of the oximetry analysis algorithm after excluding patients that had discordances in OSA diagnosis and only small differences between the AHI and RDI ((AHI − RDI) <5/h). Although classic sensitivities and specificities cannot be determined using this type of analysis, the false negative rate of the algorithm remained low (<3%). False positive rates were somewhat higher (10%).
The factors responsible for large differences between RDI and AHI are unclear. The PSG records of patients with (RDI − AHI) of >15/h were reviewed. Patients with RDI overestimation of AHI had an increased number of type A hypopnoeas during EEG scored wake state. Since oximetry does not distinguish between wake and sleep, type A hypopnoeas during the wake state were included in the RDI but not in the AHI. The reasons for RDI underestimation of AHI are less clear. Decreased sleep efficiency may decrease the RDI since the RDI is derived from the total probe-on time and not total sleep time. Alternatively, unrecognised technical difficulties or signal failure may also have resulted in RDI underestimation of AHI.
A limitation to the applicability of this study is that the algorithm was evaluated by comparison with simultaneous PSG. Several studies have shown a difference in RDI between home and hospital despite using the same monitor and controlling for technical difficulty.15 ,19 By evaluating patients in the sleep laboratory we eliminated potential confounders such as technical difficulties associated with remote monitoring, night to night variability, and the effects of the home environment on RDI. While this has advantages with respect to defining the performance characteristics of the analysis algorithm, further validation in the home setting is necessary. Nevertheless, this study is unique in describing an off line analysis algorithm that has excellent diagnostic performance using the oxygen saturation signal alone.
In summary, off line automated analysis of the oxygen saturation signal provides an accurate estimate of AHI. It also has excellent diagnostic sensitivity and specificity for OSA that is not significantly affected by an inability to detect arousals from sleep.
Acknowledgments
This study was supported by the Alberta Health Services Research Innovation Fund. Dr Tsai was supported by an Alberta Heritage Foundation for Medical Research Clinical Fellowship.
The monitors (Snoresat) used in the study were provided by Sagatech Electronics Inc, Calgary, Alberta, Canada.