Article Text

Abstract
BACKGROUND Nitric oxide (NO) is involved in inflammation and host defence of the lung. It has been found in increased concentrations in the airways in asthmatic subjects but its levels in patients with chronic obstructive pulmonary disease (COPD) have not been investigated. A study was undertaken to determine whether markers of NO metabolism (NO in exhaled air, iNOS expression in sputum cells, and nitrite + nitrate (NO2 –/NO3 –) in sputum supernatant) are increased in subjects with COPD, and whether they correlate with inflammatory indices in induced sputum. The associations of these markers with smoking were also assessed.
METHODS Sixteen subjects with COPD (median age 66 years, median forced expiratory volume in one second (FEV1) 63% predicted, eight current smokers) and 16 healthy subjects (median age 63 years, median FEV1 113% predicted, eight current smokers) participated in the study. NO was measured during tidal breathing and sputum was induced by inhalation of hypertonic saline.
RESULTS No differences were observed between subjects with COPD and healthy controls in exhaled NO excretion rate (median 5.15 and 6.25 nmol/min), sputum macrophage iNOS expression (14% and 12%), and sputum supernatant NO2 –/NO3 – (46 and 73 μM). NO in exhaled air correlated with the percentage of sputum eosinophils in patients with COPD (rho = 0.65, p = 0.009) but not in healthy individuals. Exhaled NO and supernatant NO2 –/NO3 – levels were lower in healthy smokers than in healthy non/ex-smokers.
CONCLUSIONS Our findings indicate that NO metabolism is not increased in patients with stable COPD. The close association between exhaled NO levels and sputum eosinophils suggests a role for NO in airway inflammation in COPD. Studies performed during exacerbations may clarify this role.
- sputum
- exhaled nitric oxide
- smoking
- chronic obstructive pulmonary disease
Statistics from Altmetric.com
Nitric oxide (NO) is a small molecule involved in many aspects of pulmonary function in health and disease.1 It is synthesised from the amino acid l-arginine by NO synthase (NOS), of which three isoforms exist.1 The neuronal and endothelial isoforms are constitutive and produce small amounts of NO for short periods of time, whereas the inducible isoform (iNOS) produces large amounts of NO for longer periods of time after cell activation by immunological stimuli such as bacterial endotoxins and cytokines. After production NO can be exhaled, metabolised to nitrate and nitrite, or interact with superoxide to form peroxynitrite. NO plays a part in inflammation and host defence, and it may be important in airway inflammation in asthma since increased concentrations of NO have been found in exhaled air,2 as well as increased levels of nitrate and nitrite in sputum supernatant3 and of iNOS expression in bronchial epithelial cells.4
It is not known whether changes in NO production are involved in chronic obstructive pulmonary disease (COPD) as well. Inflammation of the airways is often present in patients with COPD5 and may be studied by analysis of induced sputum. Increased percentages of neutrophils and concentrations of interleukin (IL)-8 and tumour necrosis factor (TNF)-α have been found in induced sputum in patients with COPD.6-8 Factors that promote these inflammatory changes in COPD such as cytokines and bacterial endotoxins may also induce expression of iNOS thereby causing increased production of NO.
We investigated whether markers of NO metabolism—NO concentrations in exhaled air, iNOS expression in sputum cells, and nitrite + nitrate (NO2 –/NO3 –) in sputum supernatant—in subjects with COPD differ from healthy subjects and correlate with percentages of inflammatory cells in induced sputum. Moreover, we assessed whether smoking influences these comparisons and these correlations by investigating healthy individuals and patients with COPD who were current and ex-smokers.
Methods
SUBJECTS
Subjects were recruited from the pulmonary outpatient clinic of the Groningen University Hospital and by advertisements in local newspapers. The study was approved by the hospital ethical committee and all subjects gave their informed consent. Eight smoking and eight non-smoking patients with COPD, according to ATS criteria,9 and eight smoking and eight non-smoking healthy control subjects participated in the study (table 1). Subjects with COPD had a forced expiratory volume in one second (FEV1) less than the predicted value—1.64 residual standard deviation (men 0.84 l and women 0.62 l)10 and an increase in FEV1 of <10% predicted after inhalation of 1 mg terbutaline. Two healthy subjects were never smokers, the other non-smokers had quit smoking at least one year before the start of the study. All subjects had a negative history of atopy and negative specific serum IgE for 11 common aeroallergens. Eight patients who were on maintenance treatment with inhaled corticosteroids discontinued their maintenance treatment at least one month prior to the study. Exclusion criteria were treatment with oral steroids or antibiotics or a respiratory tract infection in the month prior to the study. Healthy volunteers did not have a history of pulmonary disease, were non-hyperresponsive, and had normal lung function.
Subject characteristics
STUDY DESIGN
Measurements of lung function, challenge with methacholine bromide and adenosine 5′-monophosphate (AMP), and sputum induction were performed at 08.00 hours on different days. AMP challenge and sputum induction were separated by 7–14 days. Subjects were asked not to use short acting bronchodilators within 12 hours before the measurements and not to smoke or drink tea or coffee on the morning of the visit.
MEASUREMENT OF NO IN EXHALED AIR
The tidal breathing method was used for NO measurements.11 In short, subjects were sitting upright and wore a noseclip. They inhaled air from a Douglas bag which contained <3 parts per billion (ppb) of NO. The bag was connected to the mouthpiece via a pneumotachograph and a Hans Rudolph valve. Subjects exhaled against a resistance of 0.2 kPa. Exhaled air was collected in another Douglas bag during five minutes of tidal breathing. This bag was connected with an 80 cm narrow bore tube (Teflon) to a chemiluminescence analyser (CLD700AL, Ecophysics, Basel, Switzerland) with a sampling rate of 0.6 l/min. A two point calibration was performed regularly by precision flow controllers (accuracy 0.1%, Bronkhorst Hi-Tec BV, Ruurlo, The Netherlands) using a certified NO/N2 gas mixture diluted with air to the concentrations required. Bags and tubing were tested for leaks and adsorption of NO, and the average decrease of NO was found to be <1%/hour using a calibration mixture of 100 ppb NO. Calibrations were found to be very stable. Mean values of NO concentrations after four, five, and six minutes were used for statistical analysis. The excretion rate of NO was expressed in nmol/min and was calculated by multiplying the concentration of exhaled NO by minute ventilation, corrected for atmospheric pressure, temperature, and water vapour.
INHALATION CHALLENGE
FEV1 and vital capacity (VC) were measured using a calibrated water sealed spirometer (Lode BV, Groningen, The Netherlands) according to standardised guidelines.10Inhalation challenge tests were performed using a two minute tidal breathing method adapted from Cockcroft and coworkers.12Doubling concentrations of methacholine (0.03–19.6 mg/ml) and AMP (0.04–320 mg/ml) were administered as aerosols generated from a starting volume of 3 ml in a DeVilbiss 646 nebuliser (DeVilbiss Co, Somerset, Pennsylvania, USA), and provocative concentrations causing a 20% fall in FEV1 (PC20) were calculated.
SPUTUM INDUCTION
Sputum was induced by inhalation of hypertonic saline aerosol generated by an ultrasonic nebuliser (Ultraneb 2000, DeVilbiss, Somerset, Pennsylvania, USA). The nebuliser was calibrated at an output of 1.5 ml/min and produced particles with a diameter of 4.5 μm. Solutions of sodium chloride of 3%, 4% and 5% (w/v) were each nebulised at room temperature for seven minutes and administered through a 100 cm long tube with an internal diameter of 22 mm. Subjects wore a noseclip and had their mouth in front of the end of the tube, making exhalation beside the tube possible.
Three FEV1 manoeuvres were performed 15 minutes after inhalation of 1 mg terbutaline by Turbohaler and the highest value was taken as the baseline FEV1. Subjects then inhaled the hypertonic saline aerosols for three periods each of seven minutes. Following each period of hypertonic inhalation subjects were asked to blow their nose and to rinse their mouth and gargle their throat thoroughly with water. They were then encouraged to cough and expectorate sputum into a sterile plastic container which was kept on ice. The procedure was terminated after three periods of seven minutes or after a fall in FEV1 of 20% or more of the baseline value.
SPUTUM PROCESSING
Sputum was processed within 15 minutes of termination of the induction. The volume of the whole sputum sample was determined and an equal volume of dithiothreitol 0.1% (Sputolysin; Calbiochem, La Jolla, California, USA) was added. The samples were vortexed using a wide bore plastic test tube and placed in a shaking water bath at 37°C for 15 minutes to ensure complete homogenisation. The samples were then filtered through a 48 μm nylon gauze and vortexed. The total cell count of the filtered sample was measured and viability was checked by trypan blue exclusion. The filtered sample was centrifuged at 590g at 4°C for five minutes. The supernatant was aspirated and stored in Eppendorf cups at –80°C. The cell pellet was resuspended in FACS buffer (50 μl BSA + 1950 μl PBS) to a concentration of 0.4 × 10⁶ cells/ml and cytospins were made by placing 100 μl of the cell suspension in the funnels and centrifuging at 500 rpm and low deceleration during five minutes. Two cytospins were stained with May-Grünwald-Giemsa (MGG) for differential cell counts and the remaining cytospins were dried under a cold air blower for one hour, enveloped in aluminium foil and stored at –80°C until immunocytochemical analysis. Differential cell counts were performed by two qualified cytopathologists, blind to the origin of the samples, who counted 300 cells in each coded MGG cytospin sample. The mean of both scores was used for analysis. Interobserver variation was determined by analysis of scores of 15 patients with COPD and 15 healthy subjects and expressed as intraclass correlation coefficients (Ri = between subject variance/between + within subject variance); the Ri was 0.96 for macrophages, 0.97 for neutrophils, 0.69 for lymphocytes, 0.81 for eosinophils, and 0.91 for non-squamous epithelial cells.
BIOCHEMICAL ASSAYS
Levels of NO2 –/NO3 – were measured using the Griess reaction.13 Nitrate reductase was added prior to the Griess reaction.
IMMUNOCHEMISTRY
Cytospins were double stained with a monoclonal IgG1antibody against CD68 (Dako, Glostrup, Denmark) as a marker for macrophages and a rabbit polyclonal antiserum against iNOS (Transduction Laboratories, Lexington, Kentucky, USA). The rabbit polyclonal antiserum against bNOS (Transduction Laboratories) was used as a negative control for iNOS. Immunostaining for iNOS and bNOS was performed according to the instructions of the manufacturer. Cytospins were incubated with CD68 and 1:50 diluted anti-iNOS or bNOS (in PBS/BSA 1%) simultaneously for one hour. Goat anti-rabbit antibodies conjugated to alkaline phosphatase (1:50 dilution) and goat anti-mouse antibodies conjugated to peroxidase (1:400 dilution) were used as a second step and APAAP (1:40 dilution) as a third step. The peroxidase reaction was developed using AEC as a reagent giving a reddish brown stain. The alkaline phosphate reaction was developed using fast blue and naphthol AS-MX as reagents giving a blue stain.
ANALYSIS OF DATA
Data are presented as medians and ranges. Normal distribution of variables was checked using the Kolmogorov Smirnov test. Differences between patients with COPD and healthy subjects were evaluated by analysis of variance (ANOVA) after log transformation of variables not normally distributed. Correlations between variables were calculated using Spearman rank correlation coefficients. A p value of <0.05 was considered statistically significant.
Results
SUBJECT CHARACTERISTICS
The characteristics of the 32 subjects who participated in the study are listed in table 1. Smokers with COPD had more pack years than ex-smokers with COPD (median 43 (range 15–51) and 25 (15–43) years respectively, p = 0.029) and a lower PC20AMP (5.06 (0.23–18.52) and 29.36 (8.71–80) mg/ml respectively, p = 0.004), but did not differ in the other variables. One smoker with COPD and seven ex-smokers with COPD had maintenance treatment with inhaled corticosteroids and discontinued this at least one month prior to the study.
NO PARAMETERS
Individual excretion rates of exhaled NO are shown in fig 1. The median NO excretion rate did not differ between subjects with COPD and healthy subjects; it was lower in smoking than in non/ex-smoking healthy subjects (4.6 (2.2–7.7) and 6.5 (4.7–13.1) nmol/min, respectively, p = 0.049) but not in subjects with COPD (4.7 (2.4–13.1) and 6.5 (3.2–11.0) nmol/min, respectively, p = 0.49).

Excretion rates of exhaled NO in subjects with COPD and in healthy subjects. • = smokers; ○ = non/ex-smokers. Horizontal lines indicate median values.
Macrophages were the predominant cell type in induced sputum expressing iNOS, whereas squamous epithelial cells expressed iNOS in one subject only. The percentage of CD68 positive cells which stained positively for iNOS (fig 2) did not differ significantly between subjects with COPD and healthy subjects (14 (1–90) and 12 (0–100), respectively) nor between current smokers and non/ex-smokers (9 (0–100) and 14 (0–83), respectively).

Percentage of CD68 positive cells staining positively for iNOS in subjects with COPD and in healthy subjects. • = smokers; ○ = non/ex-smokers. Horizontal lines indicate median values.
Sputum supernatant NO2 –/NO3 – values are shown in fig 3. Median values did not differ between subjects with COPD and healthy subjects. They were lower in smokers than non/ex-smokers in healthy subjects (99 (71–135) and 49 (24–90) μM, respectively, p<0.001) but not in subjects with COPD (43 (32–81) and 59 (37–284) μM, respectively, p = 0.13).

NO2 –/NO3 – in induced sputum supernatant in subjects with COPD and in healthy subjects; • = smokers; ○ = non/ex-smokers. Horizontal lines indicate median values.
SPUTUM CELLULAR AND SUPERNATANT PARAMETERS
One smoker with COPD did not tolerate the salty taste of hypertonic saline and did not finish the sputum induction procedure. In another subject the procedure was terminated after 14 minutes due to a decrease in FEV1 of 25%. The remaining subjects finished the complete procedure without problems. One healthy smoker had too few cells on the cytospin and did not yield data for sputum cell differential counting. Sputum total cell counts and cell differential counts are shown in table 2. Subjects with COPD had significantly more cells and a higher percentage and absolute number of neutrophils and a lower percentage of macrophages.
Sputum cell counts
Smokers had fewer macrophages in induced sputum than non/ex-smokers, both in subjects with COPD and in healthy subjects (1.1 (0.3–3.6) and 7.9 (1.1–10.6) ×106/ml, p = 0.0057; and 3.24 (1.05–5.73) and 1.47 (0.57–4.36) × 106/ml, p = 0.047, respectively). In addition, healthy smokers had a lower total number of non-squamous epithelial cells than healthy non/ex-smokers (0.02 (0–0.32) and 0.14 (0.04–1.7) × 106/ml, respectively, p = 0.05). These differences were not significant in smokers and ex-smokers with COPD (0.06 (0–0.36) and 0.03 (0–0.66) × 106/ml, respectively, p = 0.29).
CORRELATIONS BETWEEN NO, SPUTUM AND CLINICAL PARAMETERS
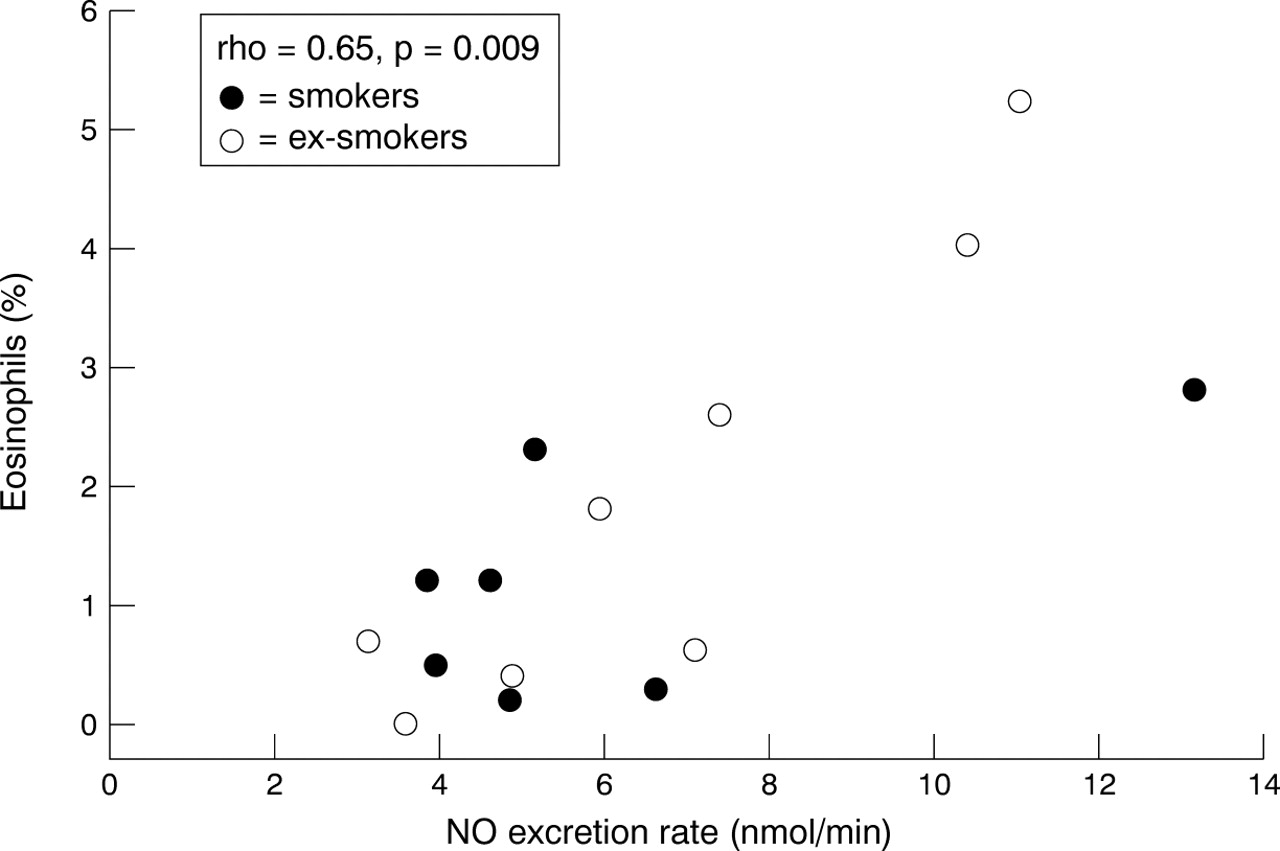
The percentage of sputum eosinophils correlated with NO excretion in the subjects with COPD (rho = 0.65, p = 0.009, fig 4). In subjects with COPD the percentage of sputum eosinophils correlated with FEV1/VC (rho = –0.55, p = 0.042) and the percentage and absolute number of neutrophils correlated with FEV1percentage predicted (rho = –0.55, p = 0.04 and rho = –0.61, p = 0.021 respectively). Otherwise no significant correlations were found.

Correlation between exhaled NO and sputum eosinophils in subjects with COPD. • = smokers; ○ = non/ex-smokers; rho = Spearman rank correlation coefficient.
Discussion
No difference was found in NO concentrations in exhaled air, sputum macrophage iNOS expression, and sputum supernatant NO2 –/NO3 – between subjects with COPD and healthy subjects. The three markers of NO metabolism were not interrelated in either of the groups. NO levels in exhaled air and supernatant NO2 –/NO3 – were lower in healthy smokers than in healthy non/ex-smokers and correlated with the percentage of eosinophils in induced sputum in subjects with COPD.
We confirm previous findings of similar concentrations of exhaled NO in subjects with COPD and healthy subjects11 ,14 ,15 and extend these findings to sputum macrophage iNOS expression and sputum supernatant NO2 –/NO3 –. NO does not seem to have an extensive role in the pathophysiology of COPD during the stable phase of the disease. However, we collected fluid from the large airways and did not get information about cells in more peripheral airways and alveoli where macrophages may have a different expression of iNOS and exert a different function from that in the large airways. Moreover, exhaled NO correlated with sputum eosinophils and has been shown to be increased during exacerbations,15which suggests a role for NO in airway inflammation in COPD.
The role of NO in airway inflammation and the relationship between NO and eosinophils in COPD are not clear. Eosinophils can produce NO and use it for transmigration or lytic effects.16 Furthermore, it is probable that other cells produce NO, which can facilitate eosinophil chemotaxis to the airways or increase eosinophil viability and upregulate their survival, as has been shown in animal studies.17 ,18 In humans epithelial cells may produce NO, thereby causing increased eosinophil influx and survival. Epithelial cells may be triggered by inflammatory stimuli such as cigarette smoke, air pollutants, viruses, and bacterial toxins to produce NO in addition to the chemotactic factor IL-8.
Our study shows that iNOS expression in sputum cells was predominantly present in macrophages. Nevertheless, other cells in the airways probably also produce NO since the percentage of iNOS expressing macrophages did not correlate with supernatant NO2 –/NO3 – and NO in exhaled air. The positive correlation between NO in exhaled air and sputum eosinophils may suggest that these cells also contribute to NO production or that NO and eosinophils are regulated by activating factors released from a common inflammatory origin. Indeed, eosinophils have recently been shown to transcribe and translate iNOS.16 However, sputum eosinophils in our study did not express iNOS and exhaled NO was also present in exhaled air of subjects who did not have any eosinophils in their induced sputum. Airway epithelial cells may also contribute to supernatant NO2 –/NO3 – and exhaled NO since NO can only diffuse a short distance through tissue and luminal NO may thus reflect local production.1 Moreover, iNOS expression has been found to be increased in airway epithelial cells in asthma.4 Whether this is also the case in COPD has not yet been determined. The NO measured in exhaled air and NO2 –/NO3 – in sputum supernatant may also be produced via constitutive NOS which has been shown to be expressed in airway endothelial cells, mast cells, fibroblasts, and neurons.1
Smoking is known to influence NO metabolism. Healthy smokers had lower exhaled NO levels and supernatant NO2 –/NO3 – than healthy non/ex-smokers. This may be the result of downregulation of NOS by NO present in cigarette smoke.19 A trend towards lower supernatant NO2 –/NO3 –in smokers was also observed in patients with COPD. The lack of difference between smokers and ex-smokers with COPD may be due to the small number of subjects in our study. It is also possible that chronic effects of smoking5 ,20 such as epithelial shedding, squamous metaplasia, and mucus hypersecretion had affected NO production and persisted after cessation of smoking. In ex-smokers with COPD loss of ciliated epithelium, known to produce NO for ciliary movement, may contribute to lower NO production. Alternatively, squamous metaplasia or mucus hypersecretion may form a barrier against stimuli in the airway lumen, preventing airway wall cells from being stimulated to produce NO.
In conclusion, we found no difference in markers of NO metabolism in sputum and exhaled air between subjects with COPD and healthy subjects. Furthermore, the markers in sputum and exhaled air were not interrelated in these two groups. The association between exhaled NO levels and the percentage of eosinophils in induced sputum in patients with COPD may be the result of inflammatory stimuli increasing both factors. Studies in patients with COPD during an exacerbation, when the numbers of eosinophils in the airways increase, may give further insight into the relation between airway eosinophils and NO.
Acknowledgments
The authors thank Dorothea de Reus, Brigitte Dijkhuizen, Janny Scholma and Andre Timmermans (Laboratory of Pulmonology and Allergology) for the processing of sputum and measurement of biochemical markers; and Jacqueline de Boer and Gineke Drok-Woltjer for assistance in the iNOS/CD68 double staining of sputum cytospins.
This study was supported by a grant from Astra Pharmaceutica BV.