Article Text

Abstract
BACKGROUND Nasal pressure tracing is now being used to measure breathing in ambulatory screening devices for sleep apnoea but it has not been compared with other methods of assessment.
METHODS Sleep induced breathing disorders were scored by three different methods of analysis (thermistry, inductive plethysmography, and nasal pressure tracing) in 193 consecutive patients referred to our sleep laboratory. With the conventional thermistry method an apnoea was defined as the absence of oronasal flow on the thermistor signal for ⩾10 s and a hypopnoea as a 50% decrease in the sum signal of inductive plethysmography tracing for ⩾10 s associated with an arousal and/or a 2% decrease in Sao 2. Nasal pressure was measured via nasal prongs connected to a pressure transducer. Using the thermistor signal alone, a hypopnoea was defined as a 50% decrease in the signal for ⩾10 s associated with an arousal and/or a 2% decrease in Sao 2. A similar definition of apnoea and hypopnoea was used for nasal pressure, the fall in pressure being substituted for the thermistor reading.
RESULTS Impaired nasal ventilation prevented adequate measurements of nasal pressure in 9% of subjects. According to the conventional method of interpretation 107 subjects were identified as having the sleep apnoea hypopnoea syndrome (SAHS). The apnoea + hypopnoea index (AHI) was significantly lower using the thermistry method than with conventional analysis (mean difference –4.3/h, 95% CI –5.3 to –3.2, p<10–4); 39% of conventional hypopnoeic events were scored as apnoeas using nasal pressure scoring. Apnoeic and hypopnoeic events could also be observed without any change in thermistor and sum Respitrace signals that resumed with the occurrence of arousals or awakenings. The AHI was significantly higher with nasal pressure scoring than with the conventional method (mean difference 4.5, 95% CI 3.4 to 5.6, p<10–4). The mean difference in apnoea index between conventional and nasal pressure scoring was –7.5/h (95% CI –8.9 to –6.1). In the 78 patients who did not have SAHS according to the conventional method of analysis there was a significant positive relationship between the arousal index and AHI measured by nasal pressure tracing (R = 0.51, p<10–4). Seventeen of the 78 patients had an AHI of >15/h by the nasal pressure method of analysis.
CONCLUSIONS Nasal pressure recording provides a simple and reliable measurement of nocturnal breathing abnormalities and may identify breathing abnormalities associated with arousals that are missed by other diagnostic methods.
- sleep apnoea hypopnoea syndrome
- diagnosis
- nasal pressure recording
Statistics from Altmetric.com
The diagnosis of the sleep apnoea hypopnoea syndrome (SAHS) is based on characteristic clinical features associated with the presence of transient reductions or episodes of cessation of breathing that define hypopnoeic and apnoeic events. These events are conventionally identified using a thermistor to measure airflow and thoracoabdominal movements to measure and identify respiratory efforts. It is commonly accepted that thermistor signals can adequately identify apnoeas, but this is not the case for hypopnoeas.1 On the other hand, inductive plethysmography provides information on thoracoabdominal movements and amplitude but gives no information on inspiratory flow. Furthermore, its reliability depends on the accuracy of the calibration procedures. Nasal pressure measured with nasal prongs has recently been proposed as a useful way for measuring ventilation and has been integrated in ambulatory screening devices.2 Decreases in nasal pressure can correspond to an apnoeic/hypopnoeic event but could also result in a shift from nasal to mouth breathing. The consequences of these events on sleep variables have not been explored and, to our knowledge, the analysis of nasal pressure tracing has not been compared with that of conventional methods. The aim of the present study was to compare different methods of analysis of sleep related breathing disorders using thermistry, inductive plethysmography, and nasal pressure tracings.
Methods
Two hundred and twelve consecutive patients of mean (SD) age 50 (11) years, neck circumference 42 (4) cm, and body mass index (BMI) 32.1 (6.1) kg/m2 referred to the Sleep Laboratory for a baseline sleep recording were included in the study. Each subject had been evaluated in the Sleep Clinic and the consulting pneumologist had requested a sleep recording. No selection criteria were applied. The recording consisted of continuous electroencephalography (C4 A1, C3 A2, O2 A1), electro-oculography, submental and anterior tibialis electromyography, electrocardiography, and measurement of combined oronasal flow with thermistors placed in front of the nares and the mouth (ONT 2, Grass Instruments, Astromed, Longueuil, PQ, Canada), nasal pressure with nasal prongs (nasal oxygen cannula, Baxter, Valencia, California, USA or nasal CO2sample line, Ohmeda, Madison, Wisconsin, USA) connected to a pressure transducer (Validyne MP 45±100 cm H2O), thoracoabdominal movements with inductive plethysmography (Respitrace, Ambulatory Monitoring, Arsdley, New York, USA) calibrated with the isovolume method,3 arterial oxyhaemoglobin saturation with an ear oximeter (504 pulse oximeter, Criticare Systems, Waukesha, Wisconsin, USA), and breathing noises with two microphones placed at the head of the bed.4 In 104 subjects an oesophageal balloon catheter was positioned after local anaesthesia to measure inspiratory efforts.
SLEEP STAGING
Sleep and breathing were manually scored in epochs of 30 s. Sleep stages and arousals were scored according to conventional methods.5 ,6 The diagnosis of periodic leg movement (PLM) was considered when the frequency of leg movements associated with arousals was >5/h.
BREATHING ABNORMALITIES
The diagnosis of SAHS was made when the apnoea + hypopnoea index (AHI) was >15/h. Each recording was interpreted three times by the same technician using one of the three scoring methods, and the technician was blind to the results of the breathing analysis made by the other scoring criteria. Breathing abnormalities were identified by three different methods:
Conventional (for our sleep laboratory)
An apnoea was defined as the absence of oronasal flow on the thermistor signal for ⩾10 s and an hypopnoea as a 50% decrease in the sum signal of inductive plethysmographic tracing of ⩾10 s associated with an arousal and/or a 2% decrease in Sao 2.
Thermistor signal alone
Since the thermistor signal is qualitative, this analysis is usually not used in our laboratory but it was performed to compare its diagnostic value with that of other methods. Apnoeas were defined as in the conventional analysis. A hypopnoea was defined as a 50% decrease in the thermistor signal of ⩾10 s associated with an arousal and/or a 2% decrease in Sao 2.
Nasal cannula signal alone
Interpretations were the same as for the thermistor signal but using the nasal pressure signal obtained from the nasal cannula. The definition of these events was made on the amplitude of the nasal pressure signal, not taking account of changes in the shape of the signal. We are aware that the absence of nasal pressure may indicate a shift from nasal to mouth breathing. However, for simplicity, the denomination of these events (apnoea, hypopnoea) was kept the same as that used with other methods of interpreting breathing abnormalities.
STATISTICAL ANALYSIS
Since the aim of the study was to compare two different methods of measuring breathing (thermistry and nasal pressure) with the one conventionally used in our laboratory, individual values of apnoea and apnoea + hypopnoea indices obtained by the conventional method were compared with each of the other two by a pairedt test. Agreement and bias between the results obtained by the different methods were assessed according to the Bland and Altman method.7 The diagnostic value of the two non-conventional scoring analyses was compared with the conventional method using the χ2 test, a p value of <0.05 being considered statistically significant.
Results
Impaired nasal ventilation at the time of the recording prevented adequate measurements of nasal pressure in 19 subjects. The results of the remaining 193 patients are therefore presented. According to conventional interpretation 107 subjects were suffering from SAHS, eight from PLM, and 78 were considered to be non-apnoeic snorers or to have upper airway resistance syndrome.
As expected, there was no difference in the apnoea index between the conventional method of analysis and thermistry (11.6 (18.8)/h and 11.9 (19.3)/h, respectively). However, the frequency of hypopnoeic events was underestimated by thermistry, the mean difference between the two methods being 4.6/h (95% CI 3.6 to 5.6), p<0.001 (fig 1). This accounted for the significant underestimation of the AHI using the thermistor signal compared with conventional analysis (mean difference –4.3/h, 95% CI –5.3 to –3.2, p<10–4) and for the low sensitivity (75%) and high specificity (98%) of thermistor analysis alone for the diagnosis of SAHS.
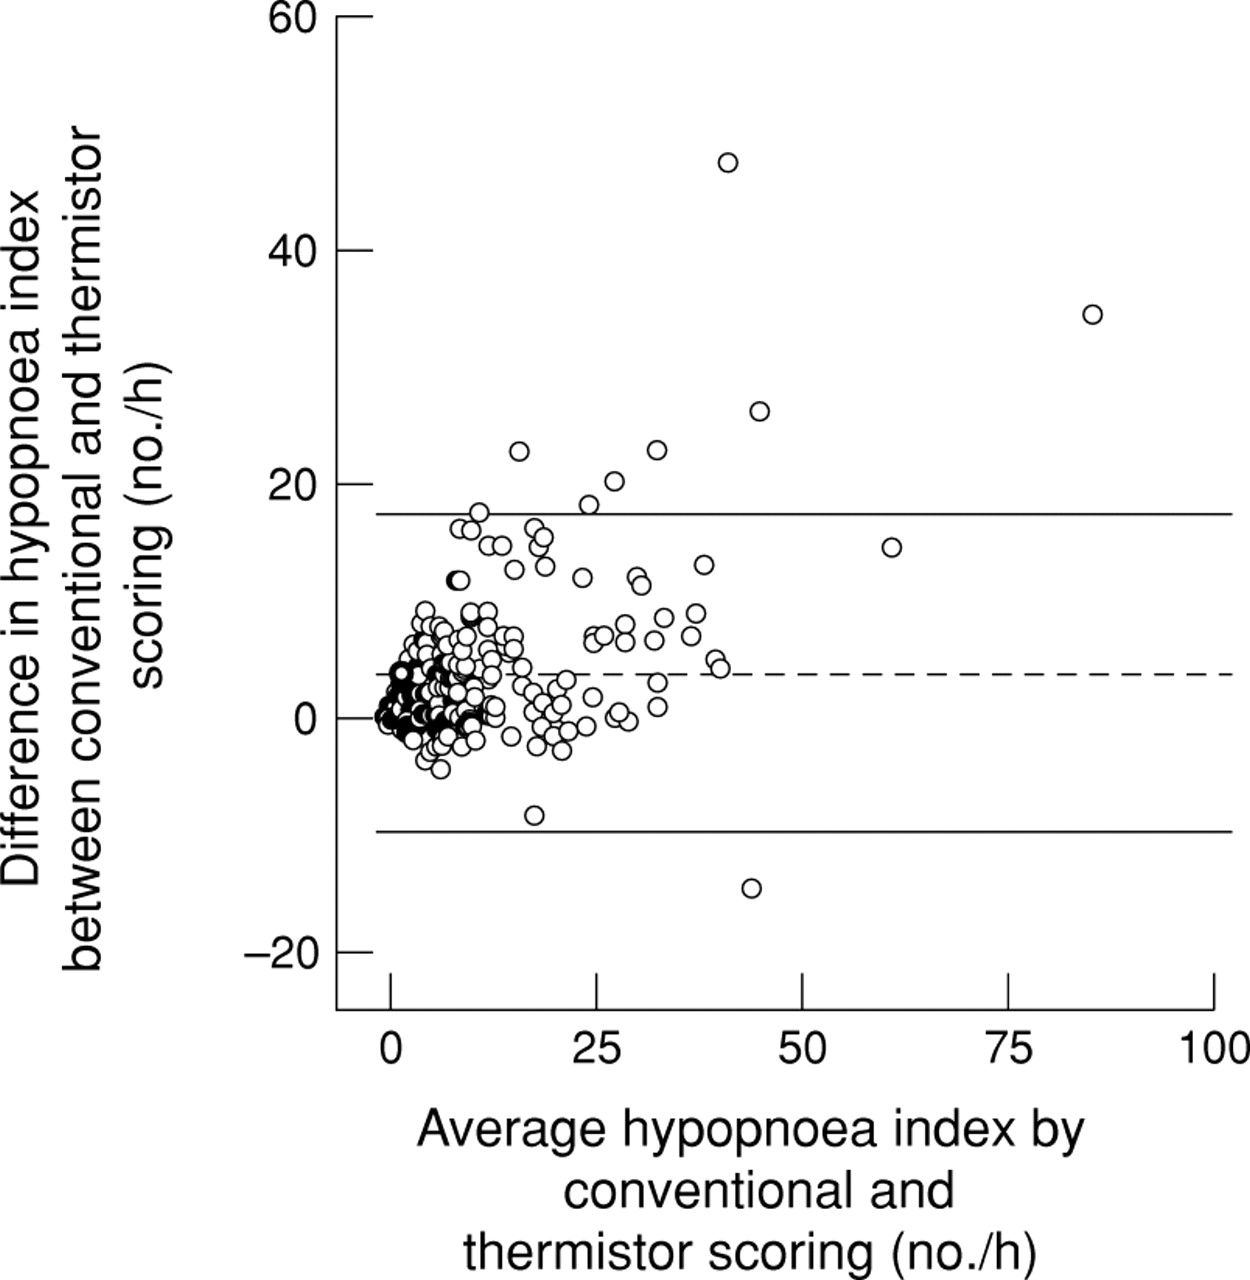
Bland-Altman plot of the difference in hypopnoea index between conventional analysis and thermistry alone against the mean value obtained with these two scoring methods. The middle line represents the mean difference and the lines on either side are the 95% confidence intervals. The hypopnoea index is significantly underestimated by thermistor scoring.
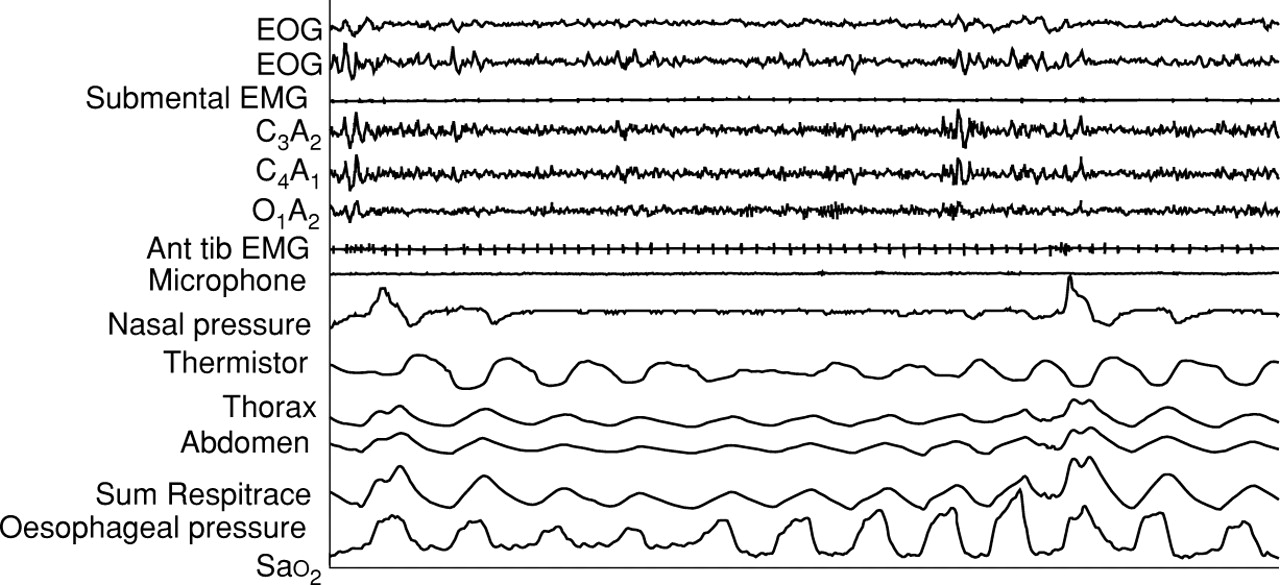
Dramatic changes in nasal pressure signal were observed in most of our subjects. Conventional apnoeic events defined by the absence of oronasal flow were always identified by the changes in the pressure signal. However, the nasal cannula signal could fall, suggesting an apnoeic event, even if persistent ventilation was observed on the thermistor and Respitrace signals. This could represent classical hypopnoeas according to conventional analysis criteria (fig 2) and 39% of conventional hypopnoeic events were scored as apnoeas using the nasal pressure method of scoring (table 1) which accounts for the significantly higher apnoea index obtained with the nasal cannula. The mean difference in apnoea index between conventional and nasal pressure scoring was –7.5/h (95% CI –8.9 to –6.1), p<0.001 (fig 3).

Sixty second recording of two apnoeic events recorded by nasal pressure tracing and typical hypopnoeic abnormalities on thermistor and Respitrace signals. Inspiratory efforts increase during the course of breathing disorders and return to normal with the occurrence of an arousal.
Number of abnormal respiratory events identified by the conventional and nasal pressure scoring methods

Bland-Altman plot of the difference in apnoea index between conventional and nasal pressure analysis against the mean value obtained with these two scoring methods. The middle line represents the mean difference and the lines on either side are the 95% confidence intervals. The apnoea index is significantly underestimated by conventional signal analysis.
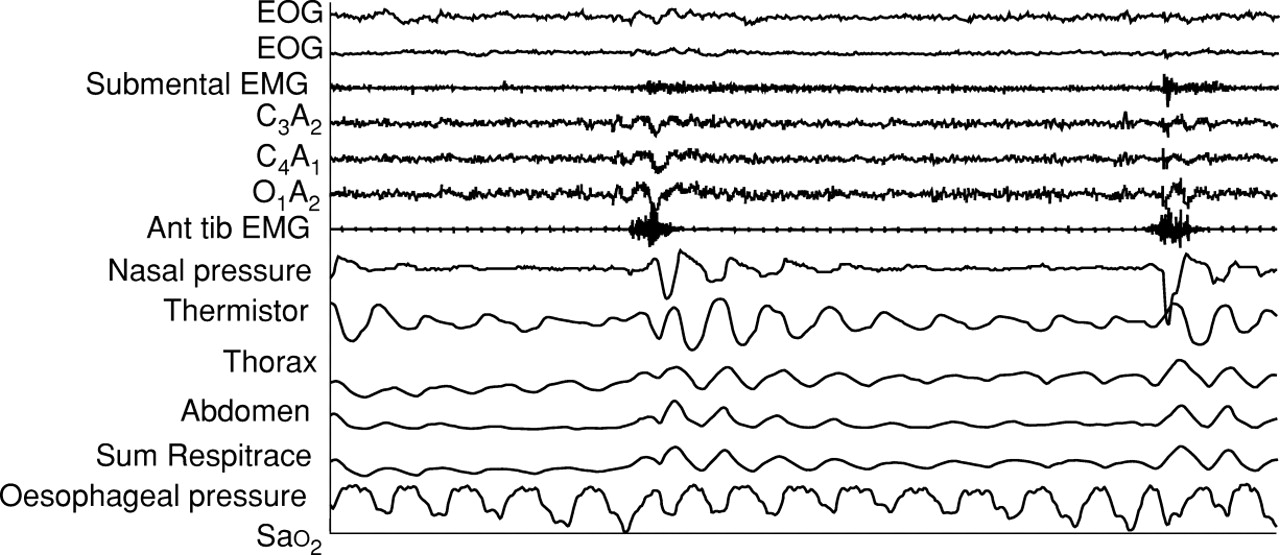
Apnoeic and hypopnoeic events identified by nasal pressure scoring could also be observed without any change in the thermistor and sum Respitrace signals (fig 4) which resumed with the occurrence of arousals or awakenings. These abnormal events corresponded to a shift from nasal to mouth breathing, as suggested by the persistence of respiratory flow on the thermistor signal and by the increase in breathing sounds for the last three breaths before ventilatory resumption; these nasal pressure events were associated with a progressive increase in intrathoracic pressure that confirms their obstructive nature (fig 4). The AHI was significantly higher with nasal pressure scoring than with the conventional method (mean difference 4.5/h, 95% CI 3.4 to 5.6, p<10–4). Compared with conventional analysis of nocturnal breathing nasal pressure scoring was therefore highly sensitive (99%) but its specificity was only 78%. However, these diagnostic characteristics should be cautiously interpreted since nasal pressure scoring could identify true breathing abnormalities that might be missed by conventional methods.
Sixty second recording of a typical apnoeic event recorded by nasal pressure tracing; no changes are seen in the thermistor and Respitrace signals. Nasal ventilation and inspiratory efforts returned to normal with the occurrence of an arousal.
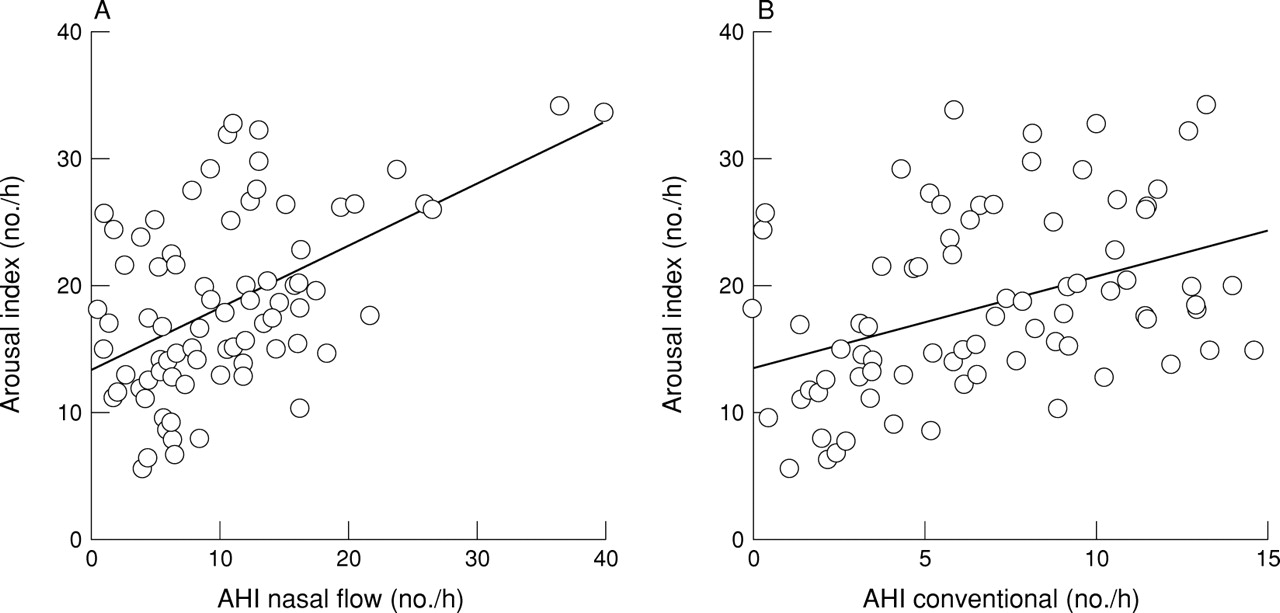
We therefore looked at the relationship between the arousal index and AHI determined by nasal pressure and conventional analysis in the 78 patients who were not classified as having SAHS according to conventional analysis. In this group the AHI measured by nasal pressure tracing was significantly higher than that obtained by the conventional method (mean difference 5.0/h, 95% CI 3.3 to 6.7, p<10–4). There was a significant positive relationship between the arousal index and AHI measured by the nasal pressure method (R = 0.51, p<10–4) and by the conventional method (R = 0.37, p = 0.003), although considerable scattering was observed (fig5).
Relationship between arousal index and individual values of the apnoea hypopnoea index (AHI) obtained by (A) nasal pressure tracing and (B) conventional analysis in patients considered to be non-apnoeic by the conventional method of interpretation. R2 = 0.26, p<10–4 (AHI by nasal pressure tracing vs arousal index); R2 = 0.12, p = 0.003 (AHI by conventional analysis vs arousal index).
Seventeen of the 78 patients had an AHI of >15/h with the nasal cannula method. The arousal index of these subjects was significantly higher than that of the other 61 (mean difference –5.4/h, 95% CI –9.1 to –1.7, p = 0.004).
Discussion
Our results indicate that the analysis of the thermistor signal alone cannot accurately score hypopnoeic events and that nasal pressure analysis is a simple and useful way to identify nocturnal breathing abnormalities.
In 35% of recordings the attending technician had to reposition the nasal catheter at least once (this percentage includes the 9% failure rate). Such repositioning is usually required in only 5% of studies in our sleep laboratory. Nasal pressure analysis was not possible in 9% of subjects due to impaired nasal ventilation (exclusive mouth breathing during the sleep recording). It must be emphasised that these patients did not complain of fixed nasal obstruction. We are aware that this failure rate is only indicative of the breathing characteristics of our patients, but it indicates that nasal pressure tracing is highly dependent on technical recording conditions and that the breathing route may interfere with the validity of the results obtained by this method. Since repositioning the nasal prongs would not have been possible outside the sleep laboratory and would have led to loss of the signal, caution should be exercised before assessing the value of nasal pressure recording in the diagnosis of SAHS outside sleep laboratories.
It can be argued that the identification of hypopnoeas could be improved with conventional methods by using different abnormal thresholds for thermistors and inductive plethysmography instead of uniform definitions for each of them. In the present study we chose apnoea and hypopnoea scoring criteria that are largely used in the literature, and our results show that nasal pressure tracing may have some advantages over the conventional method of analysis; furthermore, the scoring of nasal pressure tracing alone using one abnormal threshold may be easier than one that uses several parameters for interpretation.
As previously reported by Gugger et al, we found that nasal pressure analysis yields a higher apnoea index than conventional thermistry. This can be explained by the fact that some of the events counted as apnoeas by the nasal pressure method were caused by a shift from nasal to oral ventilation and were not true apnoeas. In our study these breathing disorders scored by nasal pressure recording were associated with an increase in inspiratory effort, sometimes desaturations, and disappeared on arousal or awakening. We therefore believe that these changes in the nasal pressure signal correspond to true obstructive breathing disorders and have to be counted in the AHI. However, since these breathing abnormalities do not always correspond to oronasal cessation, they should be better classified as respiratory disturbances without reference to apnoea or hypopnoea.
An important advantage of this method is that it provides quantitative data without the need for the patient’s collaboration in the calibration procedure. It has recently been reported that instantaneous ventilation is not linearly correlated with nasal pressure but best fits with the square root of nasal pressure measured with nasal prongs.8 The amplitude of breath-by-breath ventilation may therefore have been underestimated during hypopnoeic events and overestimated during hyperpnoeic events. This could have had two consequences: (1) some near apnoeic events could have been scored as hypopnoeas if we had analysed the square root of nasal pressure (this distinction is purely theoretical since the AHI would remain the same), and (2) the amplitude of the post-apnoeic/hypopnoeic ventilation period may have been overestimated and consequently the threshold for hypopnoeic events (50% decrease in the signal amplitude) may have been reached earlier. This could have led to an overestimation of the hypopnoea index. However, two-thirds of the breathing disorders identified by the nasal pressure tracings were apnoeas whose definition does not depend on baseline ventilation. Furthermore, as previously discussed, our definition of hypopnoea requires the presence of arousal and/or desaturation, and the identified hypopnoeas were associated with sleep fragmentation and hypoxaemia. We are therefore confident that the breathing abnormalities identified by nasal pressure tracing represent clinically significant breathing disorders.
Our results show that breath-by-breath nasal pressure recording adds significant additional information to the conventional method of analysis. Of our study population, 9% were diagnosed as having SAHS using nasal pressure tracing who would otherwise have been missed. These subjects may have upper airway resistance syndrome9; their pressure tracings were characteristic of flow limitation with a plateauing of nasal pressure despite an increase in inspiratory efforts. In this regard we believe that the interpretation of the nasal pressure signal dramatically improves the diagnostic value of sleep recordings.
We conclude that nasal pressure recording provides a simple and reliable measurement of nocturnal breathing abnormalities, and that analysis of nasal pressure tracings may identify breathing abnormalities associated with arousals that are missed by other methods.
Acknowledgments
Supported by Medical Research Council of Canada Grant MT 13768.