Article Text

Abstract
BACKGROUND The General Practice Research Database (GPRD) covers over 6% of the population of England and Wales and holds data on diagnoses and prescribing from 1987 onwards. Most previous studies using the GPRD have concentrated on drug use and safety. A study was undertaken to assess the validity of using the GPRD for epidemiological research into respiratory diseases.
METHODS Age-specific and sex-specific rates derived from the GPRD for 11 respiratory conditions were compared with patient consultation rates from the 4th Morbidity Survey in General Practice (MSGP4). Within the GPRD comparisons were made between patient diagnosis rates, patient prescription rates, and patient “prescription plus relevant diagnosis” rates for selected treatments.
RESULTS There was good agreement between consultation rates in the MSGP4 and diagnosis or “prescription plus diagnosis” from the GPRD in terms of pattern and magnitude, except for “acute bronchitis or bronchiolitis” where the best comparison was the combination category of “chest infection” and/or “acute bronchitis or bronchiolitis”. Within the GPRD, patient prescription rates for inhalers, tuberculosis or hayfever therapy showed little similarity with diagnosis only rates but a similarity was seen with the combination of “prescription plus diagnosis” which may be a better reflection of morbidity than diagnosis alone.
CONCLUSIONS The GPRD appears to be valid for primary care epidemiological studies by comparison with MSGP4 and offers advantages in terms of large size, a longer time period covered, and ability to link prescriptions with diagnoses. However, careful interpretation is needed because not all consultations are recorded and the coding system used contains terms which do not directly map to ICD codes.
- computerised medical records
- General Practice Research Database (GPRD)
- Morbidity Survey in General Practice (MSGP4)
- general practice
- epidemiology
- respiratory diseases
Statistics from Altmetric.com
- computerised medical records
- General Practice Research Database (GPRD)
- Morbidity Survey in General Practice (MSGP4)
- general practice
- epidemiology
- respiratory diseases
Increasing numbers of general practices are using computers to store patient details for various administrative functions1 which could potentially be used to investigate patterns of morbidity and repeat prescribing for assessment of local needs.2 ,3 One problem is ensuring the quality of the data, which is usually assessed by looking at completeness of recording and the accuracy of diagnoses compared with a “gold standard”.2 However, interpretation of computerised databases also requires an understanding of the often complex ways in which data are recorded and of the limitations of observational data.4
In recent years the largest nationally recognised sources of information about consultations in primary care in England and Wales have been the Morbidity Surveys in General Practice (MSGP).5 The first three surveys were in 1955/6, 1971/2 and 1981/2. The fourth Morbidity Survey in General Practice (MSGP4)6 was designed to record data on all consultations during the period 1 September 1991 to 31 August 1992 from 60 practices covering 1% of the population of England and Wales. Diagnoses were coded using Read codes and these were mapped to ICD9 codes in published results. Socioeconomic data were collected for 83% of patients and this showed that the population covered was broadly representative of the general population, but under-representative of ethnic minorities and those living alone. Evaluation suggested that 96% of consultations in the surgery and 95% of home visits were recorded and that there was correct reporting in 93% of consultations.
There are several sources of computerised routine information on general practice morbidity and prescribing in England, but the largest is the General Practice Research Database (GPRD, formerly the VAMP database). This contains data from 1987 up to the present and in 1994 covered 5.6% of the population of England and Wales.7 The GPRD was designed to record all prescriptions issued, the indication for all new prescriptions, and all “significant” events such as consultations resulting in a referral and “events which the partner will require to be reminded of at a later date”8—for example, diagnoses such as cystic fibrosis and tuberculosis and information from hospital letters and coroners’ reports. There is no requirement to enter diagnoses for minor consultations or to record follow up consultations for chronic conditions unless the consultation leads to new treatment or to a referral. The diagnostic coding system used is OXMIS which can be cross-referenced to Read codes. None of the GPs supplying data to the GPRD took part in the MSGP4.
Not all practices using the VAMP medical practice software are included on the database (for inclusion practices must satisfy standard validation checks to ensure good capture of data).9Recording of consultations resulting in a prescription is good: a study looking at first time use of non-steroidal anti-inflammatory drugs suggested that the indication for first time prescribing was recorded in 96% of cases.9 The extent to which consultations not resulting in a prescription are recorded is less certain. A study in 1990 of psychoses in 11 practices using VAMP found that 95% of prescriptions, but only 73% of consultations, in the written notes were entered on the computer.10
The GPRD has potential advantages over the MSGPs in that a larger proportion of the population is covered, data are available year on year, and information on both consulting and prescribing is collected; this may be particularly valuable for assessing the primary care burden of illnesses such as wheezing illness in childhood which is not always labelled as asthma.
While the MSGP4 is a widely used source of epidemiological information, the use of the GPRD to date has mainly been for studies of drug use and drug safety.7 Few studies have commented on its validity. One of these11 used the GPRD to estimate the incidence of anorexia nervosa and bulimia nervosa detected by GPs and found on record review that the clinical diagnosis of GPs matched DSM-IV criteria for 60% of anorexia and 52% of bulimia nervosa cases. Another commented that the rates of congenital malformations recorded were similar to national statistics and a special study.12Only one paper has so far investigated the interpretation of GPRD data by a comparison with MSGP4.13 Good agreement with MSGP4 was reported for consultations for chickenpox and allergic rhinitis but GPRD rates for asthma and diabetes showed consultation rates “10–20% lower, depending on age”. The present study investigates the consistency of the GPRD with MSGP4 in more detail by comparisons of rates for 11 respiratory diseases including asthma and also makes within database comparisons of prescribing and diagnostic information for four respiratory conditions.
Methods
Age-specific and sex-specific patient consultation rates (measures of period prevalence) from the MSGP4 were compared with period prevalence rates for England derived from the GPRD for 11 respiratory diagnoses: asthma; hayfever or allergic rhinitis (referred to as “hayfever”); chronic bronchitis, emphysema, or obstructive airways disease excluding asthma (“COPD”); tuberculosis; pneumonia; acute bronchitis or bronchiolitis; chest infection or bronchitis not otherwise specified (“chest infection”); cystic fibrosis; sarcoidosis; fibrosing alveolitis; and pneumothorax.
MSGP4 patient consultation rates came from published data6supplemented by special analyses to separate pneumonia from influenza and to combine codes relating to COPD. GPRD period prevalence rates were defined as a retrospective assessment of the numbers of subjects (recurrent and incident cases) with a specific diagnosis recorded within the calendar year in question divided by the person years at risk during that period. A weighted average of rates for 1991 and 1992 was calculated by adding one third of the GPRD consulting rate for 1991 and two thirds of the GPRD consulting rate for 1992 to approximate most closely the time period covered by MSGP4. A weighted number of patients was calculated in the same way. Weighted averages were used for all diagnoses except hayfever where 1992 data were used (1992 was a year with an exceptionally high number of consultations for hayfever14 and, as most cases of hayfever occur in summer, this seemed the more appropriate).
For diagnoses of asthma, COPD, hayfever and tuberculosis, additional prescribing data for relevant treatments was obtained from the GPRD. Treatment for asthma and COPD was defined as any prescription from the British National Formulary (BNF) sections 3.1 to 3.3 inclusive (referred to as “inhalers”), treatment for hayfever as prescriptions from BNF chapters 3.4.1 plus 12.2 (“hayfever therapy”), and treatment for tuberculosis prescriptions from section 5.1.9 (“tuberculosis therapy”). Patient prescription rates, defined as the number of patients with any relevant prescription during the calendar year divided by the person years at risk during that period, were calculated for inhalers, hayfever therapy, and tuberculosis therapy. Rates for the combinations of “relevant therapy plus diagnosis” were also calculated for four categories: inhaler plus diagnosis of asthma but excluding patients who also had a diagnosis of COPD; inhaler plus diagnosis of COPD; hayfever therapy plus diagnosis of hayfever; tuberculosis therapy plus tuberculosis diagnosis. The “combination” rates were defined as the numbers of patients with both a relevant prescription within the calendar year in question and an associated diagnosis (recorded at any time before the prescription including previous years, or at the same time as the prescription, or at some time after the prescription up to the end of the calendar year) divided by the total patient years at risk for the period.
Our presentation focuses on the similarity or differences between the patterns of prevalence by age and sex as derived from the two data sources. Confidence intervals for rates were not calculated because the data sources referred to different populations and data were collected in different ways.
Results
Comparisons within the GPRD and between the GPRD and MSGP4 are discussed by disease category. Comparisons are presented by sex and age bands for more frequently occurring conditions (table 1) while total and sex-specific rates are presented for rarer conditions (table2).
Comparisons of age and sex-specific rates (expressed as numbers of patients per 10 000 patient years at risk) from the GPRD and MSGP4 for asthma; hayfever or allergic rhinitis; COPD excluding asthma; acute bronchitis or bronchiolitis and “chest infection”; and pneumonia. All GPRD rates are a weighted average of 1991 and 1992 figures except hayfever which relates to 1992 only
Comparison of total and sex-specific rates (expressed as numbers of patients per 10 000 patient years at risk) from the GPRD and MSGP4 for tuberculosis (TB), cystic fibrosis, sarcoidosis, fibrosing aleveolitis and pneumothorax. All GPRD rates are a weighted average of 1991 and 1992 figures
ASTHMA AND COPD
Within GPRD comparisons showed a striking difference in the patient inhaler prescription rates compared with diagnosis rates for asthma (fig 1) and for COPD (fig 2), which suggests that inhaler prescription was not a reasonable proxy for consultations for COPD and could only be used as a proxy for asthma in patients aged 16–44 years. Further analysis showed that COPD was the indication for inhalers in less than 2.5% of patients under 45 years, rising to 46% in those aged 75–84 years. Excluding patients with a diagnosis of COPD, 57% of the remaining patients prescribed an inhaler had received a diagnosis of asthma but this varied widely by age, rising from 39% of 0–4 year olds to 80% of 15–24 year olds then declining with age to 19% of those aged 85–99 years.
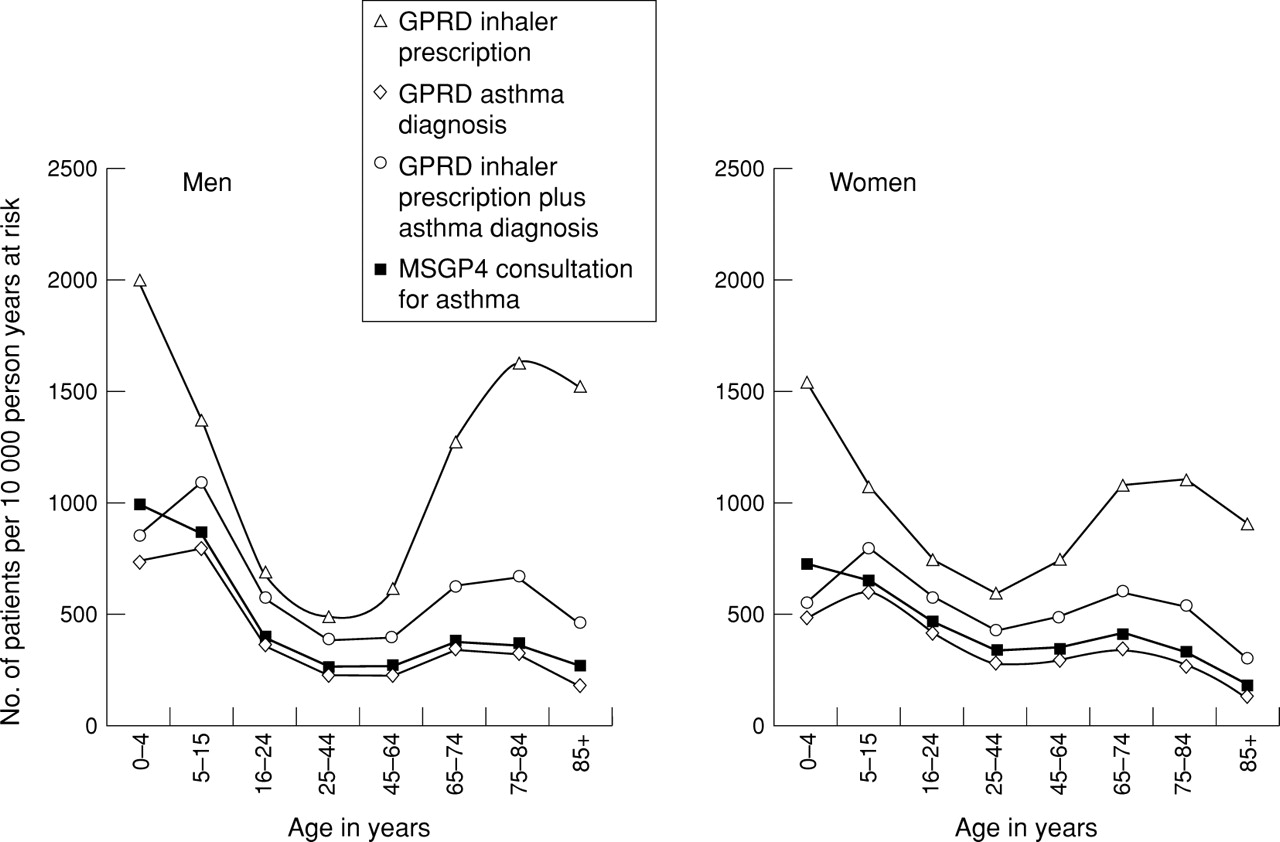
Asthma in GPRD and MSGP4.

COPD in MSGP4 and GPRD.
In general, GPRD diagnosis rates for COPD and asthma were similar to consultation rates seen in the MSGP4, while GPRD rates for inhaler plus diagnosis (of COPD or asthma excluding COPD) were slightly higher.
HAYFEVER
Again, a striking difference was seen between GPRD hayfever therapy rates and hayfever diagnosis rates with the greatest differences seen at the extremes of age (fig 3). Hayfever therapy as defined could therefore not be used as a proxy for hayfever prevalence. GPRD rates for “hayfever therapy plus diagnosis” were slightly higher than for diagnosis alone, and both categories were similar to MSGP4 consultation rates for allergic rhinitis.
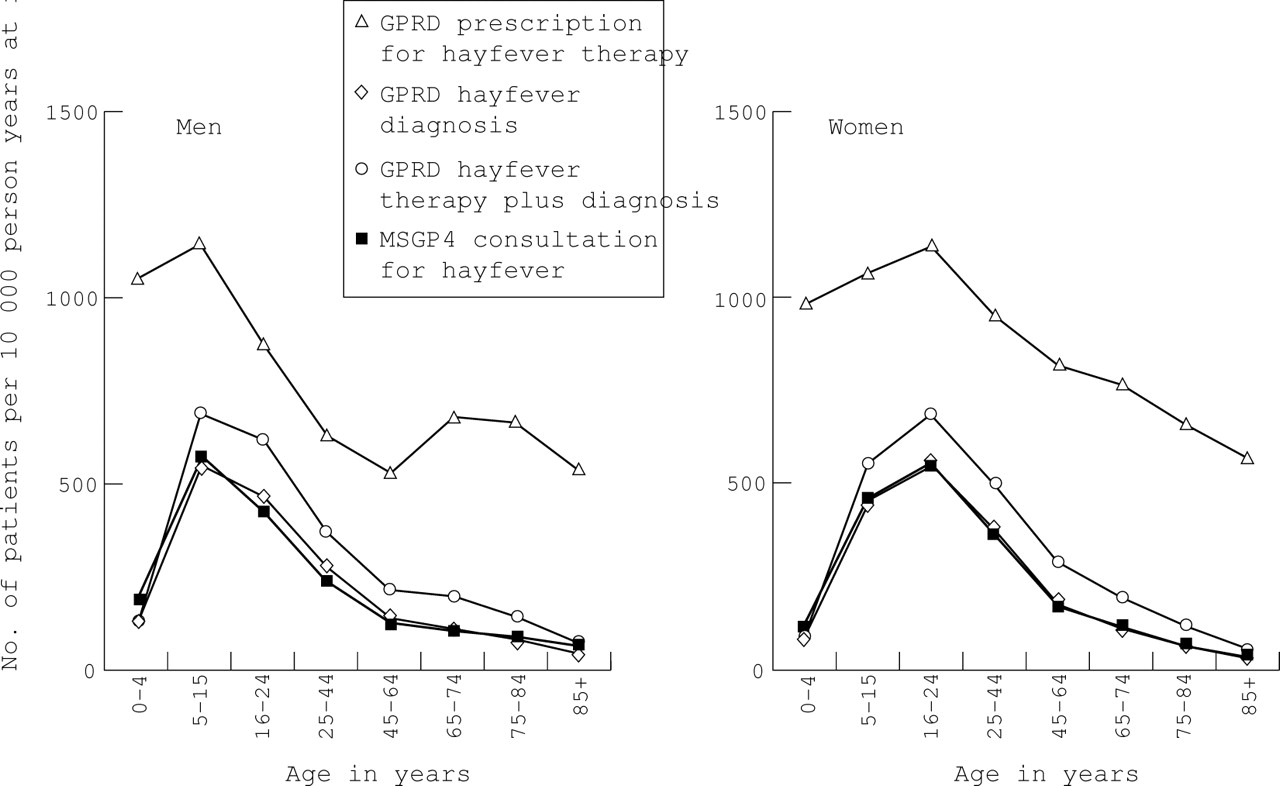
Hayfever in MSGP4 and GPRD.
PNEUMONIA
GPRD diagnosis rates for pneumonia were similar to MSGP4 consultation rates except in the elderly (85+) where GPRD rates were higher.
ACUTE BRONCHITIS OR BRONCHIOLITIS OR CHEST INFECTION
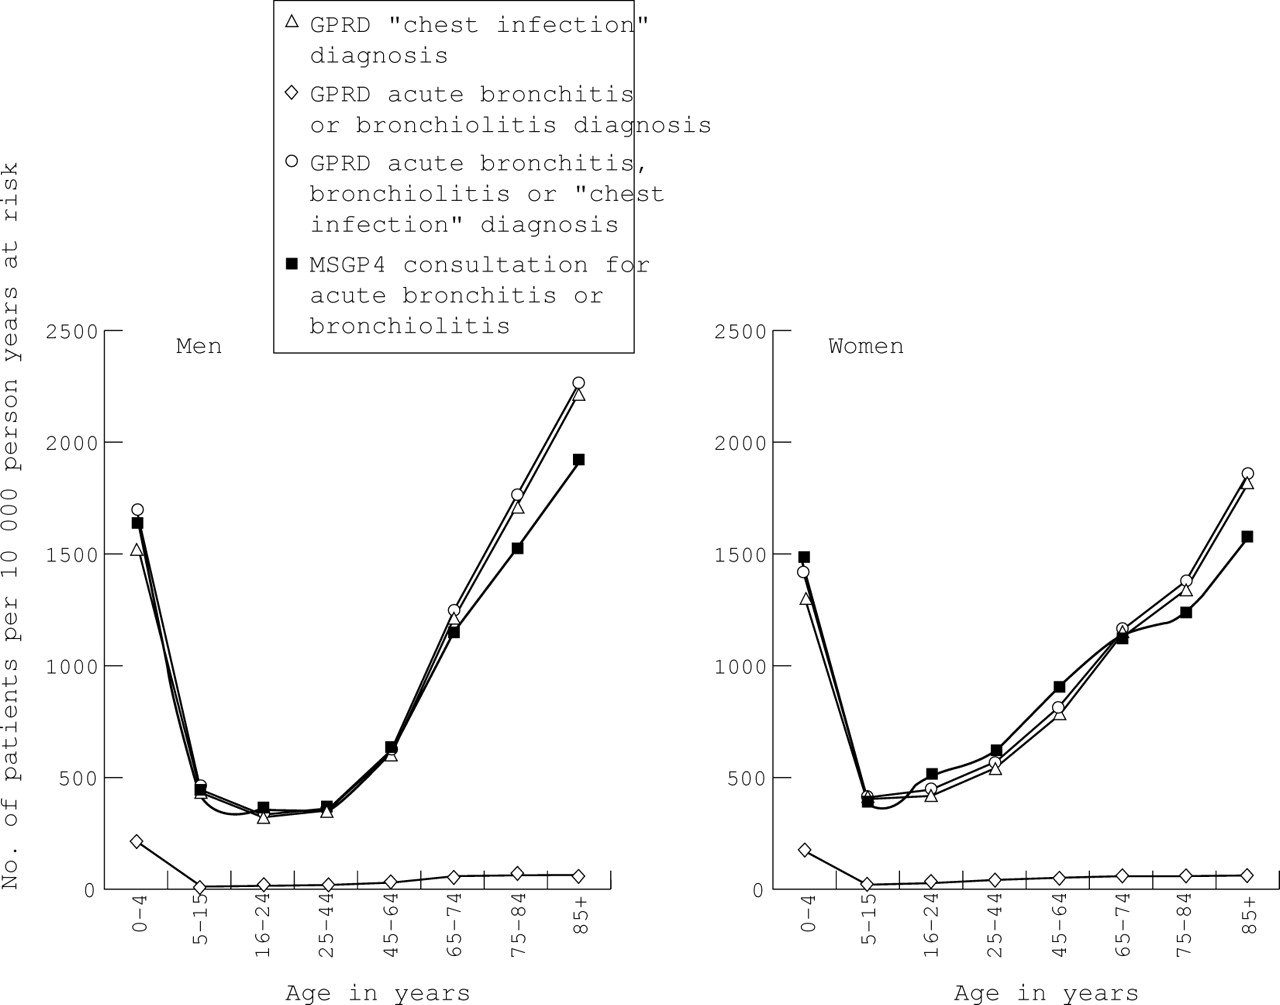
GPRD diagnosis rates for “acute bronchitis or bronchiolitis” were an order of magnitude lower and a different pattern from MSGP4 consultation rates for “acute bronchitis or bronchiolitis” (fig 4) and a different pattern from “bronchitis not otherwise specified” (ICD9 code 490)6 (not shown). GPRD diagnosis rates for “chest infection” were an order of magnitude higher than MSGP4 consultation rates for “bronchitis” or “pneumonia and influenza” (ICD9 codes 480–7),6 but there were some similarities with MSGP4 consultation rates for the common cold (ICD9 code 460) in children aged 0–15 years6(not shown). However, GPRD diagnosis rates for both “chest infection” and the combination category of “acute bronchitis or bronchiolitis” or “chest infection or bronchitis not otherwise specified” in GPRD showed a similar pattern and order of magnitude to MSGP4 consultation rates for “acute bronchitis or bronchiolitis”, particularly in those under 65 years of age (fig 4). In those aged over 65 years the GPRD rates were slightly higher than the MSGP4 rates; some of the discrepancy may be accounted for by the increased rates of diagnoses of “bronchitis not otherwise specified” (ICD9 490) in MSGP4 in these age groups.6

Acute bronchitis or bronchiolitis in MSGP4 and GPRD.
It is possible that the diagnosis “chest infection” as used in the GPRD could be more precisely coded as a number of other conditions, but the comparisons made suggest that most of these would have been coded as “acute bronchitis or bronchiolitis” in MSGP4.
TUBERCULOSIS (ALL SITES)
GPRD patient prescription rates for tuberculosis treatment were much higher than diagnosis rates, particularly in children aged 0–4 years, which suggests that prescription rates could not be used as a proxy for prevalence rates. In general, GPRD data showed slightly higher rates for diagnosis alone than for tuberculosis therapy plus diagnosis. There were close similarities between the rates for a diagnosis of tuberculosis in GPRD and in MSGP4 but small numbers were involved—in the GPRD the maximum number of patients in any age/sex group was 32.
CYSTIC FIBROSIS
On first analysis the GPRD recorded 23 women, but no men, aged 45–64 years with cystic fibrosis, which was inconsistent with the known epidemiology of the disease. Further manual review of records showed that a total of 57 women (of all ages) with fibrocystic disease of the breast had been miscoded as having cystic fibrosis. Using corrected figures, rates in both GPRD and MSGP4 were similar, based on small numbers of patients.
SARCOIDOSIS, FIBROSING ALVEOLITIS AND PNEUMOTHORAX
For all three conditions, consultation and diagnosis rates were similar in both the MSGP4 and GPRD, based on small numbers of patients.
Discussion
Despite different recording and coding requirements, GPRD rates of subjects with a diagnosis or prescription plus diagnosis closely approximated rates of subjects consulting for that illness in the MSGP4 for most respiratory diseases. For acute bronchitis or bronchiolitis the most appropriate comparison appeared to be between the combination category “acute bronchitis or bronchiolitis” or “chest infection” from the GPRD and the MSGP4 category “acute bronchitis or bronchiolitis”.
MISCLASSIFICATION
The misclassification identified in cystic fibrosis was probably related to the OXMIS coding scheme structure as both “cystic fibrosis” and “fibrosis cystic” are grouped together under a single code.
The diagnosis category “chest infection” in the GPRD presented a problem of interpretation as it was non-specific and involved a large number of patients. Misclassification of other diagnoses as “chest infection” could potentially have caused large biases in those conditions affecting smaller numbers of patients. Some overlap was identified: 49% of those with a diagnosis of chronic bronchitis, emphysema or obstructive airways disease (excluding asthma) also had a diagnosis of chest infection within the same year. Part of this may reflect the natural history of the diseases with a number of chest infections occurring prior to diagnosis, but this overlap group represented only 4.5% of patients with a diagnosis of chest infection. A large degree of misclassification is unlikely since GPRD rates seen for “chest infection” closely resembled the MSGP4 rates for consultations for “acute bronchitis or bronchiolitis”, while GPRD rates for other conditions closely approximated the MSGP4 rates.
RECORDING AND CODING DIFFERENCES
There are a number of reasons why the rates in the GPRD and MSGP4 might not be exactly the same—for example, recording requirements differ. MSGP4 data relate to all GP consultations while GPRD data relate to “significant” consultations and events and prescriptions issued. Paperless GPRD practices are likely to record more consultations than those who enter paper records into the database.
Another possibility for discrepancies between the rates is that the MSGP4 requires that definitive diagnoses should be recorded where possible. The GPRD does not have this requirement, so diagnoses recorded may reflect clinical practice more closely than MSGP4. For example, higher consultation rates for asthma in children aged 0–4 years in the MSGP4 than in the GPRD (fig 1) may reflect a greater readiness to label wheezing illness as asthma.
It is also possible that the prescription given will influence the diagnosis recorded in the GPRD—for example, if a patient with COPD consults with a chest infection and requires antibiotics they may be recorded as “chest infection”, but if a prescription for an inhaler is also required the most appropriate indication would be “chronic bronchitis”.
USE OF PRESCRIBING DATA
For asthma, COPD and hayfever, GPRD rates for therapy plus diagnosis were higher than diagnosis rates from both the MSGP4 and the GPRD and may better reflect the disease burden in primary care than diagnosis rates—for example, detecting patients with an exacerbation of COPD or asthma which is classified as “chest infection” and including repeat maintenance prescribing. In contrast, the rates for tuberculosis therapy plus diagnosis were lower than those with diagnosis alone. Explanations for this include the miscoding of BCG vaccinations, recording of information from death certificates, and patients whose tuberculosis treatment was not recorded in the GPRD because they were treated wholly as outpatients.
Patient prescription rates alone could not be used as a proxy for disease prevalence rates. Inhaler prescriptions alone were not a good proxy for either asthma or COPD, particularly at the extremes of age. The discrepancy between inhaler prescriptions and asthma diagnosis suggests that inhalers cannot be considered solely as asthma drugs and is consistent with other criticisms of the use of the overall steroid:bronchodilator ratio as a proxy for quality prescribing for asthma.15 In children it is possible that some of the difference between prescriptions and diagnoses represents wheezing due to lower respiratory tract infection such as bronchiolitis, and some relates to a reluctance to diagnose asthma until a clinical pattern is established.
The a priori definition of hayfever therapy was not a good measure of hayfever prevalence, probably because the category used was too broad, including nose drops which are prescribed for other reasons than hayfever. Tuberculosis therapy was not a good measure of the prevalence of tuberculosis, probably because of the use of rifampicin for meningitis prophylaxis and as a general antibiotic.
GENERALISABILITY
In 1991/2 the GPRD covered approximately 2.9% of the population of England while the MSGP4 covered 1% of the population of England and Wales. This study found that the GPRD rates were generally similar to those seen in the MSGP4. However, GPs in both the MSGP4 and GPRD volunteered to take part. Those who participated in the MSGP4 have been described as “different from the average of all practices in England and Wales”7—for example, there are fewer single handed GPs and principal doctors in these practices are younger than the average—and this may limit the generalisability of the rates. GPs involved in the GPRD are more representative than MSGP practices in terms of geographical spread and 17% of practices are single handed compared with 12% in the MSGP4 and 31% nationally (unpublished data).
Use of both the GPRD and MSGP4 for epidemiological analysis is likely to increase as CD-ROMs containing selected tables and/or datasets of anonymised patient records from both the MSGP416 and from the GPRD17 have recently become available. This comparative analysis required access to the full datasets, which is not available at the time of writing but release of a CD-ROM for the full MSGP4 dataset is forthcoming.
We conclude that the GPRD appears to be a valid source of epidemiological information on respiratory diseases. It has the potential to extend the analysis of primary care data offered by the MSGP4, due to its larger size, longer time period covered, wide geographical representation, and the ability to link prescriptions with diagnoses. However, careful interpretation of the data is necessary to make allowance for the way in which the information has been collected and coded.
Acknowledgments
The authors acknowledge Professor Ross Anderson (Department of Public Health Sciences, St George’s Hospital Medical School) for comments on an earlier draft of this paper. The views expressed in this paper are those of the authors and not necessarily those of the Department of Health.
Footnotes
Funding: Department of Health.