Article Text

Abstract
Background Hyperpolarised 3He MRI provides a way to visualise regional pulmonary functional abnormalities that in asthma are thought to be related to airway morphological abnormalities. However, the exact aetiology of ventilation defects in asthma is not well understood.
Objective To better understand the determinants of ventilation defects in asthma, we evaluated well-established clinical as well as 3He MRI and X-ray CT airway measurements in healthy subjects and subjects with asthma.
Methods Thirty-four subjects (n=26 subjects with asthma, n=8 healthy volunteers) underwent MRI, spirometry, plethysmography, fraction of exhaled nitric oxide analysis, methacholine challenge and CT for a region-of-interest proximal to ventilation defects. For subjects who consented to CT (n=18 subjects with asthma, n=5 healthy volunteers), we evaluated 3rd to 5th generation airway wall area and wall thickness per cent and lumen area.
Results Seventeen subjects with asthma (17/26=65%) had visually obvious evidence of 3He ventilation defects prior to bronchoprovocation and nine subjects with asthma had no ventilation defects prior to bronchoprovocation (9/26=35%). Subjects with asthma with defects were older (p=0.01) with worse forced expiratory volume in 1 s (FEV1)/forced vital capacity (p=0.0003), airways resistance (p=0.004), fraction of exhaled nitric oxide (p=0.03), greater bronchoprovocation concentration of methacholine that reduced FEV1 by 20% (p=0.008) and wall thickness per cent (p=0.02) compared with subjects with asthma without defects. There was a moderate correlation for wall area per cent with ventilation defect per cent (r=0.43, p=0.04).
Conclusions Subjects with asthma with 3He ventilation defects were older with significantly worse airway hyper-responsiveness, inflammation and airway remodelling but similar FEV1 as subjects with asthma without defects; hyperpolarised 3He ventilation abnormalities were spatially and quantitatively related to abnormally remodelled airways.
- Asthma
- Imaging/CT MRI etc
Statistics from Altmetric.com
Key messages
What is the key question?
-
In asthma, functional MRI using hyperpolarised 3He gas has been used to visualise abnormal and heterogeneous inhaled gas distribution. Regions of signal void or ventilation defects, are believed to correspond to areas of the lung that are not ventilated and such defects have been shown to change in response to bronchoprovocation and bronchodilators. Notwithstanding this previous work, our current understanding of the aetiology and clinical meaning of ventilation defects in asthma is still very limited.
What is the bottom line?
-
MRI and X-ray CT measurements of airway morphology and function were prospectively evaluated for healthy volunteers and subjects with asthma with and without ventilation defects. Seventeen subjects with asthma (17/26=65%) had visually obvious 3He ventilation defects; these subjects were significantly older, had significantly worse forced expiratory volume in 1 s/forced vital capacity, airways resistance, fraction of exhaled nitric oxide, and airway hyper-responsiveness, as well as more thickened airway walls and more narrowed airway lumen compared with nine subjects with asthma without ventilation defects.
Why read on?
-
We report the quantitative and spatial relationship between ventilation defects with remodelled airways and with well-established measurements of asthma severity, and that subjects with asthma with ventilation defects were older and had more advanced or severe disease. Taken together, these findings provide us with a better understanding of the differences between subjects with asthma with similar FEV1 and the clinical meaning of ventilation defects in asthma.
Introduction
Asthma is typically diagnosed and characterised using the spirometry measurement1 ,2 of the forced expiratory volume in 1 s (FEV1). Although relatively simple and inexpensive, spirometry measurements provide a global estimate of the morphological changes in the small and medium-sized airways that are believed to be related to luminal inflammation, airway remodelling and constriction. We now realise using multiple breath nitrogen washout studies3 ,4 and pulmonary imaging methods, that functional abnormalities in asthma are in fact regionally heterogeneous,5–7 temporally persistent8–10 and that these abnormalities regionally respond to bronchoprovocation7 ,11 ,12 and to bronchodilator therapy.11 ,13 Thoracic X-ray CT has been used for over a decade as a non-invasive method to investigate structure-function relationships of asthmatic airways and has shown strong relationships between CT-derived airway measurements with inflammation,14 ,15 spirometry14–21 and disease severity.14 ,16 ,20 ,22 However, while these CT data are encouraging, they are still somewhat limited because it is well recognised that CT cannot resolve or measure airways beyond the fifth or sixth generation. Moreover, even using new lower dose and iterative reconstruction methods,23 CT is not recommended for longitudinal studies and studies of young adults and children because of the potential risks associated with exposure to ionising radiation. Other pulmonary imaging methods such as nuclear medicine scintigraphy24–26 and positron emission tomography27 are also limited clinically because of inherently low spatial resolution.
Hyperpolarised 3He MRI has been previously used to visualise heterogeneous and abnormal gas distribution in asthma. Regions of signal void or ventilation defects have been shown to be temporally persistent8–10 and to correlate significantly with spirometry,6 ,28 ,29 disease severity6 and CT measurements of gas trapping.28 In addition, 3He MRI also provides a way to perform intensive serial measurements due in part to its excellent safety profile,30 and the speed with which imaging can be performed. More specifically, 3He MRI ventilation defects have been shown to increase from baseline following methacholine7 ,11 ,12 and exercise12 challenge, and decrease from baseline following salbutamol administration.13 In asthma, the relationship between ventilation defects and patient outcomes such as exacerbation frequency and severity has not yet been evaluated; however this has been evaluated in chronic obstructive pulmonary disease.31 Recently, there has been growing interest in the clinical application of hyperpolarised gas MRI to assess treatment efficacy and furthermore to guide localised airway treatments in asthma. Preliminary work in severe asthma has shown improved 3He gas distribution following localised bronchial thermoplasty treatment.32 While these results provide a strong foundation for the use of MRI in asthma research and patient care, a major drawback has been that we do not clearly understand the aetiology of MRI ventilation defects.33 It has been speculated that MRI ventilation defects reflect regional airway narrowing that may be the consequence of airway remodelling34; however, to our knowledge, the direct spatial and quantitative relationship between MRI ventilation defects and CT airway measurements has not been reported in patients with asthma. Therefore, our objective was to determine the underlying structural and clinical determinants of asthma ventilation abnormalities by evaluating well-established clinical and emerging imaging (hyperpolarised 3He MRI and CT) measurements in healthy volunteers and subjects with asthma.
Methods
Study subjects
All subjects provided written informed consent to a study protocol approved by the local research ethics board, and the study was compliant with the Personal Information Protection and Electronic Documents Act (Canada) and the Health Insurance Portability and Accountability Act (USA). Subjects were enrolled between 18 years and 60 years of age, including mild-to-moderate35 subjects with asthma, and healthy subjects with no history or diagnosis of asthma or any other chronic or current acute respiratory illness. Subjects with asthma were phenotyped from health records based on disease severity and symptoms from a tertiary care centre (interdisciplinary Allergy and Respirology asthma care centre); all subjects with asthma had a current physician diagnosis of asthma, were currently under treatment for asthma and had a positive methacholine challenge within the past 5 years. At a single visit, spirometry, plethysmography, fractional exhaled nitric oxide (FeNO) breath analysis and pulmonary CT was performed within 30 min of MRI.
Pulmonary function tests
Spirometry and plethysmography were performed according to American Thoracic Society Guidelines36 using an ndd EasyOne spirometer (ndd Medizintechnik AG, Zurich, Switzerland) and a MedGraphics Elite Series plethysmograph (MedGraphics, St Paul, Minnesota, USA), respectively. FeNO was measured using a Niox Mino (Aerocrine USA, New Providence, New Jersey, USA). Methacholine challenge was performed as previously described11 and the provocative concentration causing a 20% decrease in FEV1 (PC20) was determined. Borg and modified Medical Research Council dyspnoea scores were recorded.
MRI
MRI was performed on a whole body 3.0 T Discovery 750MR (General Electric Health Care, Milwaukee, Wisconsin, USA) system with broadband imaging capability, as previously described.37 Subjects were instructed to inhale a gas mixture from a 1.0 L Tedlar bag (Jensen Inert Products, Coral Springs, Florida, USA) from functional residual capacity, and image acquisition was performed in 8–15 s under breath-hold conditions. Conventional 1H MRI was performed prior to hyperpolarised 3He MRI, both methods are previously described.37
3He MRI were qualitatively and quantitatively evaluated for ventilation abnormalities by a single trained observer. Upon qualitative inspection, subjects with asthma were classified into two groups, (1) subjects with asthma with no ventilation defects (ND) and (2) subjects with asthma with ventilation defects (AD). If 3He gas was homogenously distributed throughout the lung and there were no visible ventilation defects the subject was classified as belonging to the ND group. In contrast, if 3He gas was heterogeneously distributed throughout the lung and/or there were visually obvious ventilation defects, the subject was classified as belonging to the AD group. Quantitative evaluation of 3He MRI was performed to estimate ventilation defect per cent (VDP) and ventilation heterogeneity using the coefficient of variation (COV). 3He MRI semiautomated segmentation was performed to quantify lung volumes using custom software generated using MATLAB R2007b (The Mathworks, Natick, Massachusetts, USA), as previously described.38 As shown in figure 1, 3He static ventilation images were segmented using a K-means approach that classified voxel intensity values into five clusters ranging from signal void (cluster 1 (C1) or ventilation defect volume) to hyperintense signal (cluster 5 (C5)) to create a gas distribution cluster map. 3He MRI VDP was generated using ventilation defect volume normalised to the thoracic cavity volume. Whole lung and regional VDP specific to the CT region-of-interest (ROI) were generated for each subject. Ventilation heterogeneity was estimated according to previously described methods7 using the COV. Briefly, a ventilated lung ROI was defined as gas distribution cluster-map clusters C2–C5. For each voxel within the ventilated lung ROI a local ventilation heterogeneity value was calculated by computing the COV of the signal intensity in the voxels 5×5 neighbourhood. Mean COV for each slice was calculated for each 3He static ventilation slice and then averaged to obtain a single COV value for each subject.

Schematic for 3He MRI—Regional CT image acquisition, coregistration and analysis. A region-of-interest (ROI) (green-yellow rectangle) with ventilation defects was located using 3He MRI. Following MRI, regional CT was acquired in that specific ROI. Ventilation defect per cent (VDP) was quantified for the whole lung and the CT-derived ROI and an automated airway tree segmentation algorithm was applied to obtain airway measurements. Using the carina and trachea as a landmark, the regional CT with rendered airways was rigidly coregistered with the corresponding MRI to confirm the spatial relationship between ventilation defects and corresponding airways.
CT
Following 3He MRI, thoracic CT was performed with the same inhalation breath-hold volume and manoeuvre used for MRI, in order to match CT and MRI lung volume and anatomy. CT imaging was performed in the supine position using a 64-slice Lightspeed VCT scanner (GEHC, Milwaukee, Wisconsin, USA) using a detector configuration of 64×0.625 mm, 120 kVp, 100 mA, 0.5 s gantry rotation, and a pitch of 1.25. To reduce the radiation dose, CT was obtained for a 4 cm axial ROI where there were visually obvious MRI ventilation defects. In the case where there were no visually obvious ventilation defects, the CT volume was acquired in the superior region of the lung. This approach resulted in CT volumes consisting of 32–80 slices and a total effective dose ranging from 0.37 to 0.14 m Sv (generated using the CT parameters and algorithm at http://www.impactscan.org).
CT image analysis was performed using Pulmonary Workstation V.2.0, (VIDA Diagnostics; Iowa City, Iowa, USA) to generate bronchial wall area per cent, wall thickness per cent and lumen area for all 3rd–5th generation segmental bronchi analysed and lumen area was normalised to body surface area.39 As shown in figure 1, an automated airway tree segmentation algorithm was applied with a manual seed-point in the airway lumen introduced if the trachea and main bronchus were not present in the image. For each subject, all airway segment measurements were averaged to report whole lung means. To identify potential spatial relationships between 3He MRI ventilation defects and corresponding airways, CT-MRI coregistration was performed using 3D Slicer registration software (http://www.slicer.org). 40
Statistical methods
Pulmonary function tests, MRI and CT measurements were compared between subject groups using unpaired Student t tests performed using SPSS V.20.0 (IBM, Armonk, New York, USA). Linear regression (r2) and Spearman rank correlation coefficients (r) were performed using GraphPad Prism V.4.00 (Graphpad Software, San Diego, California, USA). Results were considered statistically significant when the probability of making a Type I error was less than 5% (p<0.05).
Results
We enrolled 34 subjects including 26 subjects with a clinical diagnosis of asthma and previous methacholine challenge results consistent with asthma, and 8 healthy volunteers. Table 1 shows subject demographic data, pulmonary function measurements and dyspnoea scores for the two subgroups, and a subject listing of all data is provided in the online supplementary table S1.
Subject demographic characteristics for subjects with asthma and healthy volunteers
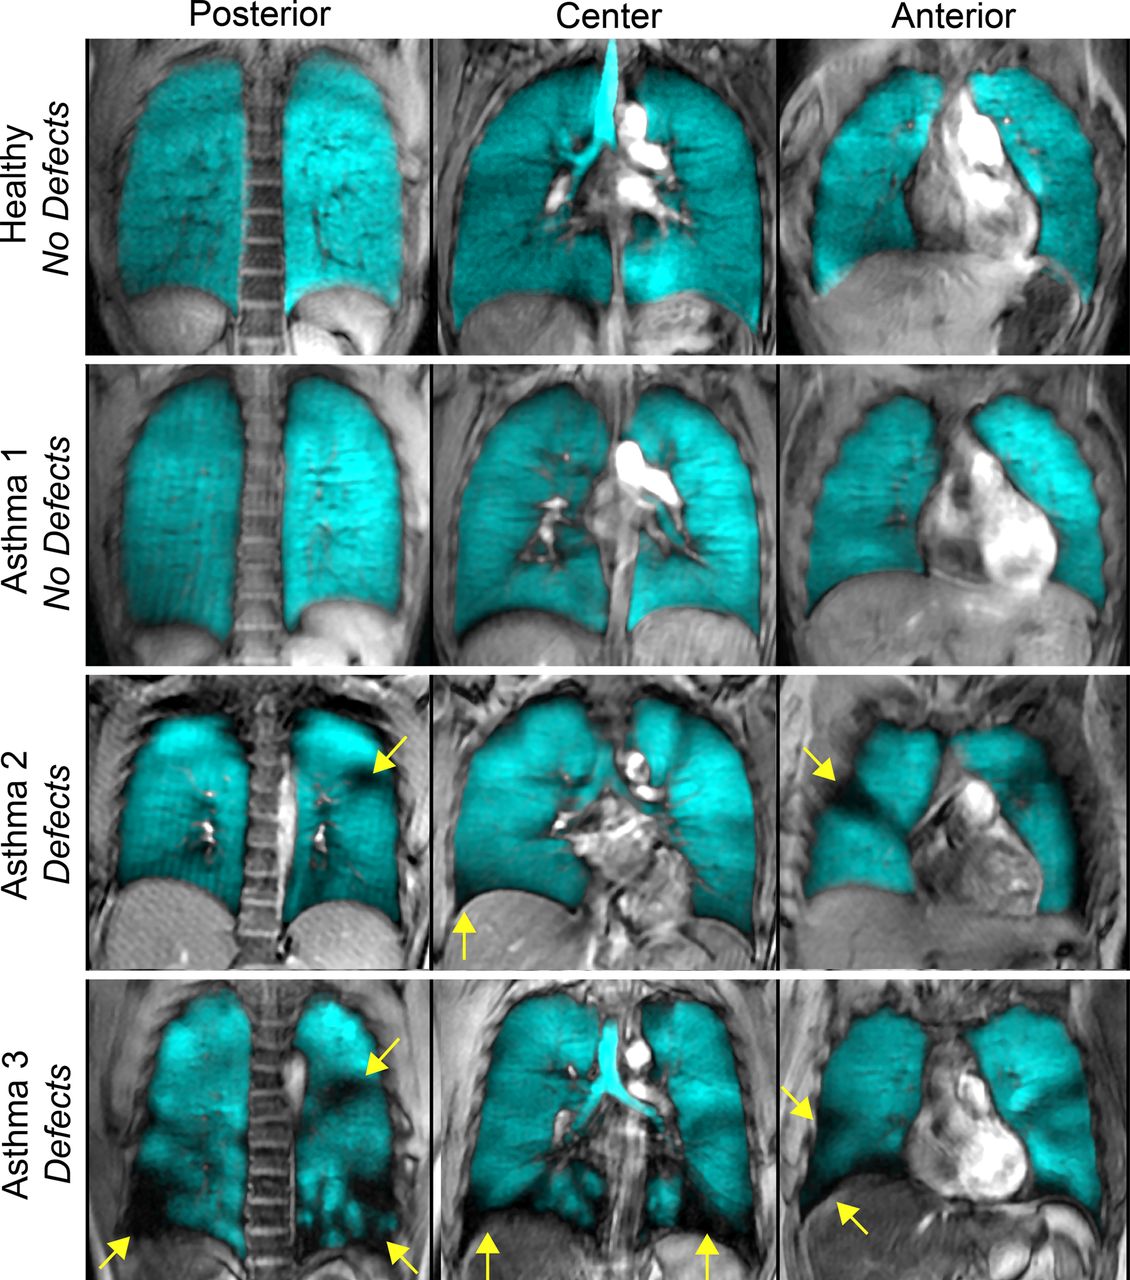
Upon qualitative visual inspection, 9 of the 26 subjects with asthma had ND and 17 had visually obvious AD. Figure 2 shows posterior, centre and anterior 3He MRI static ventilation coronal slices (in blue) coregistered to the 1H anatomical MRI (in grey scale) for a representative healthy volunteer as well as ND and AD subjects with asthma with yellow arrows identifying ventilation defects. For healthy volunteers and ND subjects with asthma, 3He gas was homogeneously distributed throughout the lung whereas in contrast, AD subjects with asthma had visually obvious ventilation heterogeneity and ventilation defects. Of the 8 healthy volunteers and 26 subjects with asthma evaluated, 2 healthy volunteers and 12 subjects with asthma underwent imaging across multiple time points ranging from 4 years prior, to 2 years following the study session reported here. In accordance with the study visit data presented here, healthy volunteers had NDs at their additional time point. All subjects with asthma who underwent multiple imaging time points were AD subjects with asthma and all of these subjects had ventilation defects at their additional time point and in the same spatial locations. Moreover, for all subjects with asthma with repeated imaging measurements (n=12), VDP was not significantly different (p=0.49) from measurements acquired and reported in this study.

Hyperpolarised 3He MRI of a representative healthy volunteer and subjects with asthma. 3He MRI gas distribution (in blue) registered to the 1H MRI of the thorax (in grey scale) for posterior, centre and anterior coronal slices for a representative healthy volunteer, a subject with asthma with no ventilation defects, and two subjects with asthma with ventilation defects. Yellow arrows identify ventilation defects. Healthy volunteer: 27 year-old woman, forced expiratory volume in 1 s (FEV1)=105%pred, FEV1/forced vital capacity (FVC)=85%, specific airways resistance (sRaw)=2.60 cmH2O s. Subject with asthma 1 No Defects: 23 year-old woman, FEV1=82%pred, FEV1/FVC=79%, sRaw=3.80 cmH2O s. Subject with asthma 2 Defects: 25 year-old woman, FEV1=87%pred, FEV1/FVC=69%, sRaw=5.36 cmH2O s. Subject with asthma 3 Defects: 42 year-old man, FEV1=72%pred, FEV1/FVC=65%, sRaw=13.85 cmH2O s.
As shown in table 2, AD subjects were significantly older than ND subjects (p=0.01) with significantly worse FEV1/forced vital capacity (FVC) (p=0.0003), specific airways resistance (sRaw) (p=0.004), FeNO (p=0.03), PC20 (p=0.008), COV (p=0.046), wall thickness per cent (p=0.02) and lumen area normalised to body surface area (p=0.04), but importantly there was no mean difference for FEV1 (p=0.08), FVC (p=0.71) or dyspnoea (modified Medical Research Council: p=0.79, Borg: p=0.12). As compared with healthy subjects, AD subjects had significantly worse FEV1 (p=0.001), FEV1/FVC (p=0.003), sRaw (p=0.003), PC20 (p<0.0001), COV (p=0.007), wall area per cent (p=0.001), wall thickness per cent (p=0.04) and lumen area normalised to body surface area (p=0.0003), but there was no significant difference for FVC (p=0.06). ND subjects had significantly worse FVC (p=0.04), PC20 (p=0.02) and wall area per cent (0.03) compared with healthy volunteers, but no significant difference for FEV1 (p=0.09), FEV1/FVC (p=0.36), sRaw (p=0.36), COV (p=0.11), wall thickness per cent (p=0.61) or lumen area normalised to body surface area (p=0.26).
Subject demographic characteristics, pulmonary function, hyperpolarised 3He MRI and X-ray CT airways measurements for subjects with asthma and healthy volunteers
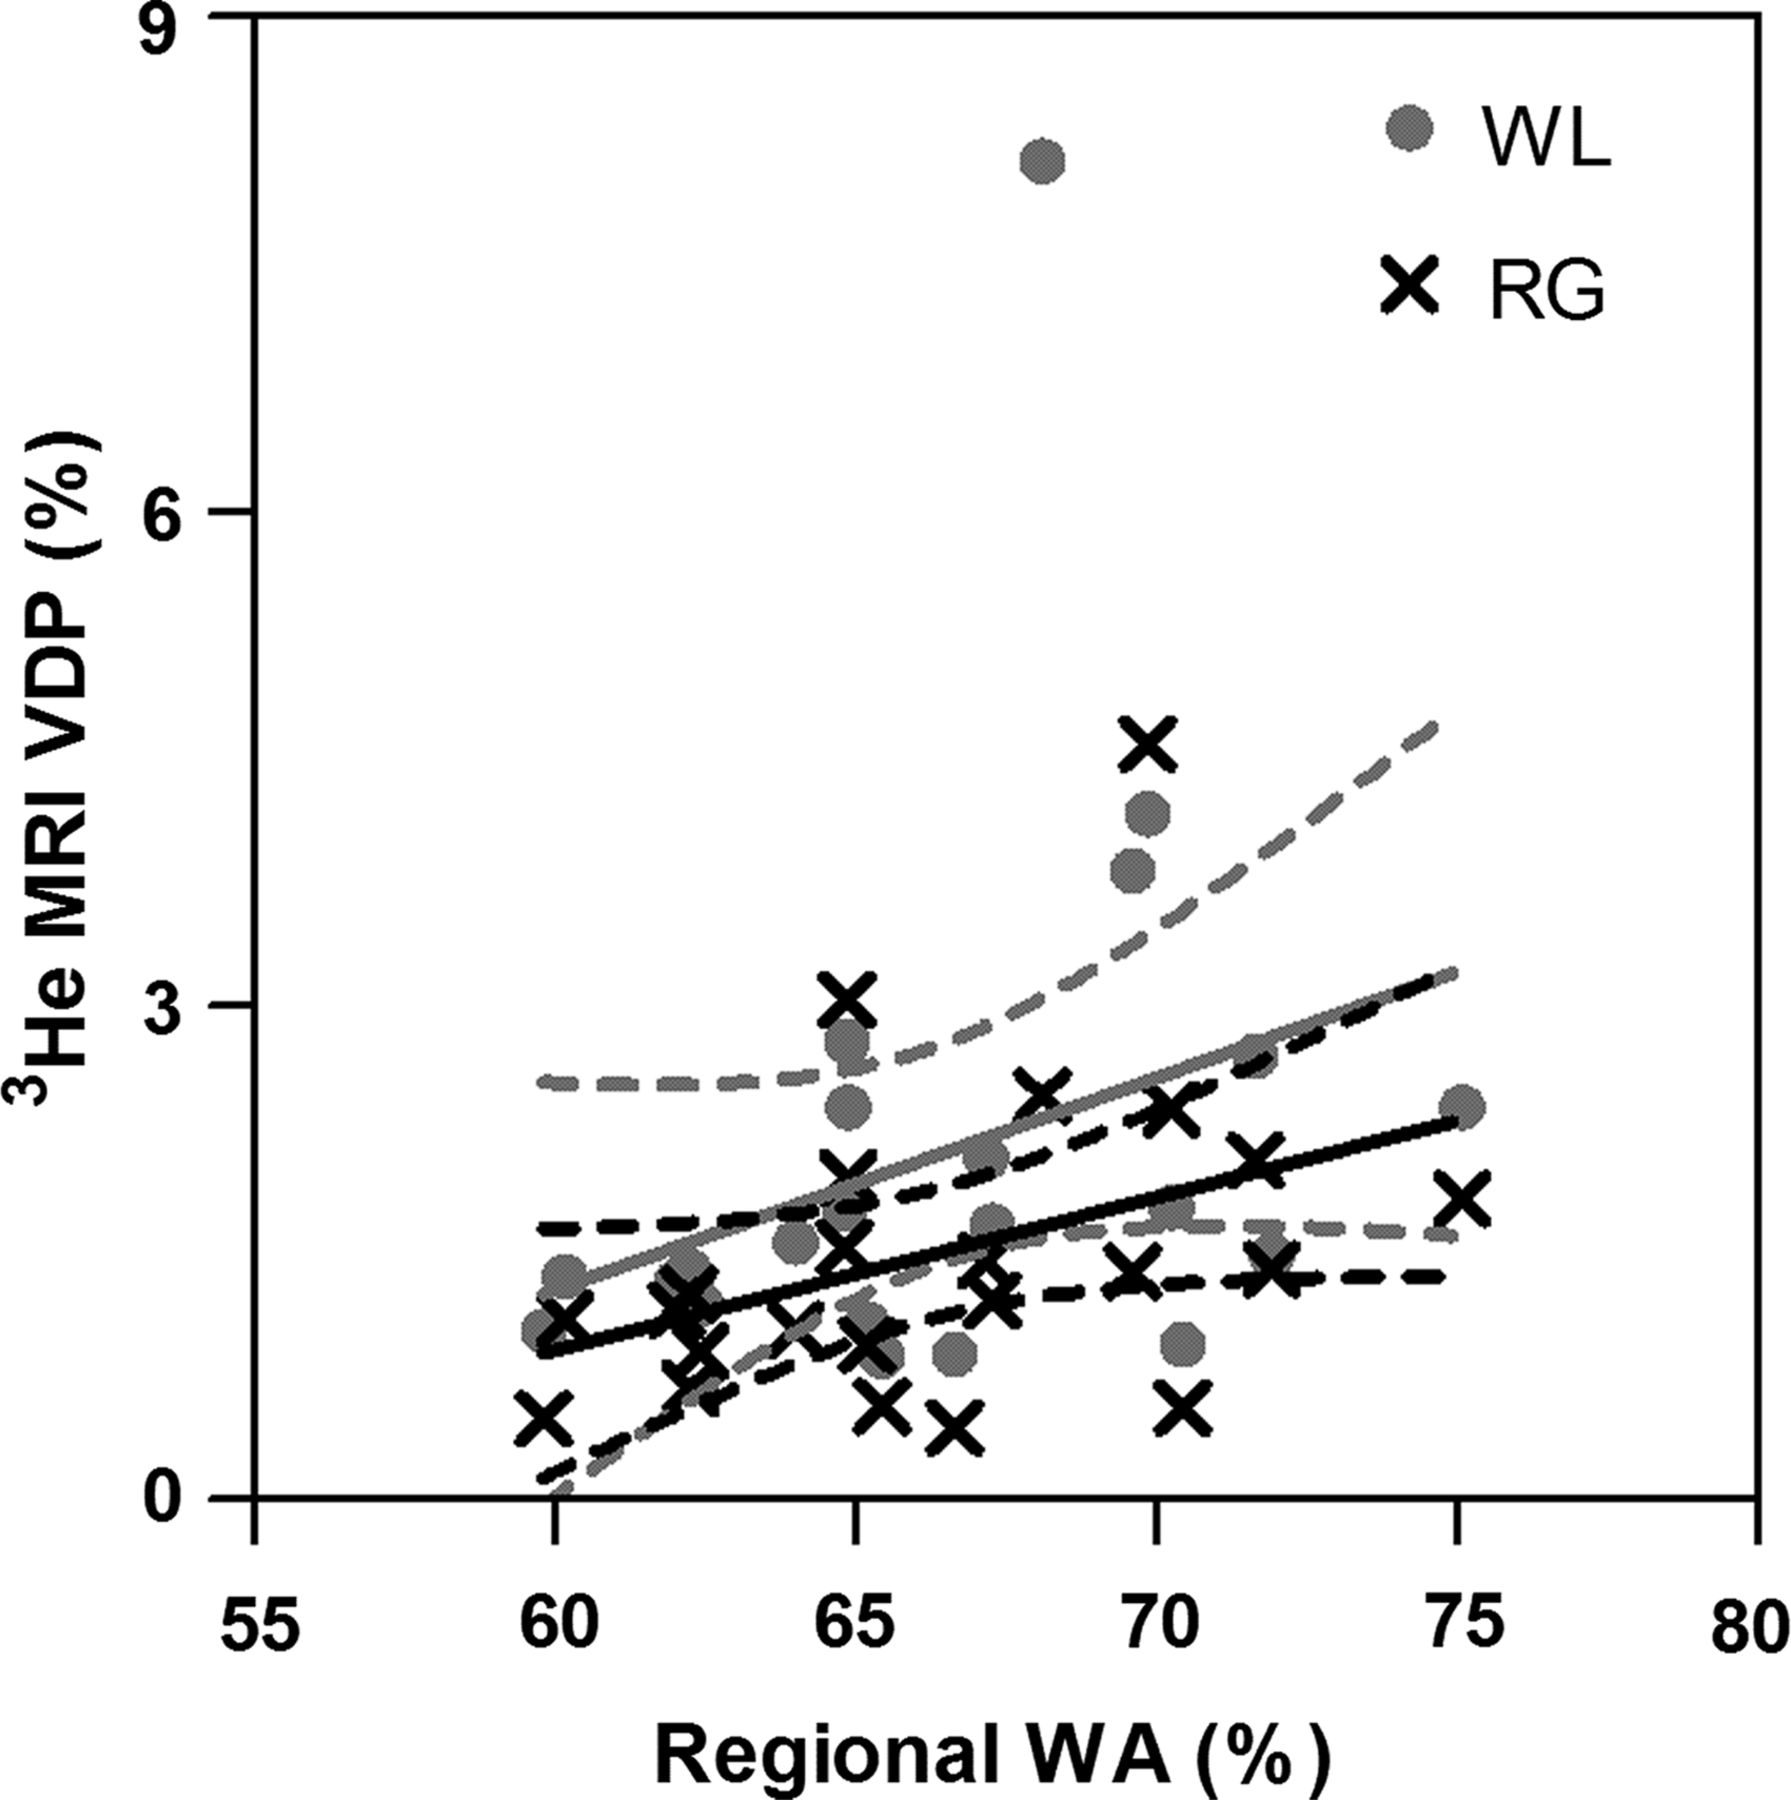
Figure 3 shows the correlations for FEV1 and sRaw with whole lung VDP, regional VDP and wall area per cent. FEV1 was significantly correlated with 3He MRI VDP (whole lung: r=−0.61, p=0.0002; regional: r=−0.55, p=0.006) and wall area per cent (r=−0.49, p=0.02). In addition, sRaw was significantly correlated with 3He MRI VDP (whole lung: r=0.77, p<0.0001; regional: r=0.81, p<0.0001) and wall area per cent (r=0.48, p=0.02). Additionally, FEV1 and sRaw were significantly correlated with whole lung 3He MRI COV (FEV1: r=−0.49, p=0.003; sRaw: r=0.59, p=0.0003). Figure 4 demonstrates that for all subjects wall area per cent was significantly correlated with whole lung (r=0.42, p=0.046) and regional VDP (r=0.43, p=0.04).
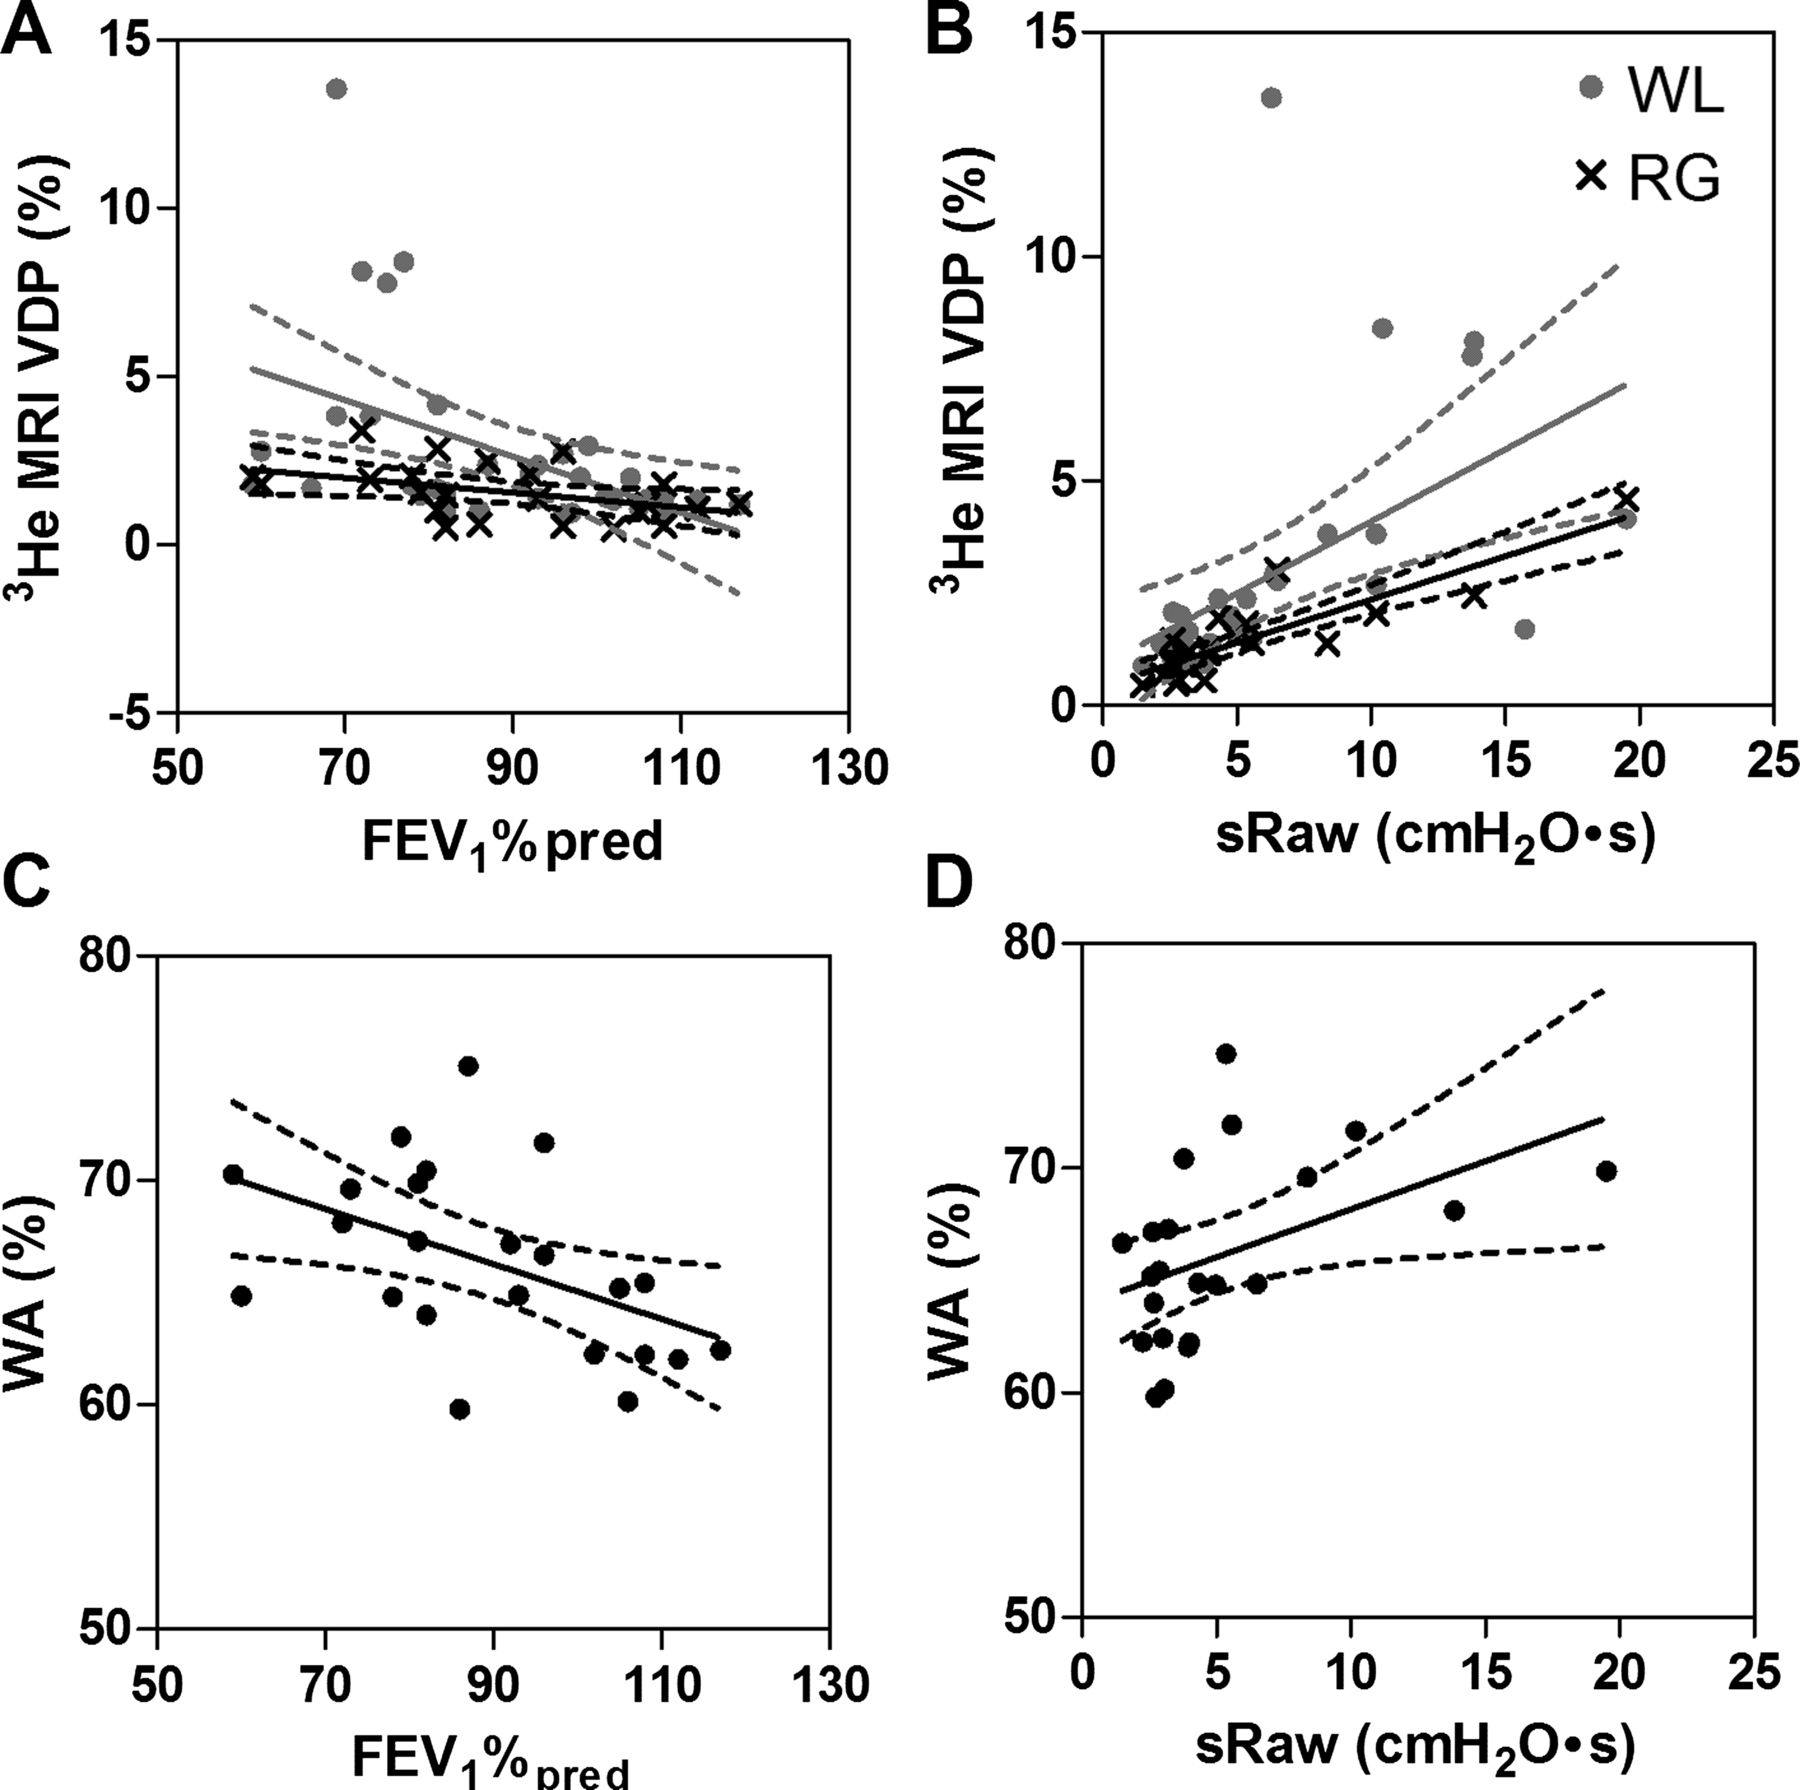
Relationships of MRI and CT measurements with forced expiratory volume in 1 s (FEV1) and airways resistance. (A) Negative relationship between 3He MRI ventilation defect per cent (VDP) and FEV1%pred (whole lung (WL): r=−0.61, r2=0.20, p=0.0002; regional (RG): r=−0.55, r2=0.26, p=0.006). (B) Positive relationship between 3He MRI VDP and specific airways resistance (sRaw) (WL: r=0.77, r2=0.62, p<0.0001; RG: r=0.81, r2=0.75, p<0.0001). (C) Negative relationship between wall area per cent (WA%) and FEV1%pred (r=−0.49, r2=0.23, p=0.02). (D) Positive relationship between WA% and specific airways resistance (sRaw) (r=0.48, r2=0.21, p=0.02).

Relationship between 3He MRI ventilation defect per cent (VDP) and CT-derived wall area per cent (WA%). WA% was significantly correlated with whole lung 3He MRI VDP (r=0.42, r2=0.11, p=0.046) and regional 3He MRI VDP (r=0.43, r2=0.15, p=.04). Dotted lines represent the 95% CIs of the regression line.
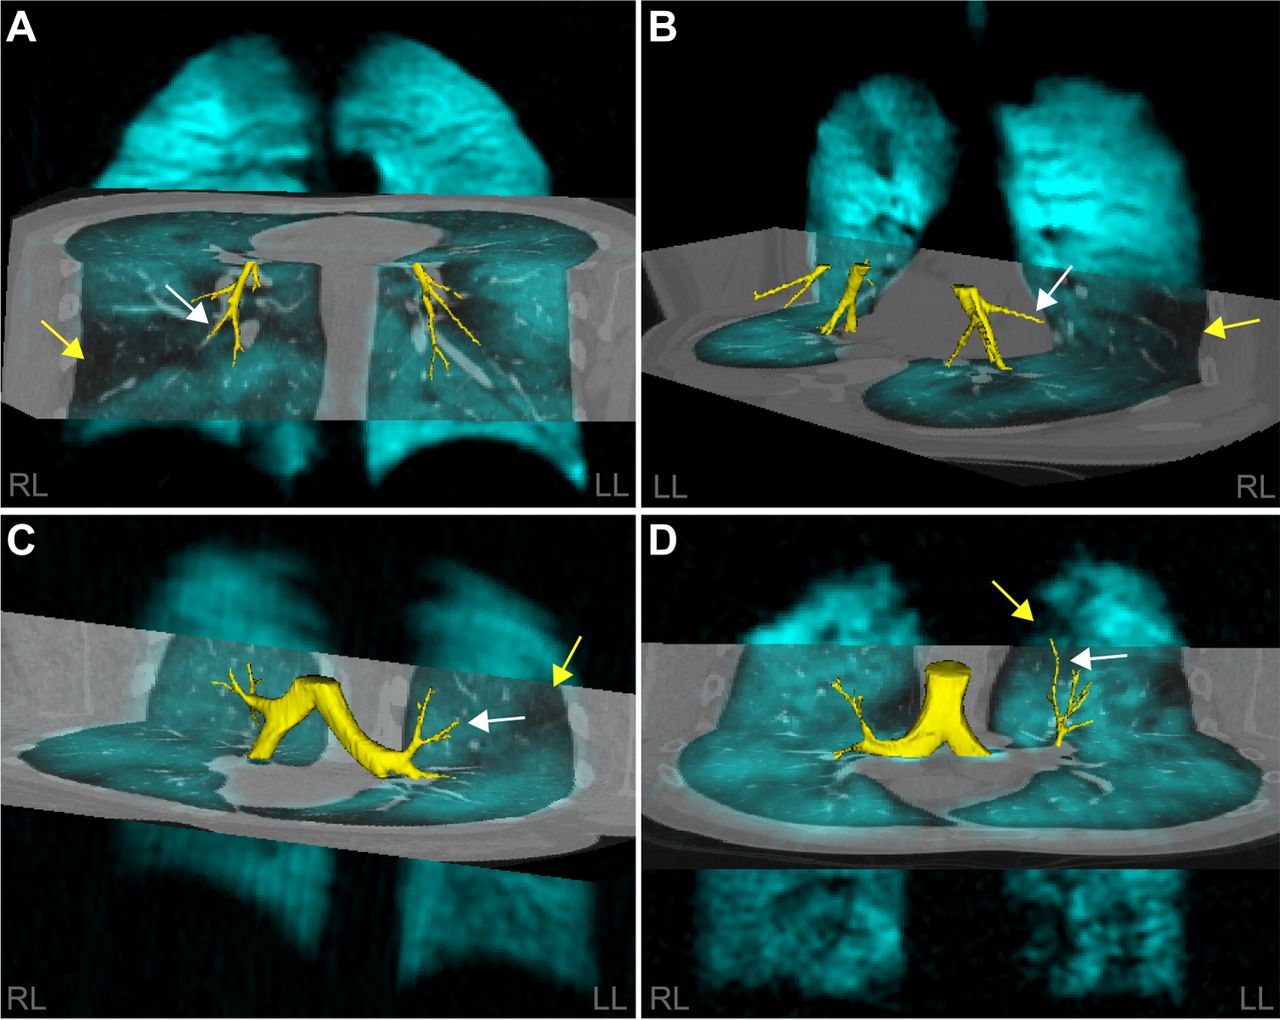
Figure 5 shows hyperpolarised 3He MRI ventilation maps for four subjects with asthma with the 3He MRI ventilation map in blue coregistered to the CT volume with the airway tree segmented in yellow. The qualitative spatial relationship between ventilation defects (yellow arrows) and remodelled airways (white arrows) is shown.

Spatial relationship between ventilation defects and airways for four representative subjects with asthma with ventilation defects. 3He MRI gas distribution (in blue) registered to the regional CT of the thorax (in grey scale) with the airway tree segmented in yellow. Airway measurements are for the specific airway (white arrow) spatially related to the ventilation defect (yellow arrow) of interest. (A) 29 year-old man forced expiratory volume in 1 s (FEV1)=81%pred, regional ventilation defect per cent (VDP)=5%, wall area=71%, lumen area=5 mm2; (B) 49 year-old man, FEV1=60%pred, regional VDP=3%, wall area=67%, lumen area=12 mm2; (C) 25 year-old woman, FEV1=87%pred, regional VDP=2%, wall area=75%, lumen area=5 mm2; (D) 58 year-old man, FEV1=73%pred, regional VDP=1%, wall area=70%, lumen area=5 mm2.
Discussion
To better understand the structural and clinical determinants of MRI ventilation defects in asthma, and, in turn, what it might mean for a subject with asthma to have ventilation defects, we evaluated well-established clinical measurements and emerging CT and 3He MRI measurements of airway structure and function.
We think that it is interesting that 9/26 (35%) subjects with clinical findings and methacholine challenge results diagnostic of asthma had a 3He MRI gas distribution that was qualitatively and quantitatively (VDP and COV) similar to healthy volunteers. It is important to note that all of the healthy volunteers had a homogenous gas distribution with no visual or quantitative evidence of ventilation defects, which is in agreement with previous work at our centre11 ,41–43 and others.5 ,7 ,44 In contrast, and as expected based on previous investigations,5–9 ,11 ,12 the remaining 17/26 (65%) subjects with asthma had obvious ventilation abnormalities. This observation prompted us to ask the question: Are subjects with asthma with ventilation defects different from subjects with asthma without ventilation defects? The results here suggest that subjects with asthma with ventilation defects are older, with worse FEV1/FVC, (but similar FEV1), and greater airways resistance, airway responsiveness and airway inflammation/remodelling. Such findings suggest that ventilation defects may reflect long-term or progressive airway remodelling in patients with a longer history of disease or perhaps more severe or advanced disease. Regardless, the constellation of clinical and imaging findings in these subjects with asthma suggests that more aggressive therapy or compliance to therapy is required. This is a hypothesis that can be tested in future imaging studies of older subjects and/or subjects with more severe asthma.
A number of studies have quantitatively investigated asthma airway structure using CT and showed that bronchial wall thickness was related to asthma severity, duration of disease and airflow obstruction.14–22 Similarly, 3He MRI has previously shown that ventilation defects were related to asthma severity6 and in a preliminary report,45 half of a small group of subjects with asthma (7/15) showed no obvious ventilation defects, with significantly different bronchial wall thickness (but not bronchial wall area) compared with subjects with asthma with ventilation defects. Here, we prospectively acquired MRI and CT within about 30 min using the same lung volume and breath-hold manoeuvre to try to mimic the same airway and parenchyma dimensions using both imaging methods. We must consider that because 3He gas is itself, highly diffusive and may penetrate even narrowed airways, there is the possibility that even when bronchial wall thickness and lumen area are abnormal, some 3He gas ventilation is possible. In support of this explanation, we note the recent report of indirect or collateral ventilation in chronic obstructive pulmonary disease that was directly visualised using hyperpolarised 3He MRI46—likely possible only because the timeframe for imaging was relatively long and 3He gas is highly diffusive.
We also observed that regional CT airway morphology and 3He ventilation defect measurements were significantly correlated. This important finding suggests that there is a relationship between airways that are remodelled and/or constricted and ventilation defects. Previous studies have demonstrated that focal regions of hyperlucency on CT (likely related to gas trapping) were spatially correlated with 3He MRI ventilation defects28 and bronchoalveolar lavage had higher total and per cent neutrophils in areas of the lung with greater ventilation defects, suggestive of increased inflammation. Although we observed significant relationships between airway dimensions and defects, these relationships were modest, perhaps because of the heterogeneity of asthma and the patients with asthma evaluated here, or because of the relatively low dose partial CT ROI that was used. It is important to acknowledge that in asthma, the airways from the large bronchi to the alveolar ducts may be involved,47 thus using CT to measure airway dimensions has limitations because CT cannot spatially resolve the small airways (<2 mm) sufficiently to provide accurate measurements. In addition to small and heterogeneously distributed ventilation defects, some of the subjects with asthma evaluated here presented large wedge-shaped defects; these have previously been reported using single photon emission CT imaging with Technegas25 and are believed to be the result of subsegmental airway narrowing. Following MRI-CT registration we were able to identify and quantify subsegmental bronchi that were spatially related to ventilation defects. Larger ‘subsegmental’ ventilation defects may be the result of proximal remodelled subsegmental airways feeding these regions of signal void. Unfortunately, due to the limitations of the spatial resolution of the CT images, we cannot comment on the structure of the smaller airways distal to the subsegmental airways quantified here, which may further contribute to the abnormal gas distributions observed.
Large and temporally persistent 3He ventilation defects provide excellent targets for therapy and could potentially guide localised airway treatments such as bronchial thermoplasty. Although we have focused our attention on ventilation defects, areas of hyperintense signal intensity are often observed in subjects with asthma in conjunction with ventilation defects. Similar to regions of signal void, to our knowledge, the underlying aetiology of these regions has not been investigated. We hypothesise that hyperintense signal may be due to hyperinflation and note that investigation of these regions is warranted in asthma.
We recognise and acknowledge that this work was limited by the relatively small number of subjects evaluated, although we note that this is the single largest prospective study that directly compared CT and 3He MRI in subjects with asthma and healthy subjects. Furthermore, the subjects evaluated here were enrolled from a multidisciplinary asthma care centre and therefore they represent a diverse group of subjects with asthma that have been mainly referred to improve asthma symptoms and control. As shown in figure 3, there was a single subject with elevated VDP as compared with the other AD subjects and we confirmed that this 42 year-old man had experienced an asthma exacerbation that required hospitalisation approximately 5 months prior to hyperpolarised 3He MRI performed here. This subject's asthma was previously well controlled and the exacerbation was determined to be the result of sudden cessation of asthma medication. It is important to note that the relationships presented in figure 3 remain statistically significant when this outlier is removed from the analysis. Certainly, this is a hypothesis-generating study and therefore marginally significant p values should be interpreted with caution, and larger studies are required for more extensive phenotyping and characterisation of subjects with asthma and to test the hypotheses generated here. We must also acknowledge that our analysis was limited because of the acquisition of partial CT thoracic volumes.
In summary, our results showed that subjects with asthma with 3He MRI ventilation abnormalities were older, with greater airway hyper-responsiveness, and worse measurements of FEV1/FVC and airways resistance/inflammation as well as abnormally remodelled airways in comparison with subjects with asthma with ND. Hyperpolarised 3He ventilation abnormalities were spatially and quantitatively related to remodelled airways in subjects with asthma providing a better understanding of the aetiology of heterogeneous ventilation abnormalities in asthma and the clinical meaning of these abnormalities in subjects with asthma with similar FEV1.
Acknowledgments
We thank S McKay and S Halko for clinical coordination and clinical database management, A Wheatley for production and dispensing of 3He gas and T Szekeres for MRI of research volunteers.
References
Supplementary materials
Supplementary Data
This web only file has been produced by the BMJ Publishing Group from an electronic file supplied by the author(s) and has not been edited for content.
Files in this Data Supplement:
- Data supplement 1 - Online table
Footnotes
-
Contributors SS was responsible for data acquisition, analysis and interpretation, drafting and final approval of the manuscript. MK was responsible for data acquisition, statistical analysis and interpretation, drafting and final approval of the manuscript. DS was responsible for data analysis and interpretation, and final approval of the manuscript. HOC was responsible for data interpretation and final approval of the manuscript. NAMP was responsible for clinical/physiological interpretation of the data, drafting and final approval of the manuscript. DGM was responsible for clinical/physiological interpretation of the data, subject safety, good clinical practice, drafting and final approval of the manuscript. GP, the Principal Investigator, was responsible for conception and design, data acquisition and analysis plan and interpretation, drafting and final revisions of manuscript and final approval as well as guarantor of integrity of the data as well as responsible for Good Clinical Practice.
-
Funding SS was supported by a National Science and Engineering Research Council of Canada (NSERC) Alexander Graham Bell Canada Graduate Scholarship, DS was supported by an NSERC Discovery Grant, and MK was supported by a NSERC Doctoral Postgraduate Scholarship. GP also gratefully acknowledges funding from the Canadian Institute of Health Research (CIHR) New Investigator Award, and operating funding from the Canadian Lung Association and Ontario Research Fund, Research Excellence Award.
-
Competing interests None.
-
Ethics approval The University of Western Ontario Research Ethics Board for Health Sciences Research Involving Human Subjects.
-
Provenance and peer review Not commissioned; externally peer reviewed.
Linked Articles
- Airwaves