Article Text

Abstract
Rationale The lung clearance index (LCI) is a promising endpoint for use in cystic fibrosis (CF) clinical trials, but correlations with validated clinical endpoints have not yet been established.
Objective This study aimed to demonstrate that, in young patients with CF, baseline LCI predicts subsequent pulmonary exacerbation (PE) and correlates with the respiratory domain of the CF Questionnaire-Revised (CFQ-Rresp).
Methods Baseline LCI, forced expiratory volume in 1 s (FEV1), CFQ-Rresp and PEs over the subsequent year were prospectively recorded in 63 patients aged 5–19 years. The ability of baseline LCI to predict PE was assessed using negative binomial regression models and Kaplan–Meier plots.
Results Twenty-six patients (41%) experienced 48 PEs. Baseline LCI and FEV1 were predictors of PE. Compared with the quartile with the lowest LCI, the annual PE rate in increasing LCI quartiles was 2.9 (95% CI 0.5 to 16.5, p=0.238), 5.4 (95% CI 1.0 to 29.0, p=0.045) and 13.6 (95% CI 2.8 to 67.1, p=0.001). Similarly, time to first PE decreased with worsening LCI quartiles (log-rank test for trend, p<0.001). Furthermore, LCI correlated with CFQ-Rresp (r=−0.43, p<0.001). In the subgroup of 53 patients with normal FEV1, LCI was a predictor of PE. In this subgroup, LCI also correlated with CFQ-Rresp (r=−0.282, p=0.043).
Conclusions Baseline LCI predicts PE in young patients with CF and correlates with CFQ-Rresp, a validated patient-reported outcome, even in the subgroup with normal FEV1. These data further support the use of LCI as a surrogate outcome measure in CF clinical trials.
- Cystic Fibrosis
Statistics from Altmetric.com
Key messages
What is the key question?
-
The lung clearance index (LCI) is a marker of early cystic fibrosis (CF) lung disease proven to be sensitive, repeatable and responsive to interventions. However, before the LCI can be used as a surrogate endpoint in trials involving patients with CF, a correlation with clinically meaningful endpoints such as pulmonary exacerbation or patient-reported outcomes has to be established.
What is the bottom line?
-
In young patients with CF, baseline LCI predicts the time to the first pulmonary exacerbation in the 12 months after baseline assessment. The LCI also correlates with CFQ-Rresp, a validated patient-reported outcome.
Why read on?
-
This prospective work demonstrates the link between the LCI and two clinically meaningful endpoints in young patients with CF: pulmonary exacerbations and CFQ-Rresp. This contributes to the validation of the LCI as a surrogate endpoint for use in clinical trials.
Introduction
Forced expiratory volume in 1 s (FEV1) is currently the only accepted surrogate endpoint for use in cystic fibrosis (CF) clinical trials. As most patients with CF have a normal FEV1 until adolescence, FEV1 is an insensitive endpoint for this age group.1 New surrogate endpoints are therefore needed. The lung clearance index (LCI), an index of ventilation homogeneity derived from the multiple breath washout (MBW) of an inert gas, is one candidate surrogate endpoint, as is chest CT.
The LCI satisfies many of the conditions needed to qualify as a surrogate endpoint. It is feasible in a ‘standard’ clinical setting2 ,3 and can be measured repeatedly without harm. The measurement technique was recently standardised,4 and commercially available devices have been validated.5 ,6 Furthermore, the short- and medium-term repeatability are good in both healthy subjects and patients,7 and the LCI is more sensitive than FEV1 for detecting early CF lung disease in cross-sectional analyses.8 ,9 The LCI is also responsive to interventions such as treatments with intravenous antibiotics,10 hypertonic saline11 or rh-DNAse,12 and it was used successfully as an endpoint in a trial evaluating the effect of hypertonic saline in infants.13 In addition, the LCI was shown to be improved in young children with mild CF lung disease carrying at least one G551D mutation who were treated with ivacaftor.14 Initial data concerning the correlation between the LCI and long-term disease course have emerged, and abnormal LCI values in preschool children with CF were shown to predict spirometric abnormalities at school age.15
To validate a physiological measurement as a surrogate endpoint it should be demonstrated that it is correlated with validated clinical outcomes such as survival or, in the case of CF, pulmonary exacerbations (PEs) or patient-reported outcome measures.
The aim of this study was therefore to investigate the relationship between baseline LCI and subsequent PE, patient-reported outcome measures and symptoms as a further step in the validation of the LCI as a surrogate endpoint for clinical trials in patients with CF.
Our first hypothesis was that the baseline LCI would predict subsequent PEs during the year after the baseline measurements. Our second hypothesis was that the LCI would correlate with patient-reported outcome measures and symptom scores. Because the LCI is more sensitive than FEV1 for detecting early lung disease in CF, the LCI was expected to be a predictor of PE and to correlate with patient-reported outcome measures even in the subgroup of patients with normal FEV1.
Some of the results of this study have been previously reported in the form of an abstract.16
Methods
Recruitment
In this prospective single-centre study, patients with CF aged between 5 and 20 years were recruited during routine outpatient visits between January 2011 and October 2012. Patients infected with methicillin-resistant Staphylococcus aureus (MRSA) or Burkholderia cepacia are not allowed in the standard lung function laboratory and were excluded.
Control subjects, recruited by advertisement, had no history of chronic respiratory symptoms and had not suffered respiratory infections in the previous 4 weeks.
The study was approved by the ethics committee of the University of Leuven. Caregivers and/or patients gave written informed consent before inclusion.
Multiple breath washout (MBW) measurement
A detailed description of MBW measurements and quality control is shown in the online supplement.
Nitrogen MBW was performed using the Exhalyzer D (EcoMedics AG, Duernten, Switzerland), as described elsewhere.3 Before spirometry and after inhalation of 400 µg salbutamol, MBW measurements were performed with a between-test delay of more than twice the washout time of the previous measurement.
LCI calculations and repeatability criteria
An MBW measurement was excluded if significant leaks, sighs or irregular breathing occurred or if the functional residual capacity (FRC) differed by more than 20% compared with the largest FRC of the valid measurements within the same session. The mean LCI of all valid MBW measurements was used.
Z-scores were calculated from the values in the control group. An LCI z-score of >2 was considered abnormal.
Spirometry and biometry
FEV1, forced vital capacity (FVC) and forced expiratory flow between 25% and 75% of FVC (FEF25−75) were expressed as the percent predicted or as z-scores using reference equations from the Global Lung Function Initiative.17 A z-score lower than −2 was considered abnormal.
Height, weight and body mass index were expressed as z-scores according to local reference equations.18
Pulmonary exacerbations
The time to the first PE and the number of PEs during the 12 months following the baseline LCI measurement were recorded. PEs were defined as changes in respiratory status for which intravenous antibiotics were administered. Intravenous antibiotic therapy was prescribed by the CF consultant in accordance with current practice guidelines.19 The LCI results were not disclosed to the clinicians.
Patient-reported outcome and symptom score
Before any other procedure, each child (≥12 years) or parent (<12 years) completed the respiratory domain of the CF Questionnaire-Revised (CFQ-Rresp).20 ,21 The CFQ-Rresp was standardised to range from 0 to 100, with high scores indicating fewer respiratory symptoms.
The CF Clinical Score (CFCS)10 ,22 is a composite score including symptoms and clinical findings assessed by the CF consultant and ranges from 10 (mildest symptoms and signs) to 50 (most severe symptoms and signs).
Both assessments were taken on the same day as the MBW measurement and the spirometry.
Statistical analysis
The LCI, spirometric parameters, CFQ-Rresp and CFCS were divided into quartiles. The time to subsequent PE was compared between quartiles using Kaplan–Meier plots and the log-rank test for trend.
The predictive value of age, gender, infection with Pseudomonas aeruginosa, LCI z-score, FEV1 z-score, FEF25−75 z-score, CFQ-Rresp and CFCS on annualised PE rate was evaluated using univariate and multivariate negative binomial regression models.
Correlations between parameters were assessed by Spearman correlation coefficient (r).
SPSS V.21.0 (IBM, Armonk, New York, USA) was used for the statistical analyses.
Results
Study population
Of the 86 eligible 5–19-year-old patients with CF in follow-up at the Leuven CF Centre, 63 were enrolled. The reasons for not participating included patient not approached by the staff (n=13), infection with B cepacia and/or MRSA (n=5), inability to obtain a valid MBW measurement (n=3) or refusal by the patient (n=2). There were no differences in age, weight, height, body mass index, spirometry, pancreatic status, proportion of F508del homozygotes or colonisation status for P aeruginosa between patients who were or were not enrolled (table 1).
Baseline characteristics of study cohort
Of the 61 enrolled control subjects, three were excluded due to inability to perform the MBW measurement and one because of suspicion of subclinical lung disease (Ehler–Danlos syndrome). Compared with the patients with CF, the control subjects had a similar age distribution but a greater z-score for weight, height, FEV1 and FEF25–75 and a lower LCI z-score (table 1).
Correlation between LCI, FEV1 and FEF25−75
In the patients with CF there was a negative correlation between the LCI z-score and FEV1 z-score (r=−0.642, p<0.001). In 42 of the 63 patients (67%) the LCI was abnormal but the FEV1 was normal. Eleven patients (17%) had a normal LCI and a normal FEV1 and 10 (16%) had an abnormal LCI and FEV1. None of the patients with an abnormal FEV1 had a normal LCI (figure 1 and online supplementary figure E1). There was a moderate correlation between the LCI and FEF25−75 z-scores (r=−0.673, p<0.001, see online supplementary figure E2) and a strong correlation between FEV1 and FEF25−75 z-scores (r=0.731, p<0.001). Of 53 patients with a normal FEV1, 47 (89%) also had a normal FEF25−75 and 6 (11%) had an abnormal FEF25−75. These six patients also had an abnormal LCI (see online supplementary figure E2).

Relationship between the lung clearance index (LCI) z-score and forced expiratory volume in 1 s (FEV1) z-score in patients with cystic fibrosis with subsequent pulmonary exacerbation (closed circles) or without pulmonary exacerbation (open circles). The horizontal line represents the upper limit of normal for the LCI z-score and the vertical line represents the lower limit of normal for the FEV1 z-score.
All control subjects had a normal LCI and a normal FEV1. A negative correlation between the LCI z-score and FEV1 z-score was also observed in the controls (r=−0.384, p=0.004).
Correlation of lung function with CFQ-Rresp and CFCS
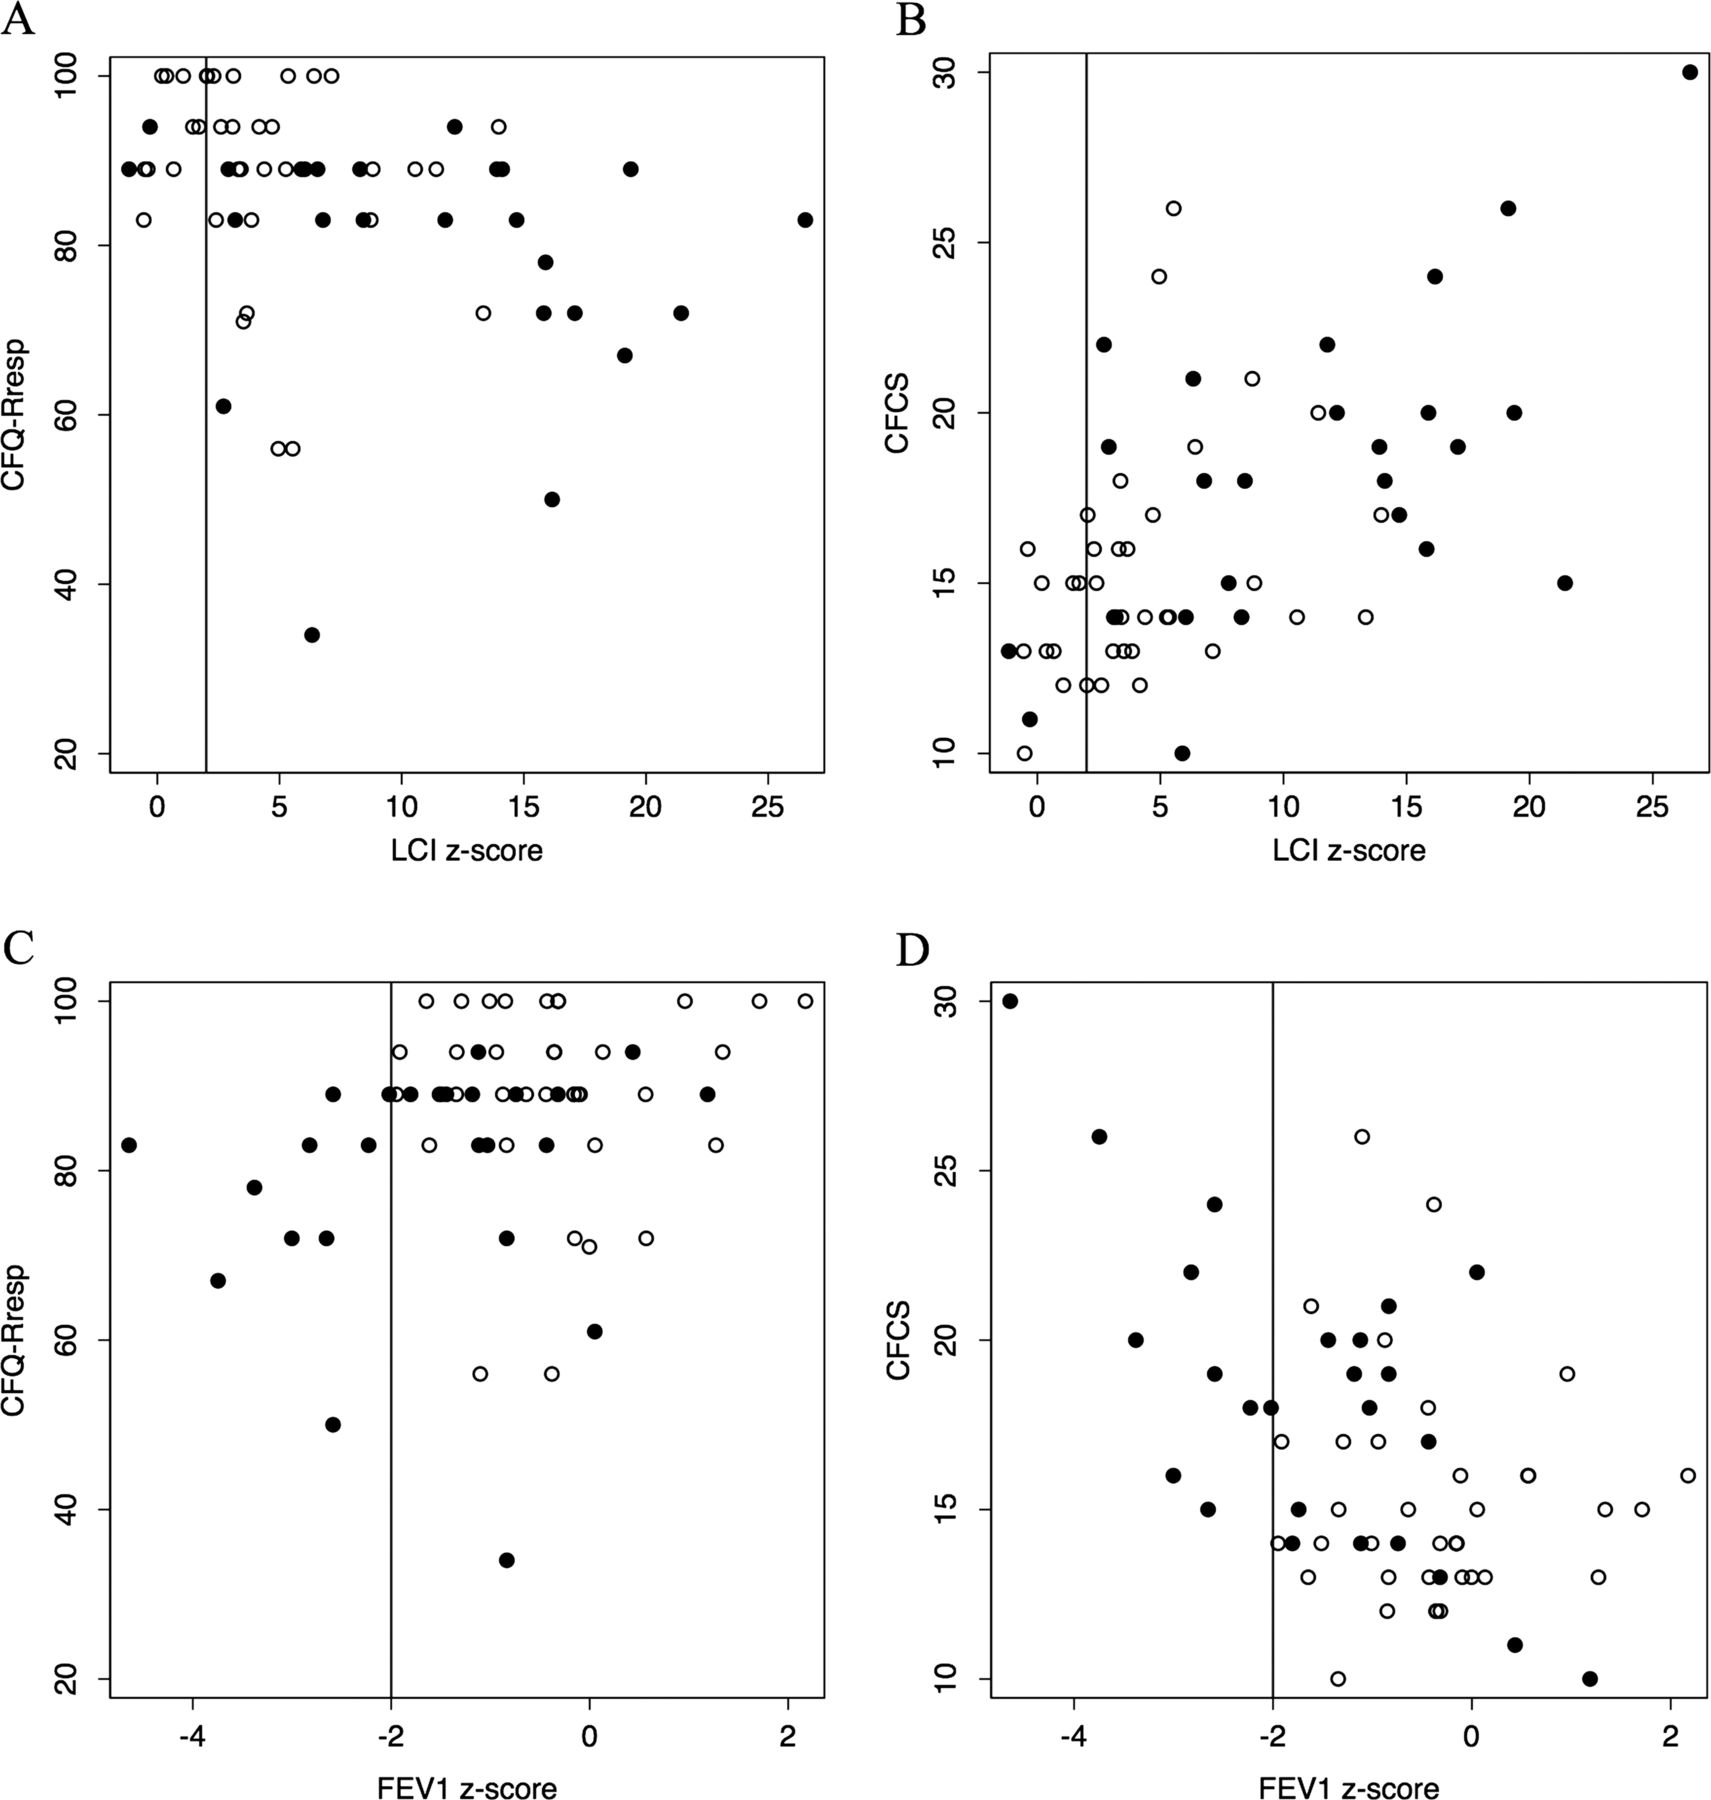
The LCI z-score (r=−0.431, p<0.001, figure 2A) and the FEF25−75 z-score (r=0.409, p=0.001) correlated with the CFQ-Rresp but the FEV1 z-score (r=0.249, p=0.051, figure 2C) did not. The LCI z-score also correlated with the CFCS (r=0.565, p<0.001, figure 2B), as did the FEV1 z-score (r=−0.411, p=0.002, figure 2D) and FEF25−75 z-score (r=0.462, p<0.001). A separate analysis of children (<12 years) and adolescents (≥12 years) showed similar associations (see online supplementary table E1).

Correlations between the lung clearance index (LCI) z-score and (A) the respiratory domain of the Cystic Fibrosis Questionnaire-Revised (CFQ-Rresp) and (B) the Cystic Fibrosis Clinical Score (CFCS) and between the forced expiratory volume in 1 s (FEV1) z-score and (C) the CFQ-Rresp (D) and the CFCS in patients with cystic fibrosis with pulmonary exacerbation (closed circles) or without pulmonary exacerbation (open circles). The vertical line represents the upper limit of normal for the LCI z-score (A and B) or the lower limit of normal for the FEV1 z-score (C and D).
When the analysis was restricted to the subgroup of 53 patients with a normal FEV1 (z-score>−2), there remained a correlation between the LCI z-score and CFQ-Rresp (r=−0.282, p=0.043) and between the LCI z-score and the CFCS (r=0.445, p=0.002), but not between the FEV1 z-score and the CFQ-Rresp (r=0.016, p=0.908) or CFCS (r=−0.17, p=0.260).
Pulmonary exacerbations
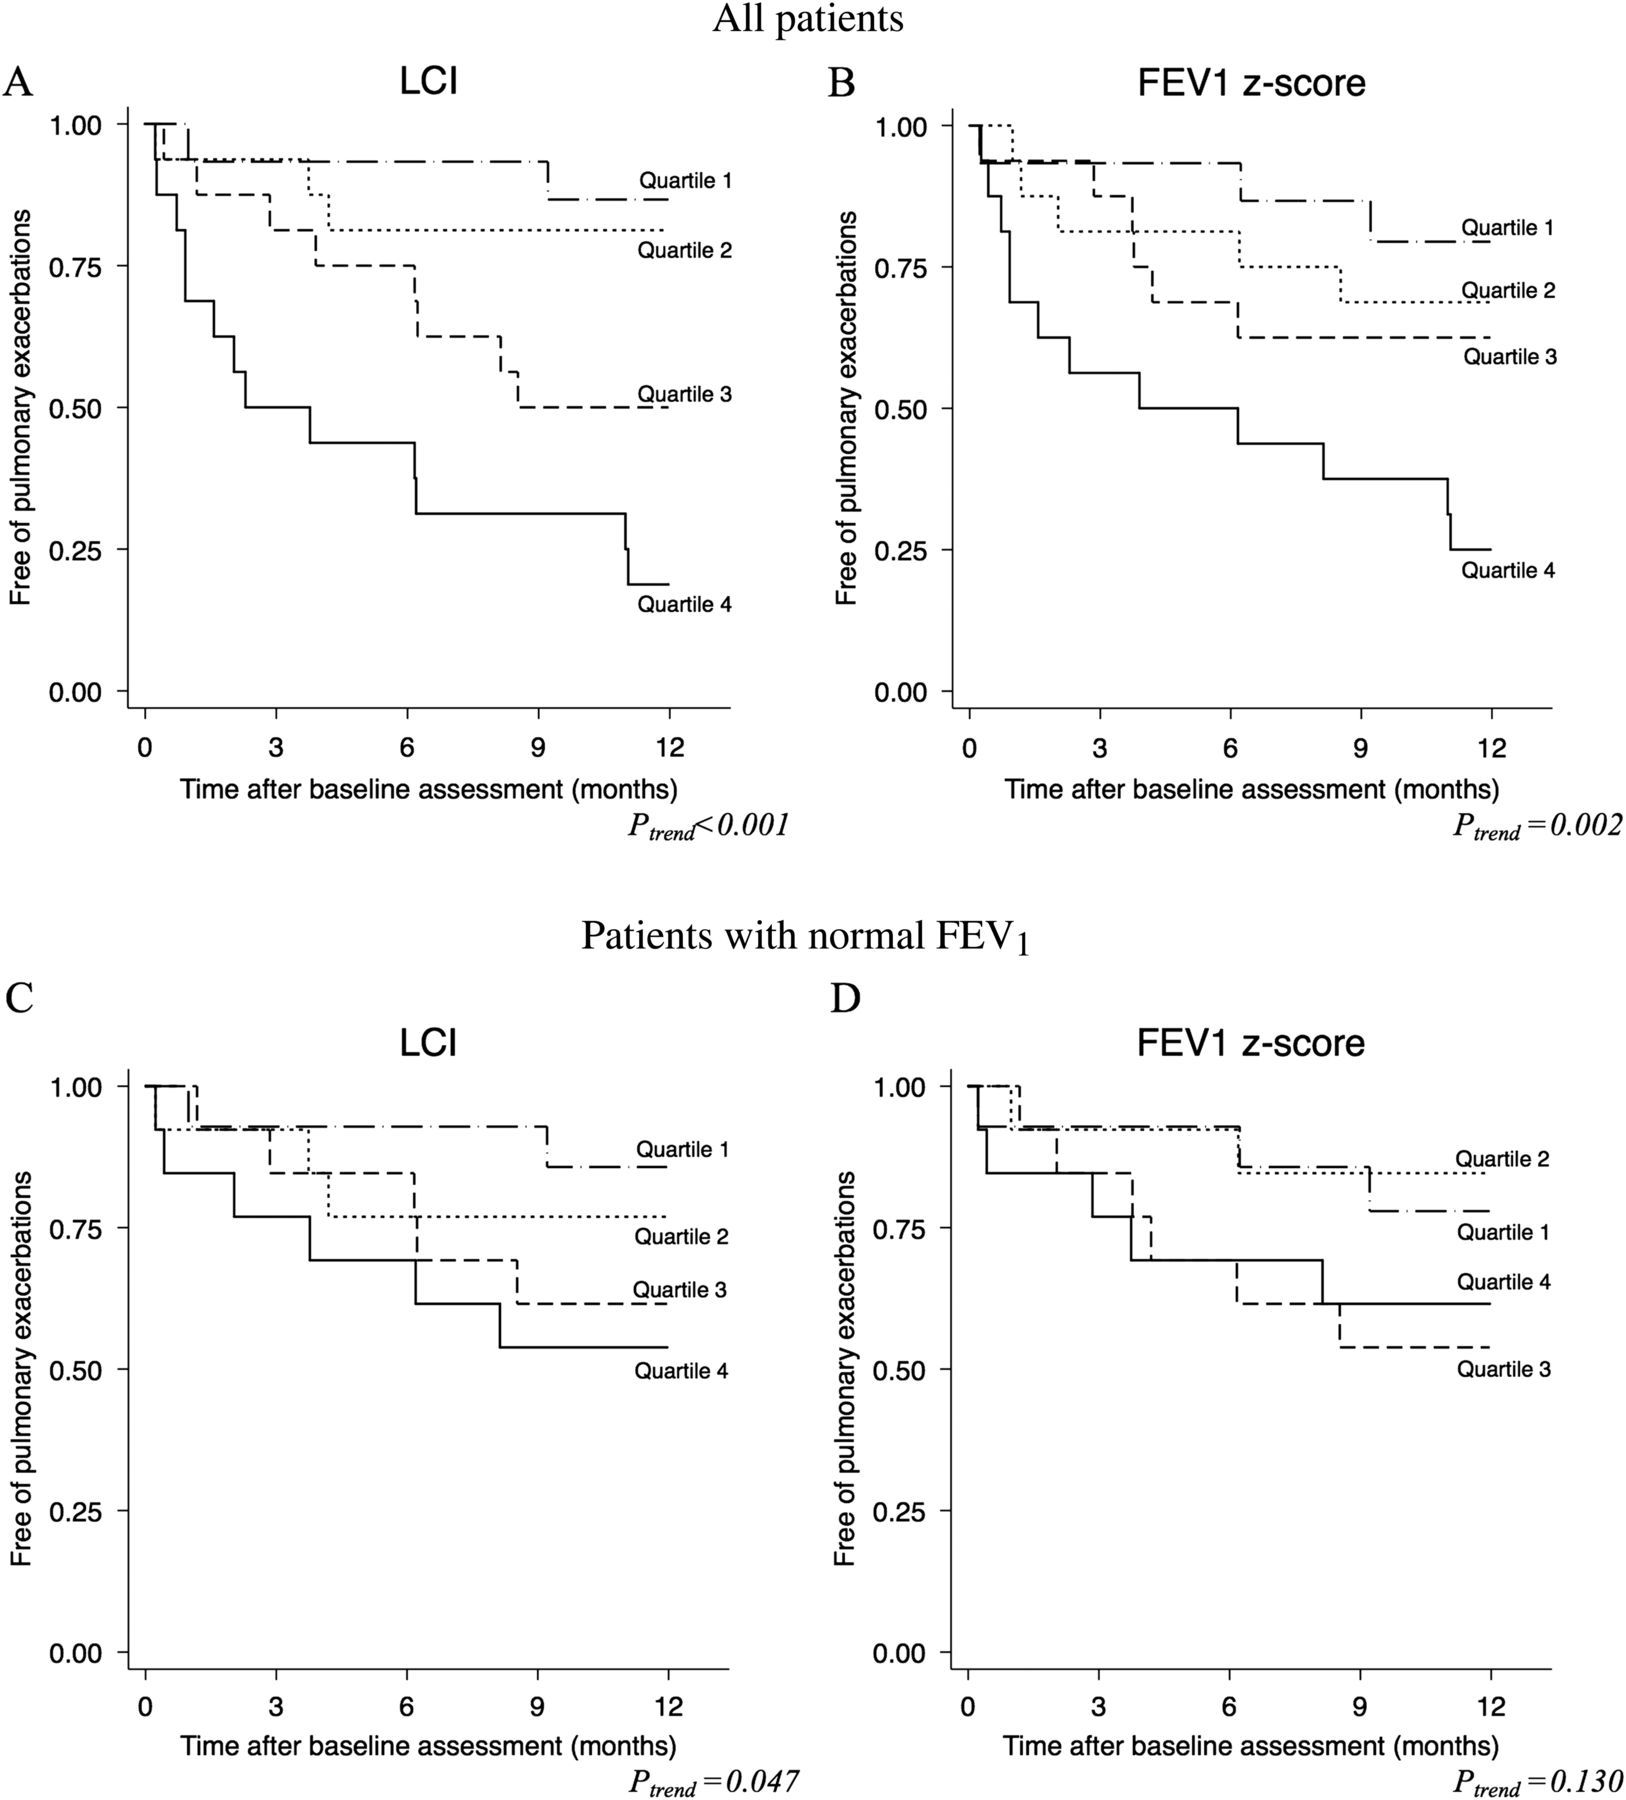
Of the 63 patients, 26 (41%) received a total of 48 courses of intravenous antibiotics for a PE in the follow-up period after the baseline LCI measurement. Follow-up time was 365 days for 60 patients and 349, 223 and 177 days for the three other patients. The time to the first PE decreased with worsening LCI quartile (p<0.001, figure 3A) and worsening FEV1 z-score quartile (p=0.002, figure 3B) or FEF25−75 z-score quartile (p=0.001, see online supplementary figure E3A). The time to the first PE also decreased with worsening CFQ-Rresp quartile (p=0.001, see online supplementary figure E4A) and with worsening CFCS quartile (p=0.001, see online supplementary figure E4B).
Kaplan–Meier plots for the time to the first pulmonary exacerbation (PE) after the baseline measurement. The subjects are grouped by quartiles of the lung clearance index (LCI) (A and C) and forced expiratory volume in 1 s (FEV1) z-scores (B and D). In the upper plots (A and B), all subjects were included. In the bottom plots (C and D), only subjects with a normal FEV1 were included (see table E2 in the online supplement for the definitions of the quartiles). p Values from the log-rank test for trend are shown.
When the subgroup of patients with a normal FEV1 was analysed (n=53), a difference in time to first PE among the LCI quartiles persisted (p=0.047, figure 3C), although this was not observed for the FEV1 z-score quartiles (p=0.113, figure 3D) or among the FEF25−75 z-score quartiles (p=0.452, see online supplementary figure E3B).
The univariate regression analysis (table 2) showed that the annual PE rate was higher among patients in the worst quartile compared with those in the best quartile for LCI (p=0.003). This difference was also observed when comparing the FEV1 (p=0.016) or FEF25−75 z-score quartiles (p=0.020). Restricting the analysis to the subgroup of patients with a normal FEV1, the patients in the worst LCI quartile still had a higher PE rate than those in the best LCI quartile (p=0.043), whereas the PE rate was not different between patients in the worst FEV1 z-score quartile (p=0.280) or FEF25−75 quartile (p=0.453) compared with those in the best quartiles.
Annual rate of PEs and rate ratios (RRs) from the univariate negative binomial regression models by quartiles of LCI and FEV1 z-scores in all patients and in patients with a normal FEV1
Age, isolation of P aeruginosa in the previous year, LCI z-score, FEV1 z-score, FEF25−75 z-score, CFCS and CFQ-Rresp were used as predictors for the multivariate prediction model because they were found to be significant predictors of the PE rate in the univariate analysis (table 3). The backward stepwise approach identified the LCI z-score (p=0.001) as the only independent predictor of the PE rate in the year following the baseline assessment. An increase in the LCI z-score of 1 resulted in an increase in the PE rate by 12.0% (95% CI 5.0% to 19.5%). Restricting the analysis to patients with a normal FEV1, the LCI z-score remained a predictor of the PE rate in the following year (rate ratio (RR) 1.12, 95% CI 1.02 to 1.23, p=0.017) and a trend was shown for the FEV1 z-score (RR 0.57, 95% CI 0.31 to 1.07, p=0.077) and the FEF25−75 z-score (RR 0.72, 95% CI 0.47 to 1.11, p=0.134).
Univariate negative binomial regression models for pulmonary exacerbations in the year following the baseline measurement
Discussion
In the present study we have demonstrated a clear association between the baseline LCI and subsequent PEs in a cohort of 5–19-year-old patients with CF. We also documented a correlation between the LCI and the CFQ-Rresp, a validated patient-reported outcome. This result demonstrates the association between the LCI and clinically meaningful endpoints, which is a necessary step in the validation of LCI as a surrogate endpoint for clinical trials involving patients with CF. In the subgroup of patients with a normal FEV1, the LCI was more closely related to PEs and CFQ-Rresp than were FEV1 and FEF25−75, highlighting the added value of the LCI over FEV1 and FEF25−75 in the group of patients with early CF lung disease.
LCI and PEs
The cohort included in this study is representative of the current spectrum of lung disease in children and young adults with CF. The majority of our patients had a normal FEV1, as observed in most Western countries, but an abnormal LCI. All children with a normal LCI had a normal FEV1, which is in line with the expected superior sensitivity of the LCI to detect early lung disease.8 At the severe end of the spectrum of lung function abnormalities, PEs were predicted by FEV1 as all patients with an abnormal FEV1 had at least one PE in the 1-year follow-up period. This observation was not unexpected because FEV1 is one of the major determinants of PE,24 and clinicians take FEV1 into account when deciding whether a patient needs additional treatment.19 In this study the clinicians were blinded to the LCI values to avoid changes in the threshold for treating patients with intravenous antibiotics. Despite this blinding, LCI was a good predictor of PEs in patients with a normal FEV1. Only two of 11 patients with a normal LCI were treated with intravenous antibiotics for a PE: one patient was a 10-year-old boy with an eventual diagnosis of allergic bronchopulmonary aspergillosis and the other was a 17-year-old girl with mild symptoms and no significant change in FEV1, weight or LCI before and after treatment with intravenous antibiotics. In the multivariate analysis, LCI remained as the single predictor of PE. It should be highlighted that, as LCI, FEV1 and FEF25–75 are correlated, one of these spirometric parameters could have been excluded from the multivariate model because colinearity decreases the power of the analysis to detect significant predictors. Ideally, the model should have been built from a fraction of the dataset and validated in the remaining data. Due to limited number of subjects, this could not be applied in the present study.
As there is no universally accepted definition for PE,25 we chose to use a conservative definition including only episodes treated with intravenous antibiotics. PEs treated with intravenous antibiotics are known to have an impact on long-term outcomes26 and patient-reported outcomes,27 which suggests that our definition of PE represented a relevant clinical outcome. Episodes of treatment with oral antibiotics were not considered in the present study as their impact on outcomes has not been established and because oral antibiotics are also prescribed for positive airway cultures, regardless of clinical symptoms. The decision to administer intravenous antibiotics was made during multidisciplinary team meetings in a single centre, thereby minimising the differences in practice among physicians. Using this definition, 40% of our patients experienced a PE, which is in line with previously published data in similar age cohorts.24
Patient-reported outcomes
Correlations with patient-reported outcomes have been reported for FEV1,28 total CT score29 and bronchiectasis and air trapping scores.30 Data on the correlations among LCI, symptoms and patient-reported outcomes are sparse. Bakker et al31 measured the LCI and cough counts over two nights in preschool children with CF and found no correlation between these variables. Aurora et al15 found a correlation between the LCI and recent cough in preschool children with CF. However, the study by Amin et al12 found no correlation between the LCI and the CFQ-Rresp in a small group of patients. We showed that the LCI correlated with the CFQ-Rresp even in the group with a normal FEV1 even though FEV1 did not, which again highlights the superiority of LCI over FEV1 at the milder end of the CF disease spectrum.
Whether other spirometric indices such as the maximum expiratory flow at 50% of FVC,32 forced expiratory flow at 75% of FVC8 ,33 and FEF25−7512 could be more sensitive for early CF lung disease than FEV1 has been debated. In the present cohort only a minority of patients (6 of 53) with a normal FEV1 had an abnormal FEF25−75, suggesting that FEF25−75 adds little information to that provided by FEV1. In addition, FEF25−75 correlated with CFQ-Rresp and was predictive of PE but, unlike LCI, was not a predictor of PE in patients with a normal FEV1.
Future developments
Demonstrating a relationship with subsequent mortality would validate the LCI as a surrogate outcome measure. However, whether initial disease progression as shown by changes in the LCI at a younger age will continue during adulthood and lead to an untimely death remains unclear although, in adults, the LCI has been correlated with FEV1,34 a strong predictor of mortality.35
After establishment of the prognostic value of LCI for occurrence of PEs, more information is needed about fluctuations of LCI in patients with CF, the effect of exacerbations on LCI and the timing and magnitude of LCI improvement with interventions to determine what represents a clinically meaningful change.
The present study was at a single centre and the results may need to be replicated by other teams. With the advent of commercially available tools to measure LCI and the standardisation of its measurements and calculations, more centres will probably measure the LCI as part of their routine evaluation in patients with CF, providing ‘real-life’ longitudinal data on the long-term significance of LCI.
This study was not designed to explore whether or how LCI can be used to guide therapeutic decisions in an individual patient. It is not known how much decline would indicate the need for additional treatment or how much increase would constitute a significant improvement.
The placement of the LCI in the outcome toolbox requires further refinement, and it needs to be evaluated how this measure compares with other surrogate outcomes such as the chest CT scan score. However, the LCI appears to fit well as an endpoint in children with CF and mild lung disease in whom FEV1 lacks sensitivity and in whom the need for repeated measurements contraindicates chest CT due to radiation risks.
In conclusion, the present study shows that the LCI is predictive of PE and is related to patient-reported outcomes and symptoms in 5–19-year-old patients with CF, even in the subgroup with a normal FEV1. These results add to the validation of the LCI as a surrogate endpoint for use in clinical trials.
Acknowledgments
The authors thank the children and families participating in the study. They also thank Kris Colpaert, Linda Boulanger, Nathalie Feyaerts and Jill Ophoff for technical assistance and help with data collection and management.
References
Supplementary materials
Supplementary Data
This web only file has been produced by the BMJ Publishing Group from an electronic file supplied by the author(s) and has not been edited for content.
Files in this Data Supplement:
- Data supplement 1 - Online supplement
Footnotes
-
Contributors Acquisition of data: FV, MP, MB and KDB. Analysis and interpretation of data: FV and KDB. Drafting or revising the paper for important intellectual content and final approval of the paper: FV, MP, MB, TH and KDB.
-
Funding This study was supported by a grant from the ‘Belgische Vereniging voor de Strijd tegen Mucoviscidose’ and ‘Klinisch Onderzoeksfonds’.
-
Competing interests None.
-
Ethics approval The study was approved by the ethics committee of the University of Leuven.
-
Provenance and peer review Not commissioned; externally peer reviewed.
Linked Articles
- Airwaves