Article Text

Abstract
Background A core feature of chronic obstructive pulmonary disease (COPD) is the accelerated decline in forced expiratory volume in one second (FEV1). The recent Groningen and Leiden Universities study of Corticosteroids in Obstructive Lung Disease (GLUCOLD) study suggested that particular phenotypes of COPD benefit from fluticasone±salmeterol by reducing the rate of FEV1 decline, yet the underlying mechanisms are unknown.
Methods Whole-genome gene expression profiling using the Affymetrix Gene ST array (V.1.0) was performed on 221 bronchial biopsies available from 89 COPD patients at baseline and after 6 and 30 months of fluticasone±salmeterol and placebo treatment in GLUCOLD.
Results Linear mixed effects modelling revealed that the expression of 138 genes decreased, whereas the expression of 140 genes significantly upregulated after both 6 and 30 months of treatment with fluticasone±salmeterol versus placebo. A more pronounced treatment-induced change in the expression of 50 and 55 of these 278 genes was associated with a lower rate of decline in FEV1 and Saint George Respiratory Questionnaire, respectively. Genes decreasing with treatment were involved in pathways related to cell cycle, oxidative phosphorylation, epithelial cell signalling, p53 signalling and T cell signalling. Genes increasing with treatment were involved in pathways related to focal adhesion, gap junction and extracellular matrix deposition. Finally, the fluticasone-induced gene expression changes were enriched among genes that change in the airway epithelium in smokers with versus without COPD in an independent data set.
Conclusions The present study suggests that gene expression in biological pathways of COPD is dynamic with treatment and reflects disease activity. This study opens the gate to targeted and molecular phenotype-driven therapy of COPD.
- COPD ÀÜ Mechanisms
This is an Open Access article distributed in accordance with the Creative Commons Attribution Non Commercial (CC BY-NC 3.0) license, which permits others to distribute, remix, adapt, build upon this work non-commercially, and license their derivative works on different terms, provided the original work is properly cited and the use is non-commercial. See: http://creativecommons.org/licenses/by-nc/3.0/
Statistics from Altmetric.com
Key messages
What is the key question?
-
What are the underlying mechanisms of the long-term beneficial effects of corticosteroids on FEV1 decline in COPD?
What is the bottom line?
-
Airway gene expression in COPD is dynamic with treatment and associates with clinical response.
Why read on?
-
Our findings provide much needed insight into the biological pathways that reflect and potentially mediate treatment-induced clinical improvement in COPD.
Introduction
Chronic obstructive pulmonary disease (COPD) is one of the most common chronic diseases in adults with a worldwide prevalence that increases to more than 10% of adults older than 65 years.1 It is characterised by chronic progressive lung function decline in association with an inflammatory response of the airways to noxious particles or gases. Thus far, distressingly little is known about the underlying pathophysiology responsible for this chronic inflammation and relentless disease progression, processes that persist for years even after individuals quit smoking. There is neither a curative therapy nor a pharmacological intervention that is generally accepted to be disease modifying.2 Together with the high prevalence of COPD, this indicates a high medical need and an urgent scientific challenge.
The long-term effects of inhaled corticosteroids (ICS) in COPD have been reported in several studies, but with conflicting results and their role in COPD management continues to be subject to much debate.3–5 Recently, the Groningen and Leiden Universities study of Corticosteroids in Obstructive Lung Disease (GLUCOLD) yielded more positive effects than most studies so far.6 In this randomised placebo-controlled study, the long-term effects of fluticasone or fluticasone/salmeterol were investigated in patients with COPD.6 As could be expected, patients treated with placebo experienced a considerable decline in forced expiratory volume in one second (FEV1) of −79 (95% CI −112 to −46) mL/year between 6 and 30 months of follow-up. Remarkably, treatment with fluticasone or fluticasone/salmeterol significantly diminished the rate of FEV1 decline, being close to zero for fluticasone and only −16 (95% CI −46 to 15) mL/year for fluticasone/salmeterol.6 The larger benefits by ICS observed in this study as compared with previous ones raise the concept that phenotypic characteristics are determining treatment effects in COPD.
The aim of the present study was to investigate the underlying mechanisms of the long-term beneficial effects of corticosteroids on FEV1 decline in COPD. To this end, genome-wide gene expression profiling was performed in bronchial biopsies from COPD patients who participated in the GLUCOLD study before and during treatment with inhaled fluticasone±salmeterol or placebo.6 Findings were validated using a different group of COPD patients randomised to 6 months fluticasone followed by 24-month placebo, allowing the validation of gene expression changes associated with treatment and their reversion to baseline levels following treatment cessation.
Methods
Patients and study design
All COPD patients participating in the GLUCOLD study were included. The inclusion and exclusion criteria have been previously described.6 In the GLUCOLD study, patients were randomly assigned to receive one of four treatments in a blinded way for patients, clinicians and researchers: (1) fluticasone 500 μg twice daily for 30 months; (2) fluticasone/salmeterol 500/50 μg twice daily for 30 months, (3) placebo twice daily for 30 months or (4) fluticasone 500 μg twice daily for the first 6 months followed by placebo twice daily for 24 months. During follow-up, spirometry was performed every 3 months. In addition, a bronchoscopy with biopsies of the central airways was performed before and 6 and 30 months after treatment. The study was approved by the local medical ethics committees and all patients gave their written informed consent. A consort diagram showing the number of bronchial biopsies available for microarray analysis at each time point (baseline and after 6 and 30 months of treatment) is presented in figure 1. The methods for RNA isolation and size fractionation, Affymetrix Human Gene ST V.1.0 microarray hybridisation, data normalisation, quality control as well as PCR validation are described in the online supplementary material.
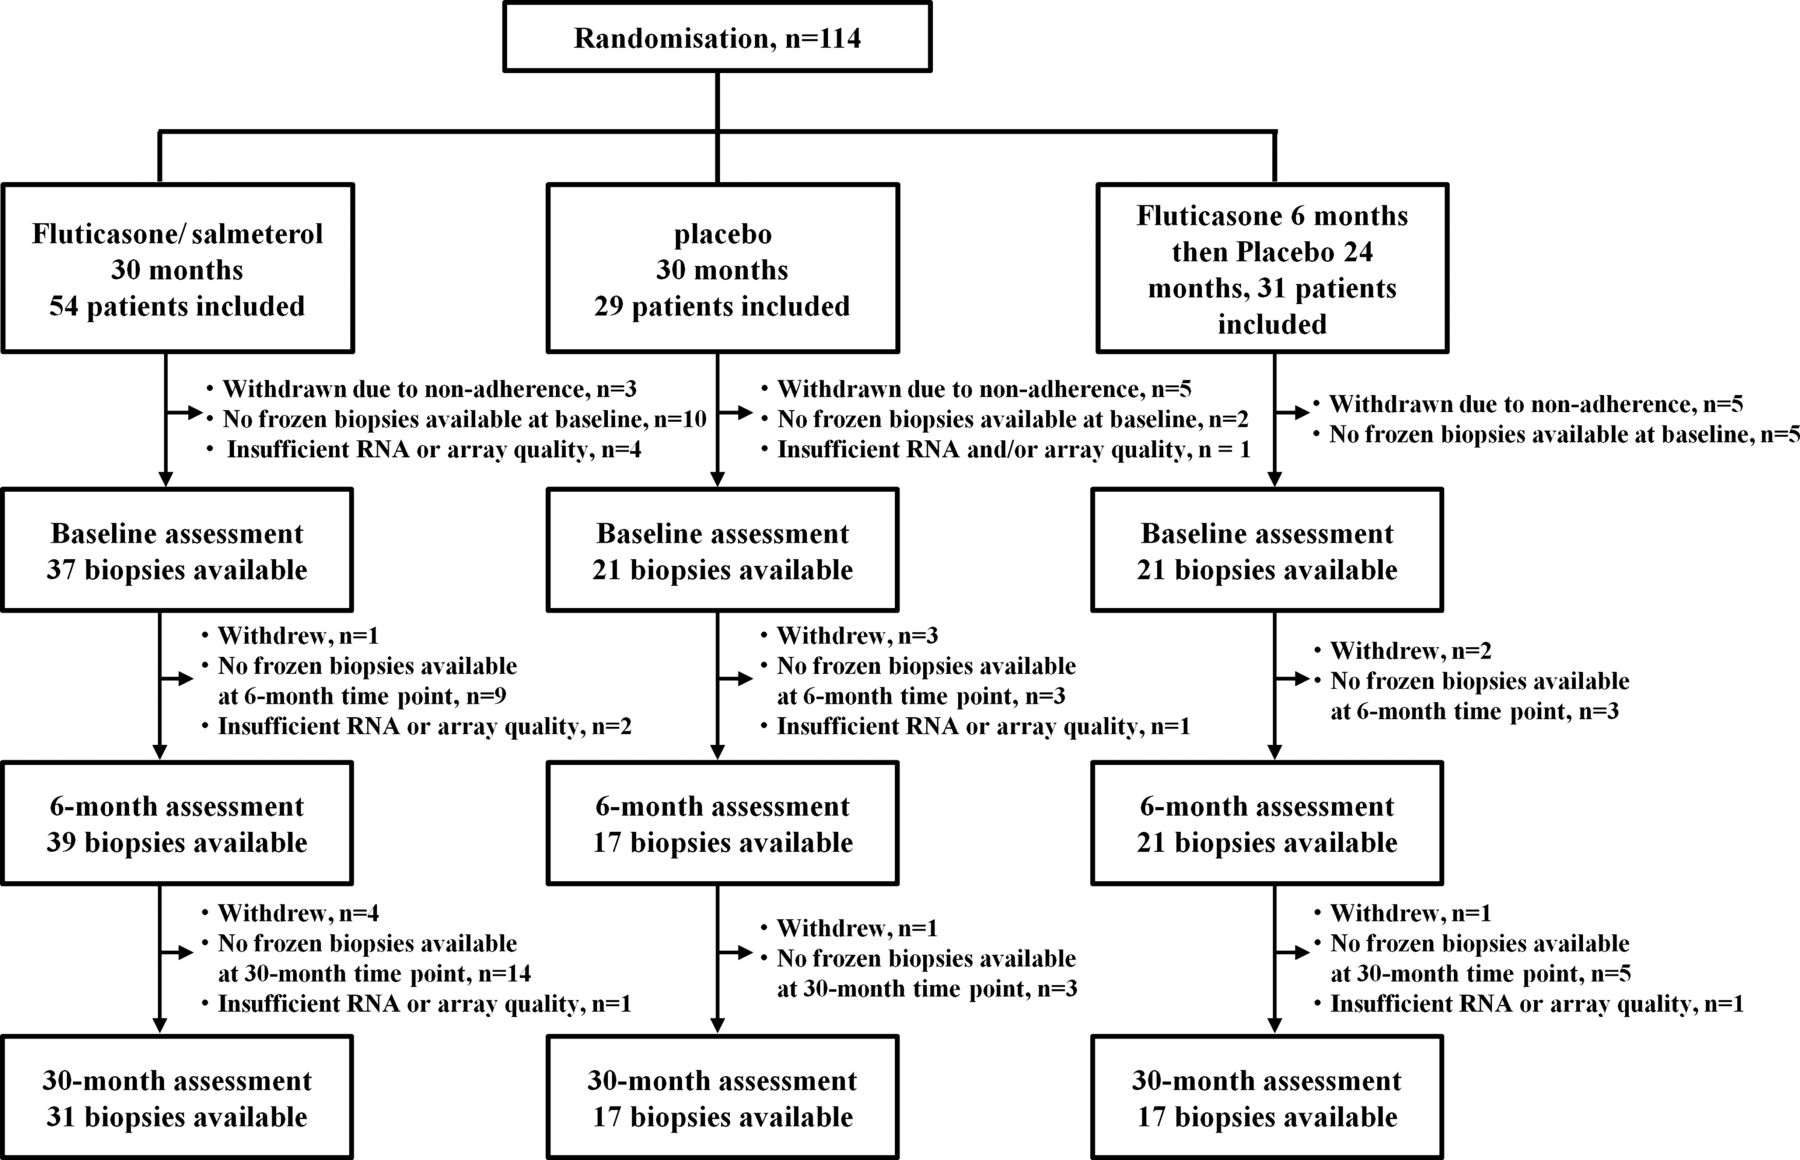
Consort diagram of the Groningen and Leiden Universities study of Corticosteroids in Obstructive Lung Disease (GLUCOLD) study showing the total number of biopsies available at each time point. In the GLUCOLD study, patients were withdrawn from further analysis if their adherence to treatment was below 70%.
Statistical analyses
All statistical analyses were performed with the R statistical software V.2.12.0.
Identification of genes that change after treatment with fluticasone±salmeterol in the first three treatment arms
To investigate which genes changed after treatment, we analysed gene expression levels in bronchial biopsies of COPD patients who were treated for 30 months with fluticasone±salmeterol or placebo. Since the clinical and anti-inflammatory effects of long-term treatment with fluticasone and fluticasone/salmeterol were comparable, these treatment arms were analysed together as this increases the power of our study. Thus, treatment was defined as a factor with two levels: placebo versus treatment (fluticasone with or without added salmeterol). Time was defined as a categorical factor with three levels: 0, 6 and 30 months. Smoking status and RNA integrity number (RIN) scores for each subject and at each time point were included as covariates and patient as a random effect variable. Next, we performed an analysis of variance (ANOVA) to compare linear mixed effect model 1 with linear mixed effect model 2 for each gene as described below, where Geij represents the log2 gene expression value for a gene in sample i from patient j, ɛij represents the error that is assumed to be normally distributed and αj represents the patient random effect: 1
1 2
2
To control for multiple testing, a false discovery rate (FDR) below 0.25 was maintained.7 Next, the coefficients from the interaction term β5iXTreatment:Time from linear mixed effect model 1 were used to select those genes that changed significantly (at a nominal p value <0.05) and in the same direction after both 6 and 30 months of treatment with fluticasone±salmeterol versus placebo. A summary of methods and key results is presented in figure 2.

Summary of the methods and key results.
Additional information on the statistical approach to investigate association between treatment-induced change in gene expression and change in FEV1 is provided in online supplementary material.
Validation in a separate treatment arm of GLUCOLD
To validate our findings, we used the fourth GLUCOLD study arm as validation set consisting of 6-month treatment with fluticasone followed by 24-month treatment with placebo. We assessed whether (1) genes identified as being affected by treatment with fluticasone±salmeterol would change similarly after 6-month treatment with fluticasone in the fourth study arm and (2) these genes would revert towards baseline in the 24-month interval after treatment was discontinued and patients switched to placebo. For these analyses, we used the same linear model 1 as described above and considered a difference with a nominal p value <0.05 to be statistically significant.
Functional enrichment analysis
Functional enrichment analysis was performed using Gene Set Enrichment Analysis (GSEA) V.2.07.8 A more detailed description is provided in the online supplementary material. GSEA was also used to examine the relationships between gene expression differences associated with treatment and those associated with COPD using an independent gene expression data set of bronchial brushes from patients with and without COPD.9 To this end, genes were ranked according to the strength of their t-statistic reflecting their association with the presence of COPD and GSEA was applied to investigate if genes that change with treatment are upregulated or downregulated in COPD.9
Results
Patient population
A total of 89 out of 114 randomised COPD patients in GLUCOLD had two or more frozen biopsies available with RNA and microarray data of sufficient quality for analysis and were included in the study (figure 1 shows the consort diagram). Their clinical characteristics are summarised in table 1.
Patient characteristics
Changes in airway gene expression after both 6 and 30 months of treatment
An outline of the analytical approach and the main study results is presented in figure 2. Using ANOVA, we identified a total of 1650 genes changing with fluticasone±salmeterol versus placebo after either 6 or 30 months of treatment (FDR<0.25). Next, we explored the change in the expression of these 1650 genes at two different time points, that is, 0–6 and 0–30 months. The expression of 138 out of these 1650 genes were significantly downregulated (List D), whereas the expression of 140 genes were significantly upregulated (List U) after both 6 and 30 months with a nominal p value <0.05. Thus, we identified a total of 278 genes (List D+List U) that were similarly changed after 6 and 30 months of treatment with fluticasone±salmeterol compared with placebo (figure 3). To assess whether these treatment-associated changes in gene expression were due to differences in inflammatory and epithelial cell numbers, we adjusted for changes in the number of neutrophils, eosinophils, macrophages, lymphocytes, mast cells and epithelial cells in bronchial biopsies. A total of 87% and 83% of the 278 genes remained significantly associated with treatment after 6 and 30 months, respectively. To determine whether the presence of salmeterol in addition to fluticasone in a subgroup of our treatment patients influenced the analysis, we also modelled airway gene expression in patients treated with fluticasone and with fluticasone/salmeterol separately and found that more than 97% of treatment-induced gene expression changes were concordant, that is, changed in the same direction after 6 and 30 months of treatment in both treatment groups. Finally, we found that a higher baseline expression of 11 out of the 138 List D genes was associated with a less severe airflow obstruction, as reflected by FEV1% predicted at baseline (nominal p value <0.05). Vice versa, a higher baseline expression of 18 out of the 140 List U genes was associated with a more severe COPD.

Heat map showing the changes in expression of the 278 genes (List D, downregulated and List U, upregulated) that are significantly affected after (A) 0–6 and (B) 0–30 months of treatment with fluticasone±salmeterol compared with placebo.
Validation of treatment effects in a separate treatment arm within GLUCOLD
To validate the association of gene expression in patients with COPD treated with fluticasone, we used microarray data from 21 patients in the fourth treatment arm of GLUCOLD consisting of treatment with fluticasone for 6 months followed by 24-month placebo. After 6 months of treatment with fluticasone, a total of 77 of the List D (downregulated genes, 56%) and 78 of the List U (upregulated genes, 56%) changed both significantly (nominal p value <0.05) and in the same direction as shown in the primary analysis. A total of 50 of the 278 genes significantly changed both in the same direction after 6-month fluticasone treatment and in the opposite direction after fluticasone withdrawal (table 2 and see online supplementary figure S1).
List of 50 genes that changed significantly after both 6 and 30 months of treatment with fluticasone±salmeterol and could be confirmed in the fourth GLUCOLD treatment arm by both a change in the same direction after 6 months fluticasone treatment and a change in the opposite direction after fluticasone withdrawal
Association between long-term (between 0 and 30 months) changes in gene expression and rate of decline in FEV1 and SGRQ
To further investigate the relationship between the magnitude of treatment-induced changes in gene expression and the clinical response to treatment, we investigated whether patients with more pronounced gene expression changes had a better improvement in FEV1 and health status, as reflected by the total Saint George Respiratory Questionnaire (SGRQ) score, than those with more modest treatment-induced gene expression changes. We did not find any gene for which a higher change in expression after 6 months was associated with better improvement in FEV1. In contrast, a more pronounced change in the expression of 42 of the List D (downregulated genes, 30%) and 8 of the List U (upregulated genes, 6%) was associated with a lower rate of decline in FEV1 between 0 and 30 months with a nominal p value <0.05 (see online supplementary table S1). In addition, a more pronounced change in the expression of 26 of the List D and 29 of the List U genes was associated with a lower rate of decline in SGRQ between 0 and 30 months with a nominal p value <0.05 (see online supplementary table S2). Finally, a more pronounced change in the expression of 18 of the List D and 3 of the List U genes was associated with both a lower decline in FEV1 and SGRQ. To further investigate the effects of treatment on gene expression in association with clinical improvement, we performed a cluster analysis in patients treated with fluticasone±salmeterol based on the change in expression of these 18 List D and 3 List U genes (figure 4A). Next, we selected ‘treatment responders’ and ‘treatment non-responders’ as demonstrated in figure 4A. Treatment responders had a lower decline in SGRQ between 0 and 30 months than treatment non-responders (p=0.003) or patients treated with placebo and tended to have a lower decline in FEV1 (p=0.06) (figure 4B and C).

(A) Hierarchically clustered heat map showing changes in the expression of the 18 List D and 3 List U genes of which a higher magnitude of change in expression was associated with both a lower decline in forced expiratory volume in one second (FEV1) as well as Saint George Respiratory Questionnaire (SGRQ) between 0 and 30 months. Only patients treated with fluticasone±salmeterol were included. Treatment responders and non-responders were selected based on a cluster analysis. (B) Treatment responders had a better long-term SGRQ than treatment non-responders and chronic obstructive pulmonary disease patients treated with placebo and (C) tended to have a better long-term FEV1 than treatment non-responders.
PCR validation of candidate gene expression changes with treatment that associate with therapeutic response
PCR measurements were performed on the six genes for which the treatment-induced change in expression between 0 and 30 months was most strongly associated with the change in FEV1: cellular retinoic acid-binding protein 2 (CRABP2), B-cell lymphoma protein 2/adenovirus E1B 19kD interacting protein like (BNIPL), adenosine triphosphate (ATP)-binding cassette subfamily A (ABC1), ATP-binding cassette subfamily A member 12 (ABCA12), dual oxidase maturation factor-1 (DUOXA1), grainyhead-like 3 (GRHL3) and protein phosphatase, Mg2+/Mn2+ dependent, 1 K (PPM1K). Measurements were performed in both the baseline and 30-month time point samples from four patients treated with placebo and four patients treated with fluticasone±salmeterol. PCR of all genes changed in the same direction, the fold difference between treatment with fluticasone±salmeterol versus placebo ranging from −9.52 to+10.85 (see online supplementary figure S2).
Functional analyses of gene expression signatures
In order to explore the biological pathways reflected in the gene expression signatures, GSEA was performed. The GSEA results for gene sets representing Kyoto Encyclopedia of Genes and Genomes (KEGG) pathways are summarised in online supplementary table S3 and the supplementary file ‘listofKEGGpathwaygenes.pdf’. Guided by our findings of enrichment for pathways involved in cell–cell and cell–extracellular matrix interactions from this analysis, we performed literature mining to compose a gene set consisting of genes involved in epithelial barrier function (see online supplementary table S4). Significant enrichment was observed for epithelial barrier function genes among those with increased expression following 30-month treatment (figure 5A).

Gene set enrichment analysis (GSEA). (A) Enrichment of genes involved in epithelial barrier function among upregulated genes after treatment with fluticasone±salmeterol. The colour bar indicates the genes ranked according to their change in expression after 30-month treatment with fluticasone±salmeterol (blue representing a treatment-induced decrease and red an increase in gene expression). The vertical bars indicate the epithelial barrier function genes with the location of the bar indicating the occurrence of that gene within the ranked gene list and the height of the bars indicate the running GSEA enrichment score. (B) Genes being downregulated with treatment (List D) are significantly enriched among genes that are expressed at higher levels in an independent data set of airway epithelium from patients with chronic obstructive pulmonary disease (COPD) relative to non-COPD controls (GSEA false discovery rate (FDR) <0.001).9 Similarly, genes upregulated after treatment with fluticasone±salmeterol (List U) are significantly enriched among genes that are expressed at lower levels in patients with COPD in this independent data set (GSEA FDR <0.001). The colour bar indicates the genes ranked according to their association with COPD (blue represents a decrease and red an increase in gene expression in COPD). The vertical bars indicate the genes with a significant increase or decrease in expression after 30-month treatment with fluticasone±salmeterol in Groningen and Leiden Universities study of Corticosteroids in Obstructive Lung Disease, with the location of the bar indicating the occurrence of that gene within the ranked gene list and the height of the bar the running GSEA enrichment score.
Treatment-related changes in airway gene expression associate with COPD disease activity in an independent cohort
In order to evaluate whether the treatment-related changes in airway gene expression from GLUCOLD are associated with disease activity in an independent cohort, GSEA was performed on a whole-genome gene expression data set derived from bronchial brushings of smokers with (n=87) and without (n=151) COPD.9 Figure 5B shows that genes being downregulated with treatment (List D) are significantly enriched among genes that are expressed at higher levels in an independent data set of airway epithelium from patients with COPD relative to non-COPD controls (GSEA FDR<0.001). Similarly, genes upregulated after treatment with fluticasone±salmeterol (List U) are significantly enriched among genes that are expressed at lower levels in patients with COPD in this independent data set (GSEA FDR <0.001, figure 5B). In addition, we assessed which of the 278 List D and List U genes were differently expressed in COPD versus controls. A total of 39 of the 138 List D genes were upregulated in COPD, whereas 21 of the 140 List U genes were downregulated in COPD (FDR q value <0.05 (see online supplementary table S5 and figure S3).
Additional information
All microarray data from samples in this study have been deposited in gene expression omnibus under accession #36221. Of the 101 COPD patients included in the GLUCOLD study, bronchial biopsies were available in only 65 subjects at 30 months. It could be argued that this may have caused a selection bias in favour of drug treatment, since clinically worse patients drop out and adherent subjects do better. For this reason, we analysed the baseline clinical characteristics of the 65 patients from whom bronchial biopsies were available versus the remaining 36 patients (see online supplementary table S6). Both groups had a comparable severity of their COPD, which makes a selection bias in favour of drug treatment unlikely.
Discussion
Our study has identified 278 genes that change in expression after treatment with fluticasone±salmeterol versus placebo in patients with moderate-to-severe COPD.
We validated these treatment-associated changes in gene expression in a separate study arm consisting of 21 patients who received fluticasone for 6 months followed by treatment withdrawal. We found that a more pronounced treatment-induced downregulation of gene expression was significantly associated with a lower rate of decline in FEV1 as well as health status measured with the SGRQ. In addition, gene expression profiling in an independent COPD-control data set showed that the fluticasone-induced pattern of gene expression was the converse of the one associated with the presence of COPD. Thus, fluticasone-induced gene expression mirrored that of non-COPD patients. Together our findings suggest that inhaled fluticasone alters the expression of genes related to COPD disease activity.9 These observations are consistent with the clinical benefits of fluticasone observed in the GLUCOLD trial.6
Many of the treatment-induced gene expression differences associated with clinical improvement occur in genes involved in functions relevant to COPD. For example, DUOXA1 induces oxidative stress by generation of hydrogen peroxide via regulation of dual oxidase-1 (DUOX1).10 Oxidative stress, in turn, activates the inflammatory response by activation and subsequent nuclear localisation of nuclear factor kappa-light-chain-enhancer of activated B cells. In line with this, DUOX1 expression was reported to be increased in airway epithelial cells from COPD patients and rendered them more susceptible to rhinovirus infection.10 Thus, our observation that treatment with fluticasone±salmeterol reduces DUOXA1 expression may help to explain why ICS are clinically effective in flare-ups of the disease, as, for example, reflected by the number of exacerbations in COPD.
Further, we observed a reduced expression of transmembrane serine protease (TMPRSS)-4 and TMPRSS11 after treatment with fluticasone±salmeterol. Both TMPRSS4 and TMPRSS11 cleave haemagglutinin, which facilitates viral entry and spread in human (bronchial) epithelial cells in vitro.11 In addition, TMPRSS4 induces ‘epithelial to mesenchymal transition’ (EMT) in epithelial cells.12 The latter may contribute to COPD pathogenesis, since EMT may play a role in airway remodelling.13 Similar to TMPRSS4 and TMPRSS11, ABCA12 and GRHL3 exert their effects in epithelial cells, which are increasingly being recognised to be of importance in COPD.14–18 The latter is in line with our GSEA results showing that genes downregulated after treatment are enriched for the KEGG pathway ‘epithelial cell signalling’, whereas upregulated genes are enriched for the KEGG pathway ‘focal adhesion’ and ‘gap junction’ and our self-composed gene list related to epithelial barrier function. Finally, both a reduced BNIPL and an increased PPM1K expression reduce apoptosis.19 ,20
Taken together, our results indicate that treatment with fluticasone±salmeterol decreases the expression of genes involved in epithelial cell signalling, oxidative stress, remodelling and apoptosis, whereas it increases the expression of genes involved in epithelial barrier function.
The strengths of our study include the long-term follow-up, the repeated bronchial sampling and the randomised four-arm design, allowing for an internal validation set.6 A total number of 50 out of 278 genes could be validated in the fourth treatment arm. This should be considered a surprisingly high number, especially since these genes were actually validated two times: (1) they changed in the same direction after 6-month fluticasone treatment and with 6-month and 30-month fluticasone or fluticasone/salmeterol treatment and (2) they reversed towards baseline after fluticasone withdrawal. There are also some limitations inherent in our study. First, bronchial biopsies were investigated containing a mix of both resident and inflammatory cell types. We previously reported that 30-month treatment with fluticasone±salmeterol reduces the number of macrophages, mast cells, CD4 and CD8 cells and increases the number of neutrophils and the percentage intact epithelium relative to placebo.6 Because these changes could potentially affect airway gene expression signatures, we repeated our analyses with adjustment for changes in inflammatory cell numbers and found that this had little effect on the results. Second, although all bronchial biopsies were immediately snap-frozen and stored at −80°C, some degree of RNA degradation had already occurred as reflected by relatively low RIN scores, especially for the more remote samples collected in the study; we therefore adjusted for RNA integrity in all analyses. Nevertheless, we are confident that our data are reliable since treatment-induced changes in gene expression were consistent between the 6 and 30 months time points and were validated in the fourth GLUCOLD study arm and additionally with PCR. Finally, the effect of treatment with ICS on the annual rate of decline in FEV1 was larger in the GLUCOLD study than in earlier studies. A possible explanation for this may be that the GLUCOLD study was carried out in steroid-naïve subjects. Therefore, the problem of selective drop-out by subjects, who thought that the placebo did not work as well as the treatment they had before the study, was prevented. In addition, the majority of patients in the GLUCOLD study demonstrated airway hyperresponsiveness as well as a modest reversibility of FEV1.6 ,21
In conclusion, we performed longitudinal genome-wide gene expression analysis on bronchial biopsies of well-characterised COPD patients who participated in a randomised placebo-controlled trial with a long follow-up of 30 months. Our findings support the paradigm of a molecular ‘field of injury’ in the airway of smokers with COPD and provide evidence, for the first time, that this field of injury is dynamic with COPD treatment and holds the potential to serve as an intermediate marker of therapeutic efficacy.22 ,23 It has also provided much needed insight into the biological pathways that reflect and potentially mediate treatment-induced clinical improvement in COPD.
References
Supplementary materials
Supplementary Data
This web only file has been produced by the BMJ Publishing Group from an electronic file supplied by the author(s) and has not been edited for content.
Files in this Data Supplement:
- Data supplement 1 - Online supplement
Footnotes
-
AS and DSP shared last authorship and contributed equally.
-
Contributors MvandenB had full access to all the data in the study and takes responsibility for the integrity of the data and accuracy of the data analyses. In addition, he contributed to the study concept and design and interpretation of the data. Finally, he wrote the first draft of the manuscript. KS contributed to the study concept and design, supervised the data analyses and interpretation and contributed to the writing and editing of the manuscript. WT, PSH and PJ S contributed to the study concept and design, data analyses and interpretation and the writing and final editing of the manuscript. IHH, GL and YOA contributed to the methodology of RNA extraction, microarray hybridisation and PCR validation. In addition, they contributed to the writing and editing of the manuscript. ML, AS and DSP supervised the study concept and design, data analysis and interpretation and the writing and final editing of the manuscript.
-
Funding This study was funded by unrestricted grants from the Stichting Astma Bestrijding, the Netherlands Asthma Foundation, Netherlands Organization for Scientific Research (ZonMw), GlaxoSmithKline, the Royal Dutch Academy of Sciences and Arts, the University Medical Center Groningen and Leiden University Medical Center and the NIH R01 HL095388 (Spira/Lenburg).
-
Competing interests None.
-
Patient consent Obtained.
-
Ethics approval Ethics committee of the University Medical Center Groningen.
-
Provenance and peer review Not commissioned; externally peer reviewed.