Article Text

Abstract
Background: Exogenous doses of 60 mg/kg α1-antitrypsin (AAT) every 7 days are recommended in patients with severe AAT deficiency. However, long term administration of weekly doses is not well accepted by patients. Using pharmacokinetic simulations, we evaluated whether steady state minimum concentrations of total AAT can be maintained above the threshold of 0.5 g/l with longer intervals between doses.
Methods: Several sets of exogenous AAT versus time simulations were studied using a non-linear mixed effect approach with dosage regimens every 7, 14, 21, and 28 days. For each regimen the mean exogenous AAT trough concentrations and 5/95th percentiles were determined. The results obtained were applied to estimate the individual optimal dose at 7, 14, and 21 days in six patients using Bayesian analysis.
Results: The simulations showed that a dose of 50 mg/kg AAT every 7 days was sufficient to obtain nadir concentrations. Doses of 120 and 100 mg/kg every 14 days were also adequate, but 180 mg/kg given every 21 days required total AAT monitoring to avoid underdosage. Longer intervals were inappropriate. Dosage individualisation confirmed that AAT infusions given every 14 days maintained the nadir level of 0.5 g/l without a significant dose increase compared with current practice. When the time span between doses was fixed at 21 days, a mean relative AAT dose enhancement of 91% and 13%, respectively, was required to achieve sustained total AAT concentrations above the target level for 100% and 85% of the interval between doses.
Conclusions: It is feasible to extend the interval between doses of AAT to 14 or 21 days to achieve adequate trough total AAT concentrations. This study might be used as a starting point for clinical evaluation of the regimens described.
- AAT, α1-antitrypsin
- CL, clearance
- CminSS, expected exogenous minimum AAT concentration at steady state conditions
- α1-antitrypsin deficiency
- dosage
- population pharmacokinetics
- replacement therapy
Statistics from Altmetric.com
- AAT, α1-antitrypsin
- CL, clearance
- CminSS, expected exogenous minimum AAT concentration at steady state conditions
Alpha-1-antitrypsin (AAT) deficiency is a hereditary disorder which, in homozygous (PI*ZZ) form, is associated with serum AAT concentrations below 35% of normal values and an increased risk of pulmonary emphysema.1
Because of the shorter life expectancy of symptomatic individuals with AAT deficiency,2,3 intravenous augmentation treatment with periodical infusions of human exogenous AAT has been recommended.4,5 In the late 1980s Wewers et al4 reported that an exogenous AAT infusion of 60 mg/kg given once a week maintained serum total AAT concentrations above 0.8 g/l during the whole interval. Based on epidemiological studies, a value of 0.8 g/l determined by radioimmunodiffusion or 0.5 g/l by nephelometry appeared to provide adequate protection to the lungs. Regulatory agencies and guidelines therefore recommend weekly doses of 60 mg/kg to treat patients with symptomatic AAT deficiency.5 However, because of the inconvenience to patients of lifelong weekly administrations, other strategies have been suggested including more frequent doses administered at home6 or extending the interval between doses to 14, 21, or 28 days. More frequent administrations facilitate the maintenance of plasma AAT concentrations above the target level but require permanent venous access which increases the risk of infectious adverse events.
We hypothesize that the individual optimal drug dose and/or interval between doses to reach the recommended threshold of 0.5 g/l total serum AAT can be assessed by Bayesian analysis using a population pharmacokinetic approach. A study was therefore undertaken to determine whether intervals between AAT doses of more than 7 days were effective in maintaining steady state total AAT levels above the accepted protective threshold (nephelometry 0.5 g/l) for the entire interval between doses.
METHODS
Study design and population pharmacokinetic model
Several scenarios were simulated in which a specified exogenous dose of AAT was administered in a multiple dose regimen. The doses tested were 50 and 60 mg/kg/7 days; 100 and 120 mg/kg/15 days; 150 and 180 mg/kg/21 days, and 250 mg/kg/28 days. The 60 mg/kg/7 days regimen was included as a reference point since it is the dose recommended by the ATS/ERS guidelines.5
Pharmacokinetic data (exogenous AAT concentrations from the replacement therapy versus time) were simulated in NONMEM-V7 by applying a two compartment pharmacokinetic model with intravenous infusion (3 hours) and first order elimination.8 The model is given in full detail in Appendix 1. Data on the population mean and inter-individual variability of the pharmacokinetic parameters from an intensive pharmacokinetic study (after a single dose infusion of 120 mg/kg) in a comparable population was used to perform the simulations.6 In our study, inter-individual variability was only considered on drug clearance (coefficient of variation 15%). Several sets of 1000 simulated pharmacokinetic profiles were generated for the different dosing schemes.
The Hospital Clínic research ethics committee approved the protocol and written informed consent was obtained from each patient.
Example of dosage adjustment
Dosage optimisation was carried out in six patients with severe AAT. All subjects had been receiving replacement therapy for a mean period of 73 months (range 28–113 months) in a dosage regimen of 180 mg/kg/21 days (1 g/40 ml Prolastina, Bayer Healthcare, Barcelona, Spain).
Optimal AAT doses were individually established with interdose intervals of 7, 14 and 21 days by Bayesian analysis (detailed in Appendix 2) using the above described population pharmacokinetic model and the individual total baseline AAT concentration. The optimal dose regimen for each patient was chosen to maintain trough total AAT levels above 0.5 g/l, taking into consideration the longest interval of administration and the total amount of exogenous AAT closest to the recommended dose of 60 mg/kg/7 days or equivalent (120 mg/kg/14 days or 180 mg/kg/21 days). Previously published reports showed no differences between endogenous and manufactured AAT in elimination half life.9 We therefore decided to measure total serum AAT concentrations because the recommended target of 0.5 g/l refers to the total AAT concentrations (native plus exogenous AAT).5
Patients were then scheduled for drug administration and at least five trough samples were obtained at steady state conditions and analysed by nephelometry. This information was subsequently used to establish the most convenient individualised dosage regimen to achieve total AAT levels above 0.5 g/l at different fractions of the whole interdose interval chosen—that is, 85% and 100% of interval between doses.
Statistical analysis
Statistical analysis was performed using S-Plus 6.1 for Windows (Insightful Corporation, Seattle, USA). Mean (SD) values were calculated for continuous variables. Mean, 5% and 95% intervals were computed for the simulations.
RESULTS
Simulations
Taking into account a mean pretreatment AAT concentration of 0.24 g/l, a mean exogenous AAT trough concentration of at least 0.26 g/l was considered necessary for simulations to achieve total AAT trough concentrations above 0.5 g/l. The results of the simulations are shown in table 1.
Expected exogenous minimum AAT concentrations at steady state (SS) conditions (CminSS) obtained from 1000 simulations expressed as mean, 5th and 95th percentiles. Expected total AAT concentrations (exogenous plus native) are shown in brackets
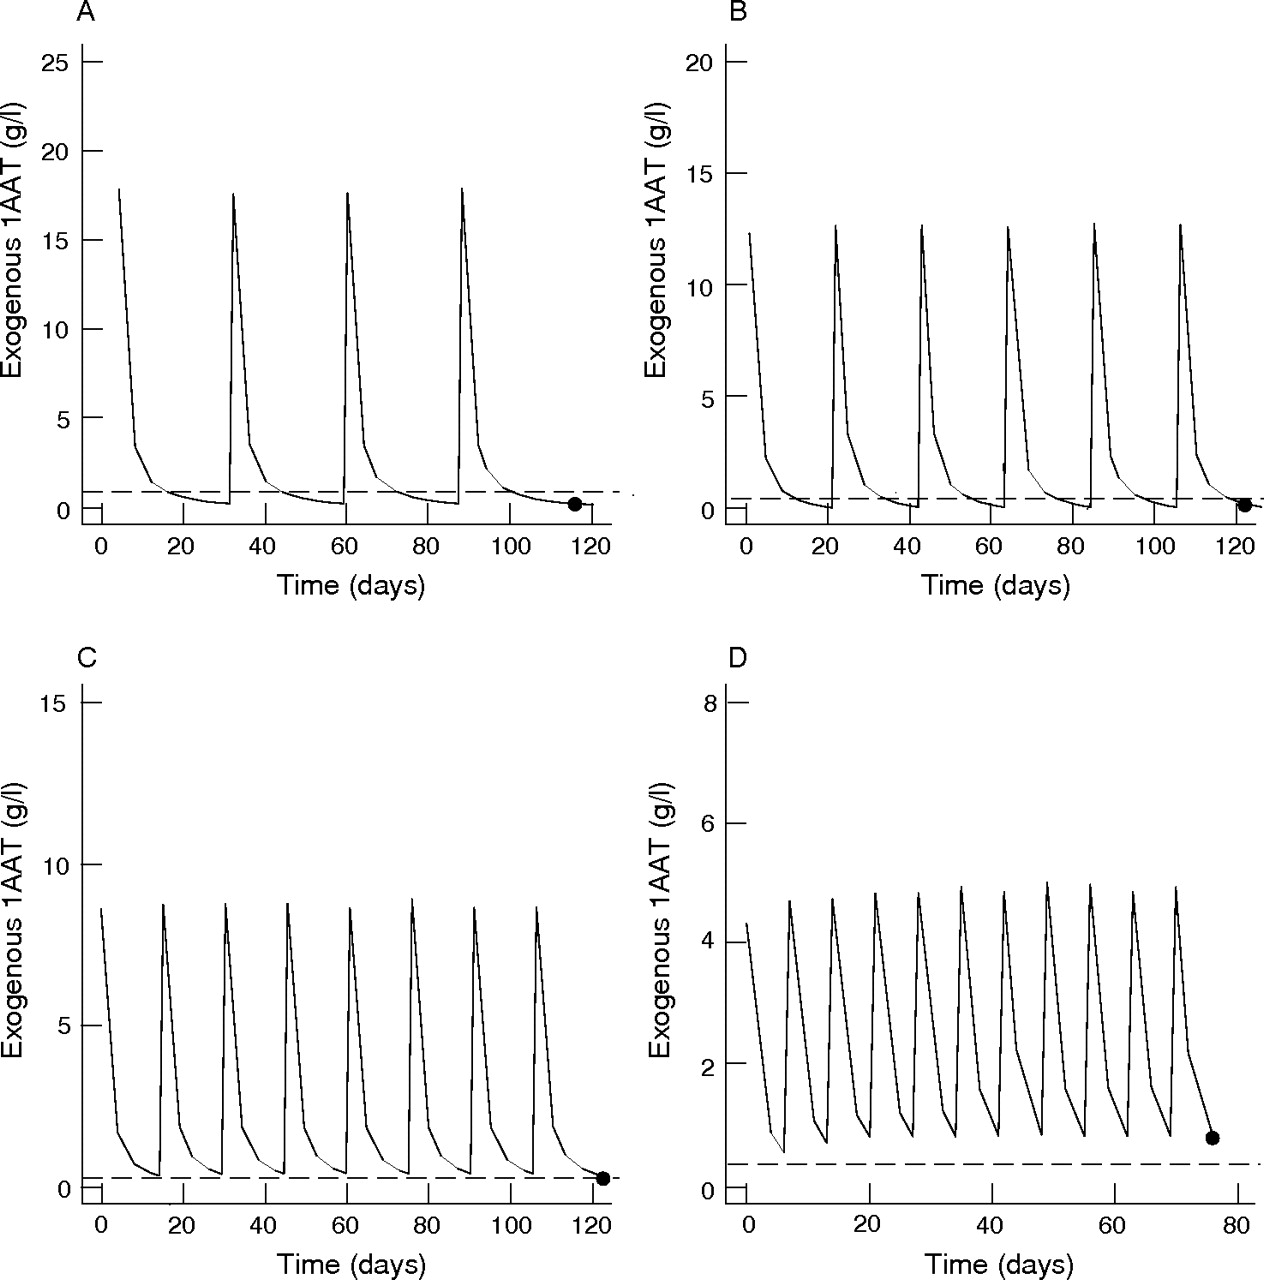
A dose of 60 mg/kg AAT every 7 days was likely to yield a mean exogenous AAT trough concentration of 0.73 g/l and, consequently, total AAT trough concentrations were much higher than the 0.5 g/l target (fig 1D). Furthermore, even weekly administrations of 50 mg/kg appeared to be sufficient to obtain protective trough concentrations. When doses of 120 mg/kg and 100 mg/kg were given every 2 weeks the mean exogenous AAT trough concentrations were 0.34 g/l and 0.28 g/l, respectively (fig 1C), which resulted in total AAT trough concentrations of 0.58 g/l and 0.52 g/l. Thus, both regimens resulted in mean total AAT trough concentrations above the target level. However, the 5th percentile of the total AAT trough concentrations (in brackets) showed values below 0.5 g/l for both regimens (0.40 g/l and 0.36 g/l for 120 mg/kg and 100 mg/kg, respectively). The cut-off point of total AAT trough concentrations of at least 0.5 g/l was achieved by up to 85% and 75% of the 1000 simulated profiles with the aforementioned regimens. A dose of 180 mg/kg administered every 21 days provided a mean exogenous AAT trough concentration of 0.23 g/l (fig 1B), slightly below the target level. It is evident that this regimen was not able to sustain total AAT trough concentrations above the chosen target, and almost 50% of patients could be expected to have unprotected total AAT levels at day 21. Longer intervals such as 28 days were clearly unsatisfactory because the estimated exogenous AAT trough concentration (0.19 g/l) was far from the exogenous AAT target level (fig 1A).

Simulated (N = 1000) serum exogenous AAT concentrations (g/l) with different intravenous infusion schedules. CminSS (•), expected exogenous minimum AAT concentrations at steady state conditions. Solid line, mean exogenous AAT concentrations. (A) 250 mg/kg/28 days (CminSS = 0.19 g/l); (B) 180 mg/kg/21 days (CminSS = 0.23 g/l); (C) 120 mg/kg/14 days (CminSS = 0.34 g/l); (D) 60 mg/kg/7 days (CminSS = 0.73 g/l). Dashed line, 0.26 g/l.
Dosage optimisation
Based on the previous results, dosage optimisation was performed in six patients to obtain their optimum dose at different dose schedules. All patients had been receiving augmentation therapy for at least 1 year before the study. The characteristics of these patients are shown in table 2.
Characteristics of patients: pretreatment (PreT) and baseline (BTr) total AAT concentrations (measured by nephelometry and expressed in g/l)
Patient 1, with YYbarcelona phenotype ((256) Asp-His; (391) Pro-His),10 expressed extremely low endogenous serum AAT concentrations (0.09 g/l). Excluding this patient, the mean (SD) pretreatment total AAT concentration was 0.24 (0.01) g/l and the mean (SD) steady state baseline total AAT trough concentration (resulting from their previous treatment regimens) was 0.34 (0.03) g/l. After computing the individual pharmacokinetic parameters by Bayesian analysis, the optimal dose for each interval of administration (7, 14 and 21 days) was obtained for each individual. A target total AAT trough concentration of 0.5 g/l was selected to obtain the optimal dose.
The following regimens were chosen: (1) two-weekly dose of 7 g for patient 2, 9 g for patient 3, 7 g for patient 4, 8 g for patient 5, and 6 g for patient 6; and (2) in only one case (patient 1) was a weekly dose of 4 g necessary. Patients 5 and 6 did not accept more frequent administrations and continued with treatment every 3 weeks. The dose expected to maintain the total AAT trough concentrations above 0.5 g/l for at least 85% of the interdose period (18 of 21 days) was tested. As expected, the results showed total AAT trough concentrations to be above 0.5 g/l in all patients except patients 5 and 6 (0.41 g/l and 0.44 g/l, respectively). On the whole, these adjusted dosage regimens were able to enhance the total AAT trough concentrations from a mean of 0.30 g/l to 0.48 g/l (table 3).
Adjusted dosage regimens, total AAT trough concentrations, patient measurements at baseline and after dosage adjustment (in g/l), and difference between both measurements (Δtotal AAT CminSS)
Implementation of the optimal dose at 21 day intervals would have resulted in increased total doses of Prolastina (ΔOD21) of between 45% in patient 6 and 175% in patient 1 (table 2). On the other hand, reducing the interval from 21 to 14 days was not accepted by most patients. The best dose hypothetically to maintain total AAT concentrations above the desired nadir levels during at least 85% of the whole interval—that is, 18 out of 21 days (D21/85) or 12 out of 14 days (D14/85) was therefore identified. The regimens chosen for each patient are shown in table 4.
Dose for each individual (in g) at different scheduled intervals (14 or 21 days) to obtain appropriate serum AAT concentrations during 85% of the interval between doses
For patient 1 the D14/85 schedule was preferred and in the remaining individuals the regimen D21/85 was adopted. In two cases the D21/85 schedule coincided with the previous dose of 180 mg/kg/21 days administered, and in the remaining four the total dose increased by 7.7%, 17%, 25% and 40% in patients 3, 5, 1, and 2, respectively, compared with the previous standard regimen.
In addition, the predictive performance of our pharmacokinetic model was assessed by comparison of the observed (OBS) total AAT trough concentrations after five infusions of the D21/85 (or D14/85 for ID1) and the individual predicted (IPRED) total AAT trough concentrations under this model. Bias and precision were calculated and expressed in terms of percentage prediction error (PE%) and absolute percentage prediction error (APE%), respectively,11 as follows:
PE% = [(OBS – IPRED)/IPRED] * 100
APE% = [|(OBS –IPRED)/IPRED|] * 100
The mean bias and precision were −1.9% and 5.4%, respectively; both of which were close to the ideal value of zero.
DISCUSSION
The application of Monte Carlo simulations based on population pharmacokinetic concepts can be especially valuable to test treatments for rare diseases such as AAT deficiency.12 These simulations provide a new tool when insufficient subjects are available to detect the benefits of a given treatment in a standard clinical trial due to issues of statistical power. We therefore applied this methodology to determine the suitability of the extended dosage regimens requested by our patients. A tri-compartmental pharmacokinetic model seems to be the most plausible for describing exogenous AAT disposition in the body.9 However, in most of the published exogenous AAT pharmacokinetic analyses, the lack of intensive data during the first 2 hours after exogenous AAT administration makes it difficult to characterise the first rapid phase. A simpler bi-compartmental pharmacokinetic model has therefore been applied with no real loss of accuracy.6,13 Moreover, pharmacokinetic data in healthy volunteers, untreated Pi*ZZ patients, and treated patients showed no differences in the AAT elimination half life between endogenous and manufactured AAT.9 Thus, only exogenous AAT was considered in our simulations. Exogenous AAT (type M) is assumed to be more functional than endogenous AAT (type Z), so it seems reasonable to use exogenous AAT serum concentrations to monitor treatment. However, the use of exogenous AAT as an end point has two drawbacks: (1) it is not feasible to distinguish between exogenous and native AAT with the usual analytical techniques; and (2) it would require a predefined threshold for exogenous AAT concentrations which has not been established. Since the recommended target of 0.5 g/l refers to the total serum AAT concentration,5 this was used to customise dosage regimens in our study. The baseline information (mean pharmacokinetic parameters and their inter-individual variability) required to simulate our data under the population pharmacokinetic model was obtained from Piitulainen et al.6 Although simulating pharmacokinetic responses by using data derived from a few individuals may be risky,6 it is acceptable due to the low level of inter-individual variability found in pharmacokinetic parameters. In any case, as a sensitivity analysis we modified the value of the mean population clearance by 20%. The results of this exercise are shown in Appendix 3.
The results of the simulations show that the pharmacokinetic properties of infused AAT in regimens of 120 mg/kg/14 days and 180 mg/kg/21 days do not achieve trough total AAT concentrations equivalent to the recommended dose of 60 mg/kg/7 days (0.58 g/l, 0.47 g/l, and 0.97 g/l, respectively). However, regimens of 50 mg/kg/7 days and 120 mg/kg/14 days seem to be effective in maintaining total AAT trough concentrations above 0.5 g/l during the entire interdose interval in roughly 85% of patients in the latter and 100% in the former. In contrast, 3 weekly and 4 weekly administration of replacement therapy requires very high doses to achieve the desired threshold for most patients. By reducing our goal to provide adequate trough total AAT concentrations for 85% of the time between doses, we were able to reduce the required dose considerably, with the potential drawback of not providing protection to the lungs on 3 of 21 days or 2 of 14 days, depending on the regimen.
The current recommendation for replacement therapy is the administration of weekly doses of 60 mg/kg, based on their ability of achieve serum and epithelial lining fluid concentrations of AAT considered to be protective.4,5 In 20 patients using this regimen, trough levels lower than 1 g/l were not observed.14 In a larger study in 445 patients, the median trough total AAT level was 0.95 g/l.15 In both cases they were measured by radioimmunodiffusion, with a protective threshold of 0.8 g/l.5 These results concur with our simulations, which show that weekly doses of 60 mg/kg (or even 50 mg/kg) provided adequate trough serum levels for most patients. However, this approach to treatment requires lifelong weekly intravenous infusions, a significant burden for those receiving and administering this treatment. In fact, data from the National Heart, Lung and Blood Institute (NHLBI) registry showed that only 33% of patients on replacement therapy were receiving weekly infusions at the end of follow up.16
The administration of replacement therapy every 2–3 weeks could be an acceptable solution if adequate total AAT trough concentrations can be achieved. One pharmacokinetic study suggested that a 2 weekly infusion of 120 mg/kg AAT could provide protective nadir total AAT concentrations.9 In addition, a previous study in 14 patients receiving infusions every 2–3 weeks at a dose of 120–180 mg/kg resulted in trough levels above 0.6 g/l in all cases.17 The same group reported a study in 23 patients treated with 120 mg/kg every 2 weeks for 10 infusions.18 Their results agreed with ours; trough total AAT levels measured by nephelometry after nine infusions ranged from 46.7 to 76.6 mg/dl, almost all being clearly above 0.5 g/l as predicted by our population pharmacokinetic model. Despite these results, the authors complained that 2 weekly infusions did not maintain appropriate nadir serum levels, considered to be higher than 0.8 g/l in their study. This discrepancy results only from the threshold chosen, since the new ATS/ERS guidelines for the management of patients with AAT deficiency clearly indicate that a trough serum level of 0.5 g/l measured by nephelometry can be considered as the goal of replacement therapy,5 and this was the level used in our study.
Obviously, the inability to reach the recommended biochemical target can be solved by increasing the total dose. However, this would dramatically increase the consumption of a limited resource and the costs of treatment,19 particularly when one considers that only 5–10% of individuals with this deficiency are diagnosed and treated.5,20–22 It is of note that, in the NHLBI registry, up to 30% of individuals did not receive treatment because of financial issues.16
We found that it was possible to reduce the total dose significantly if we aimed to maintain protective levels at only 85% of the interdose interval. As an example of the application of our population pharmacokinetic model, these so-called D21/85 doses were individually estimated and prescribed to our patients (except patient 1 who received the D14/85).
Some published data are available which support the use of extended regimens of treatment even if total AAT is not sustained above the threshold for a short period of time between doses. In the late 1980s Hubbard et al23 investigated the efficacy and safety of monthly administration of 250 mg/kg AAT over a 12 month period. Their results showed that, although the treatment was safe, the total AAT levels exceeded the protective threshold for an average of only 25 out of 28 days. Nonetheless, an increase in nadir antineutrophil elastase capacity was seen in the epithelial lining fluid throughout the study in a small subgroup of patients.23 Moreover, a clinical study showed that AAT given in a dose of 250 mg/kg for 28 days inhibited the annual loss of lung tissue compared with placebo (differences approaching statistical significance; p = 0.07), despite unprotective total AAT concentrations being observed for a mean of 5 of the 28 days (18% of the interval between doses).24 Our simulations also confirm that 4 weekly doses of 250 mg/kg would theoretically maintain total trough AAT concentrations for 22 of the 28 days.
Undoubtedly, the main objective of replacement therapy is to maintain trough concentrations above the protective level but, with the lack of definitive evidence of the relationship between biochemical and clinical efficacy, our results are based on total trough serum AAT levels according to the current guidelines.5 The results of predictive accuracy and precision support the validity and the further utility of the proposed pharmacokinetic model to estimate the individual optimal dose at any given schedule. We believe that the present data represent a new and relevant contribution to achieving a better dosage regimen for augmentation therapy in patients with AAT deficiency.
One possible limitation of the study is that we did not obtain epithelial lining fluid concentrations of AAT because it is difficult to justify repeated bronchoalveolar lavage in patients with severe emphysema. Previous studies have already provided convincing evidence of the good relationship between serum total AAT levels, epithelial lining fluid AAT concentrations, antielastase activity in the epithelial lining fluid,4,13,25 and a reduction in bronchial inflammation.26 International guidelines therefore recommend the use of trough serum AAT concentrations for monitoring augmentation therapy.5
In summary, our results show that protective serum total AAT concentrations (>0.5 g/l) may be achieved with weekly administration of 60 mg/kg or even 50 mg/kg, and with 2 weekly administration of 120 mg/kg. The use of the D21/85 regimen may be acceptable in patients not able to attend the clinic or to receive frequent infusions since this dose results in important savings compared with the optimal dose every 21 days. However, the potential impact of not achieving protective serum levels of AAT for 15% of the interval between doses is not known and should be taken into account. This study is a first step to evaluating pharmacokinetic/pharmacodynamic relationships which could aid in improving augmentation therapy in patients with AAT deficiency. Further larger studies are needed to evaluate other important biological and clinical parameters in patients receiving different treatment regimens.
APPENDIX 1
The concentration at time t: C(t) in a two-compartment model is associated with a bi-exponential decline as follows828:

in which D is the administered dose (mg); Vc is the volume of distribution at the central compartment (L); k12 is the fractional rate constant from the central compartment (1) to the peripheral compartment (2) (/h); k21 is the fractional rate constant from the peripheral compartment (2) to the central compartment (1) (/h); α is the initial half life representing mainly distribution (h); β is the second decay half life representing elimination (h); and ε(t) is a normally distributed error with mean zero and variance σ2. In this study a proportional error model was applied for residual variance on drug concentrations. Re-parameterisation of this model to more physiologically comprehensible parameters such as drug clearance (CL) is widely accepted.
In our particular model, the population pharmacokinetic parameters (P) are population typical clearance (CL), population typical volume of distribution of the central compartment (Vc), population typical inter-compartment clearance (Q) defined as: (k12 * Vc) or (k21 * Vp), and population typical volume of distribution at steady state (VSS), which is (Vc + Vp). Inter-individual variability was included only on CL and modelled as log normally distributed. Thus, consider the following model for a generic pharmacokinetic parameter:
P = μP * exp(ηP)
in which μP is the population mean of P (in this special case P = CL) and ηP is a normally distributed random effect with mean 0 and variance ω2, capturing the inter-individual variability of P.
APPENDIX 2
Individual pharmacokinetic parameter estimates can be obtained by minimising the Bayesian objective function28:

where Ppop is the population mean of a generic parameter P; Pi is the individual expected average of parameter P; Var(Pi) is the variance of the estimated parameter P; Cobs is the observed concentration; Ci corresponds to a predicted concentration; and Var(Ci) is the variance of the predicted concentration.
According to the former formula, this methodology takes into account information of the population pharmacokinetic parameters (mean and their variability) as well as predicted and observed concentrations along with the residual error.
APPENDIX 3
The results after increasing/decreasing the mean population clearance (CL) by 20%, which is the pharmacokinetic parameter that most influences trough serum AAT concentrations, are shown in the following tables.
When a 20% lower mean CL is used (table 5), dosage regimens every 2 or 3 weeks appear to be sufficient. In contrast, and as expected, when a 20% higher mean CL value is applied, only weekly regimens showed good results (table 6).
CL 20% lower than CL reported by Piitulainen et al6
CL 20% higher than CL reported by Piitulainen et al6
These data should be analysed with caution since the “real” data (from Piitulainen et al) show very low values of inter-individual variability in the pharmacokinetic parameters (around 12%), suggesting that a notable similarity exists regarding the pharmacokinetic behaviour of AAT between patients presenting with AAT deficiency. Changing their values by as much as 20% therefore means that we are introducing a source of variation that does not really exist in patients with AAT deficiency.
REFERENCES
Footnotes
-
Published Online First 23 August 2006
-
MM is a member of AIR.
-
Supported in part by grants from Fundació Catalana de Pneumologia (Beca FUCAP-Almirall Prodesfarma 2005) and a grant from the Alpha One International Registry (AIR).
-
DS, CR, BL, CE, and AT have no financial relationship with any commercial entity interested in the subject of this manuscript. MM received honoraria for consultancy from Bayer Healthcare Biologicals and Grifols.