Article Text

Abstract
Background: Coronary heart disease (CHD) was an important epidemic in many developed countries in the 20th century and there is concern because the epidemic has affected Eastern Europe, Russia and Central Asia and is starting to affect developing countries.
Methods: The epidemic curves of CHD mortality for 55 countries, which had reliable data and met other selection criteria, were examined using age-standardised death rates 35–74 years from the World Health Organization. Annual male mortality rates for individual countries from 1950 to 2003 were plotted and a table and a graph used to classify countries by magnitude, pattern and timing of its CHD epidemic.
Results: The natural history of CHD epidemics varies markedly among countries. Different CHD patterns are distinguishable including “rise and fall” (classic epidemic pattern), “rising” (first part of epidemic) and “flat” (no epidemic yet). Furthermore, epidemic peaks were higher in Anglo-Celtic countries first affected by the epidemic, and subsequent peaks were less, except for the recent extraordinary epidemics in Russia and Central Asian republics. There were considerable differences among some continental or regional geographical areas. Eastern European, South American and Asian countries have quite different epidemic characteristics, including shorter epidemic cycles.
Conclusions: It cannot be assumed that WHO regions or any other geographical regions will be useful when analysing CHD epidemics or deciding upon strategic policies to reduce CHD in individual countries. The needs for action that are urgent in some countries are less so in others, and even regional country groups can have quite different epidemic characteristics.
Statistics from Altmetric.com
The 20th century epidemic of coronary heart disease (CHD) in many developed countries attenuated or nullified increases in life expectancy from improvements in nutrition and control of communicable disease. For example, in Australia life expectancy in males did not increase for 25 years (1945–1970) because of the epidemic of CHD.1 CHD epidemics have also affected Eastern Europe and the former Soviet Union (FSU).2 There is also growing recognition of the huge personal, social and economic cost of CHD in developing nations.3 4 CHD was the first cause of death in the world in 2004 and is predicted to remain so until 2030, accounting for 14% of all deaths.5 Over 40% of CHD deaths are among people aged less than 75 years.6 In countries undergoing economic transition and in developing countries, where preventive and treatment services are limited and primary care is under-developed, the strategic response has been slow. In particular, efforts to control the upstream factors that predispose to CHD have been very limited.7
It is common to categorise the CHD epidemic by region.8 However, if one examines the CHD epidemic even in Europe, it is apparent that the epidemics in France and southern Europe differ in both magnitude and pattern from those in the United Kingdom and Finland.9 10 In Asia, CHD mortality is similar in Hong Kong and urban China, but Thailand and South Korea differ.11 In South America, too, the CHD epidemic varies by country. CHD is declining in Argentina, Chile and Cuba, but increasing in Mexico and levelling off in Colombia.12 13
There are other within-region paradoxes of CHD mortality that have yet to be explored. Some of these differences may be the result of variation in cause of death certification and coding practices.14
The aim of the present study is to visualise the different patterns of the CHD epidemic in individual countries, so that the countries can be classified on the basis of the common features of their experience of the CHD epidemic. This should assist planners in allocating scarce resources between prevention and treatment of CHD versus HIV-AIDS, malnutrition, malaria, other infections, etc.
METHODS
Data and sources
The CHD mortality pattern (based on death certification) and the magnitude of the peak mortality were used to classify countries. Trends of mortality over time in various countries were also plotted.
The World Health Organization mortality data are based on official national statistics compiled and transmitted to WHO by health authorities in member countries. For those countries where vital registration systems cover only part of the country, WHO applies demographic techniques to estimate the level of completeness of mortality data in its calculation of death rates.15 Official death certification numbers for CHD for 55 countries were derived from the WHO database.15 Only countries with more than two million inhabitants in 2000, with not more than a 5-year gap in their data and with age-specific mortality and detailed population figures were included. All population and mortality data were used as reported by WHO. For Brazil, population data were available for the whole country before 1986: between 1986 and 1995 only population data for southern, southeastern and central western regions were available which were aggregated to represent the population of Brazil for this study.
The international trends of CHD mortality data were derived primarily from the WHO Statistical Information System (WHOSIS) online database.15 Alternatively, the hard copy data, Annual Epidemiological and Vital Statistics,16 17 were used when data were not available online. When the absolute numbers of CHD deaths were reported, estimates of the resident populations for the corresponding calendar period were extracted from the same WHO databank whenever available and from the United Nations Common Database otherwise.18 The WHO standard population was then used for direct age-standardisation of rates for the population aged 35–74 years.19
During the calendar periods considered (1950–2003), five revisions of the International Classification of Diseases (ICD6-10) occurred (table 1). To minimise problems of classification and data comparability over time, all CHD events recorded as atherosclerotic heart disease (420, 422) in the sixth and seventh revisions of the ICD, and ischaemic heart disease (410–414) in the eight and ninth revisions were combined with those of the 10th revision (I21–I25) of the ICD.
For calendar years with missing CHD mortality data, up to 5-years’ extrapolations were made if there was no ICD change in the period. To account for possible mortality discontinuities related to ICD revisions, changes in rates in subsequent calendar periods were checked; apart from Switzerland none of them was relevant and no adjustments were made. Switzerland used ICD8 until 1994 and switched to ICD 10 thereafter, and was excluded from this analysis.
The ICD codes of CHD have been considered comparable since the eighth revision.9 20 The decline in CHD epidemics started in some countries in 1968 when ICD 8 was in place. Thus, it is unlikely that the peak mortality, epidemic pattern and the present classification have been affected systematically across different countries.
Analysis
CHD patterns of 55 countries were classified in a matrix. Columns were based on shape as “rise and fall”, “rising only” and “flat or stable”. We have grouped those few countries that had data that show only falling CHD mortality, as “rise and fall”, assuming there was an earlier rise. In the rows, countries were divided by peak male mortality rates per 105: over 400, 200–399, 100–199 and <100.
To simplify presentation and comparisons only male mortality is shown. In general, female CHD mortality was around half of the age-standardised male mortality for each country and showed a similar pattern. Four to six countries in the same region or subregion were plotted together in contrasting colours. For some countries data were not available from 1950 and only became available later. Figure 1 shows Anglo-Celtic countries (excluding North America) and Europe, figure 2 shows countries of North, Central and South America; figure 3 shows the FSU states and figure 4 shows Asian countries.

Age-adjusted secular trend of coronary heart disease in Anglo-Celtic countries and Europe 1950–2000.

Age-adjusted secular trend of coronary heart disease in North (top), Central (middle) and South (bottom) America 1950–2000.
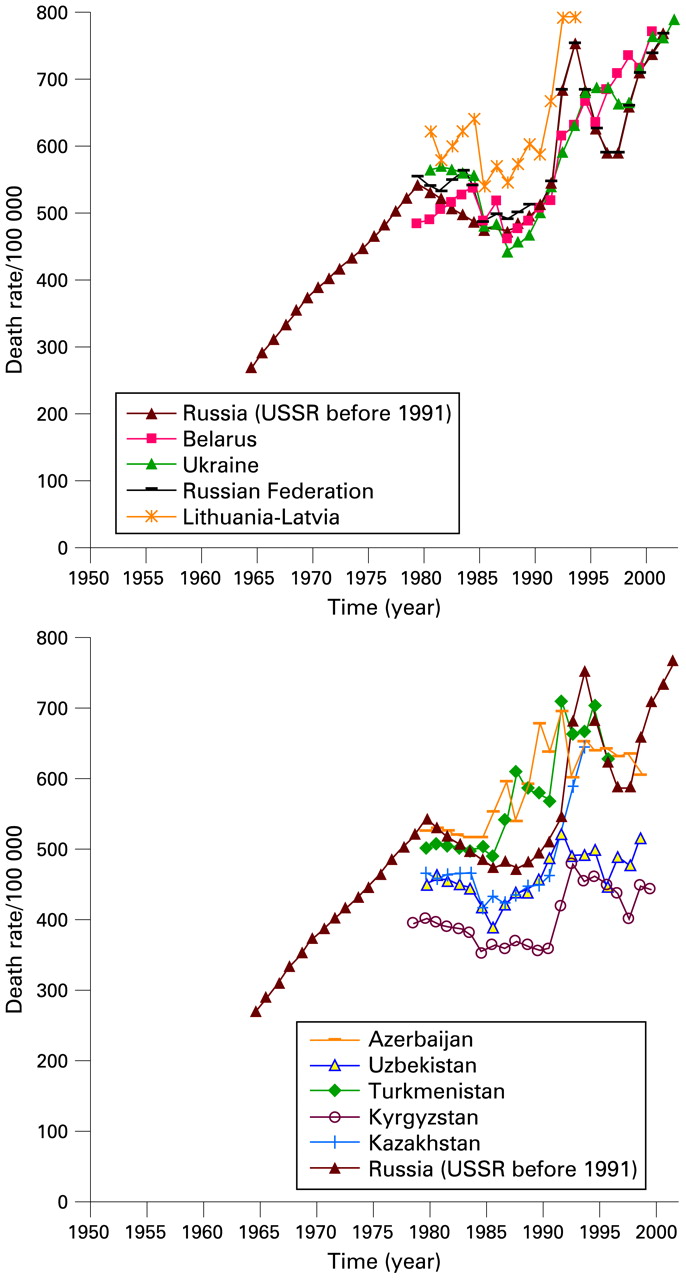
Age-adjusted secular trend of coronary heart disease in the former Soviet Union states 1965–2000.

Age-adjusted secular trend of coronary heart disease in Asia 1950–2000.
Joinpoint regression analyses are preferred by some research workers as an objective method of identifying peak points where the linear slope of a trend changes significantly.12 21 22 Joinpoints were analysed with the Joinpoint software version 3.2.0 from the US National Cancer Institute (Bethesda, MD, USA; www.srab.cancer.gov/joinpoint). The software uses a Monte Carlo permutation test to identify points when the trend line changes in magnitude or direction significantly.23 Up to three joinpoints for each series were considered, assuming a Poisson distribution as is conventional with mortality data. However, minimum numbers of significant joinpoints were selected. The joinpoints corresponding with a significant decline in the CHD mortality rate were chosen as the peak epidemic points.
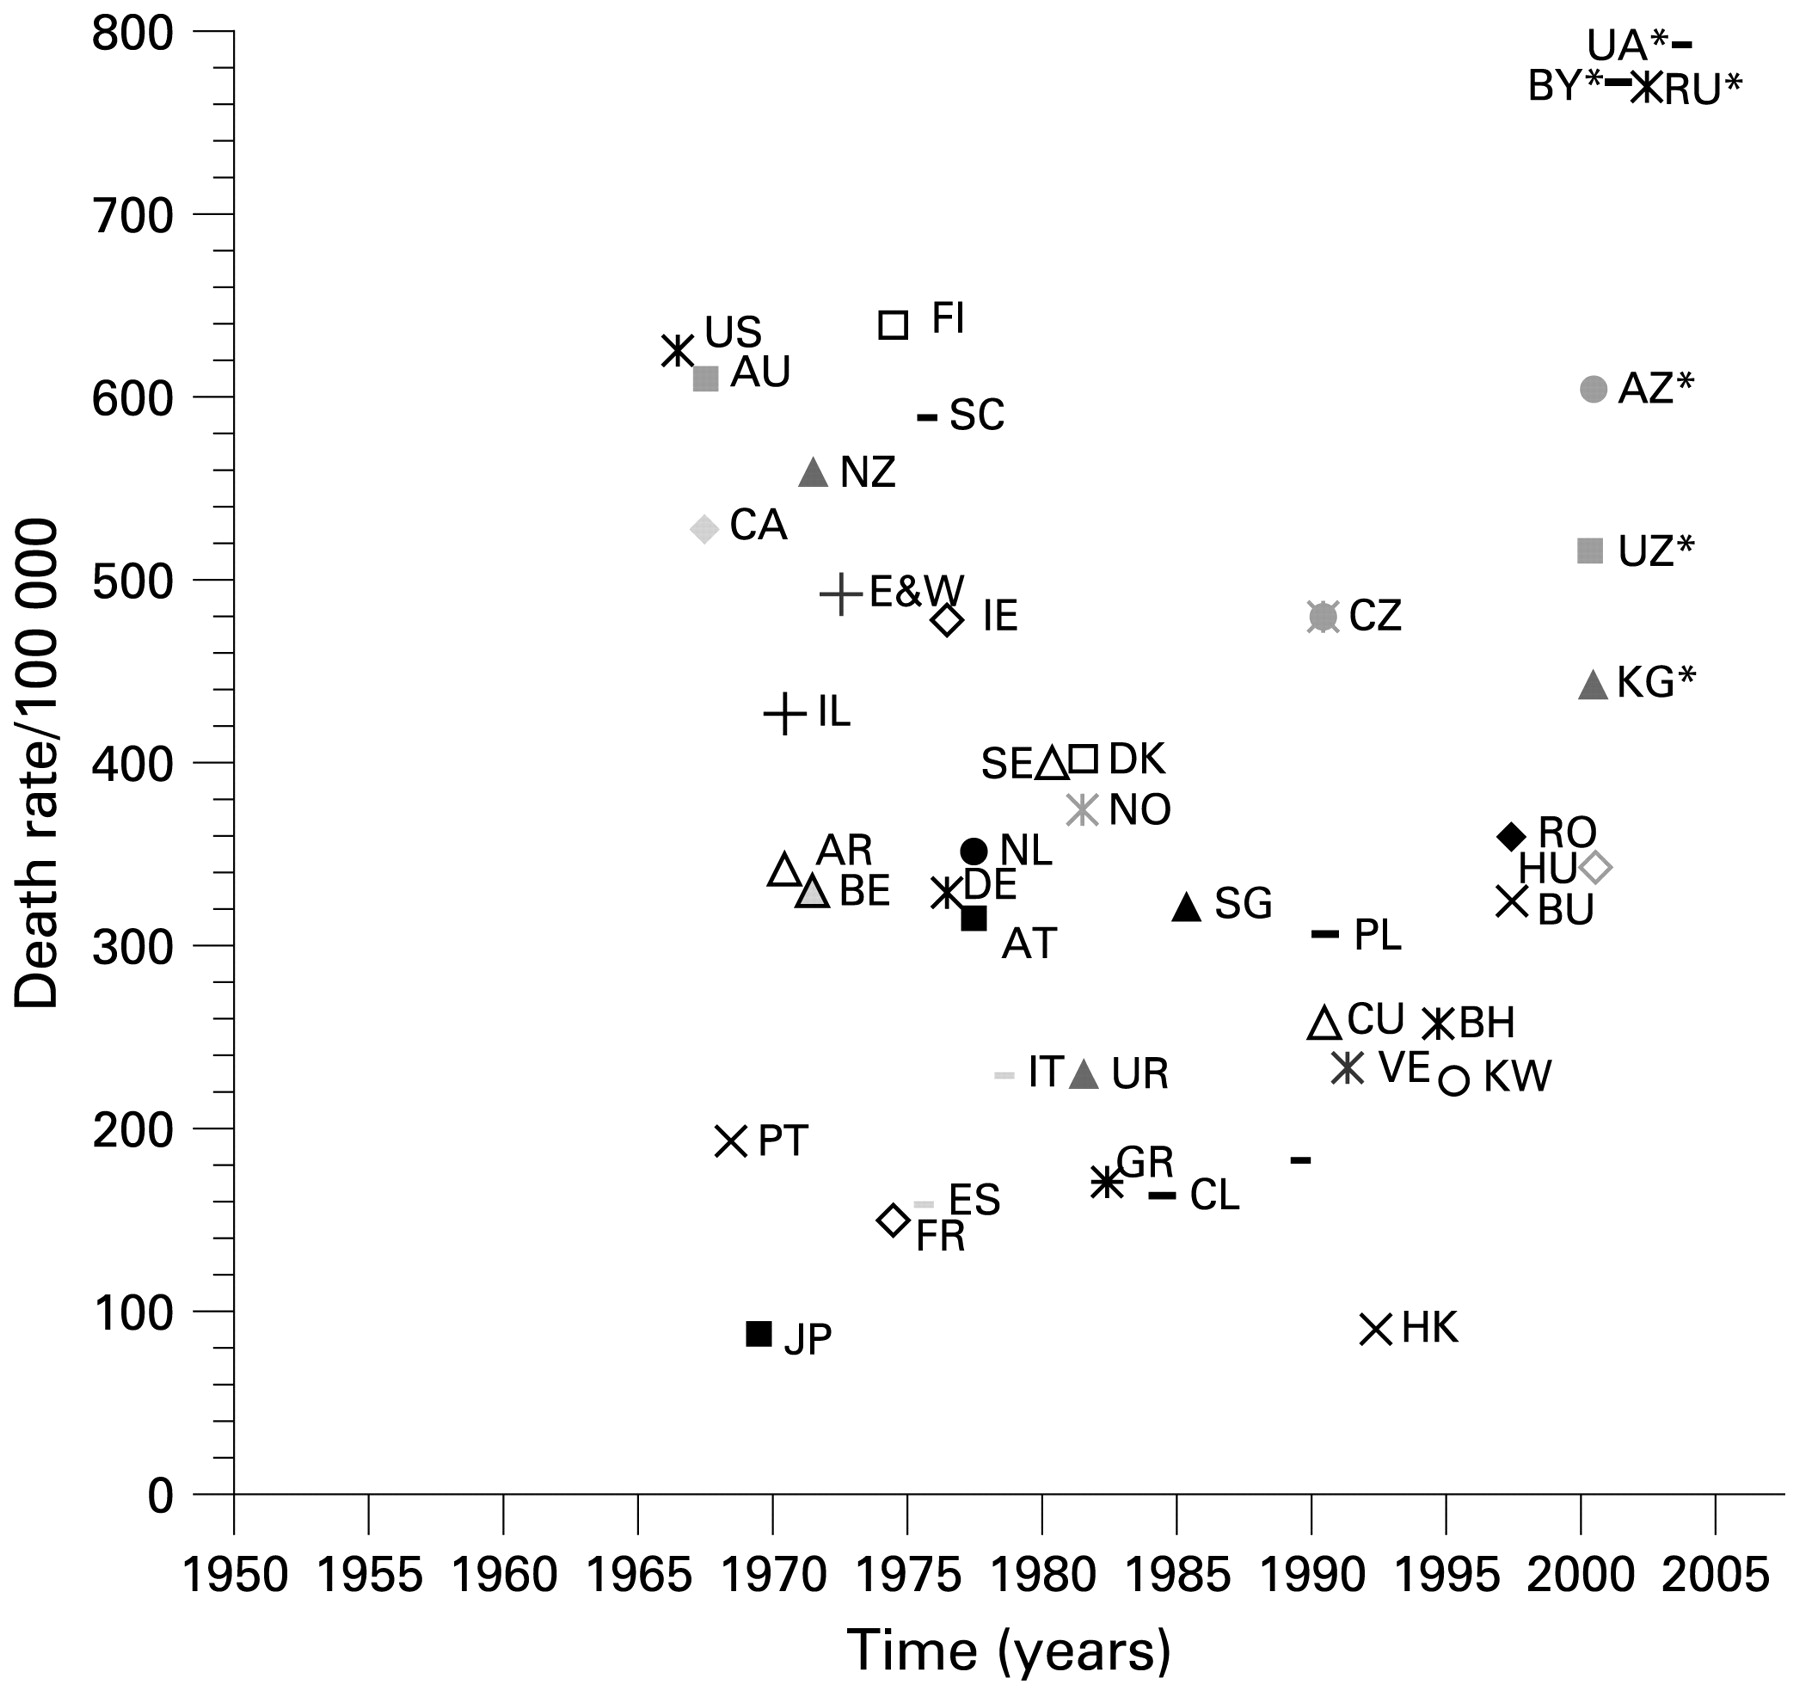
The peaks or highest numbers for CHD mortality in 40 countries in CHD epidemic between1950–2000 were plotted. On the vertical axis the magnitude ranges from under 100/105 to over 800/105. Timing of the peak, on the horizontal axis according to joinpoint regression, ranged from 1966 to 2000, a span of 34 years.
RESULTS
Australia, New Zealand and Scotland had a higher peak than England and Wales (fig 1). The decline in Australia started in the same year as in Canada (fig 2), nearly a decade before that in England and Wales.
Among western continental European countries (fig 1), especially in France, mortality has been lower than in Anglo-Celtic countries, and the declines from lower, more diffused peaks have not been as steep.
Among Nordic countries, Finland stands out; at its peak it had the highest CHD mortality in the world, followed by a steep fall in mortality after 1970 (fig 1). Three other Nordic countries had similar patterns, but their peaks were only about 60% those of Finland. Denmark, Norway and Sweden have had remarkably similar CHD mortality throughout the period analysed.
The European Mediterranean countries (fig 1) have had CHD mortality similar to that of France. Rise and fall of CHD mortality is difficult to observe in the graph. In Greece, CHD mortality was higher after 1975 than before, but has decreased slightly after 1982.
CHD mortality rose in East European countries until the late 1980s, and has, since then, clearly declined in Poland, Bulgaria, Czech Republic, Hungary and later Romania. Russian CHD mortality continues to rise, with significant swings in the 1990s, and by 2002 was the highest recorded ever in the world, along with some Central Asian republics (fig 3).
The patterns for the United States and Canada are close, although the two countries’ health systems and health bureaucracies are quite different (fig 2). The peak was lower in Canada, but from 1978 to 2000 the two countries’ trend lines almost coincide. Among central and South American countries (fig 2), Argentina has had a striking decline in CHD mortality, a pattern after 1970 similar to Netherlands and Norway. Peru has continued with very low CHD mortality and without an obvious epidemic. Cuba’s CHD mortality was more than double that of Mexico, but Cuba’s rate has been declining since 1990, while Mexico has shown a slow, gradual increase over the last three decades.
The European and Central Asian republics that emerged from the FSU all continued to have high and increasing CHD rates, up to 2002, unlike Poland, Hungary, etc (fig 3). The same occurred in the central Asian countries (fig 3), with the highest rates in Azerbaijan and Turkmenistan, and somewhat lower rates in Kyrgyzstan, though even here rates are nearly double the North American rates in 2000.
Japan’s CHD mortality (fig 4), was around 100 per 105 until 1968 and then exhibited a gradual decline, followed by a slight late upturn in the 1990s. CHD mortality in Singapore was relatively high compared to Japan but has been declining since 1985, and the CHD mortality in the Philippines has been increasing. A CHD epidemic may be starting in South Korea.
A CHD mortality rate in Hong Kong is similar to urban China (fig 4). Rural China has lower CHD mortality, and rates have remained very low in Thailand.
Figure 5 and table 2 condense this information. The magnitude of CHD mortality ranges from 787/105 in Ukraine to about 25/105 in Thailand. The timing of peaks, calculated by joinpoint regression, started in 1966 (United States) and extended to 2000.

Coronary heart disease mortality epidemic peaks and maxima in various countries in males 35–74 years (age-standardised). AR, Argentina; AT, Austria; AU, Australia; AZ, Azerbaijan; BE, Belgium; BH, Bahrain; BR, Brazil; BU, Bulgaria; BY, Belarus; CA, Canada; CL, Chile; CU, Cuba; CZ, Czech Rep; DE, Germany; DK, Denmark; E&W, England and Wales; ES, Spain, FI, Finland; FR, France; GR, Greece; HK, Hong Kong; HU, Hungary; IE, Ireland; IL, Israel, IT, Italy; JP, Japan, KG, Kirgizstan; KW, Kuwait; NL, Netherland; No, Norway; NZ, New Zealand; PL, Poland; PT, Portugal, RO, Romania; RU*, Russian Federation; SC, Scotland; SE, Sweden; SG, Singapore; UA, Ukraine; UR, Uruguay; US, USA; UZ, Uzbekistan; VE, Venezuela.* Mortality has not reached to a discernable peak by 2003.
Table 2 is a matrix of CHD epidemic patterns in 55 countries that were analysed, including some countries that are not included in figures 1–4. The matrix shows how countries from different regions can have similar epidemic patterns.
Figure 5 shows the dynamic of CHD mortality epidemic peaks and maxima in various countries that experienced a decline over the past four decades. No peak can be plotted yet for countries whose CHD has not yet clearly declined. CHD mortality of the Russian Federation and some Central Asian republics are now higher than previous peaks ever recorded. The last available CHD mortality rate of these countries was added to figure 5 to demonstrate this phenomenon.
DISCUSSION
In the mortality data available, there is considerable diversity apparent in the epidemics of CHD mortality among countries in pattern, magnitude and timing. This is particularly obvious in the developing countries of Asia and South America, and also in some FSU states. Three main CHD patterns are distinguishable: “rise and fall” (classic epidemic), “rising” (first part of the epidemic) and “flat” (no epidemic yet). The magnitude of peak epidemics (where a downturn is recognisable) varies between 85/105 in Japan to 638/105 in Finland, and the timing varies from 1966 in the US to 2000 in Hungary. In the “rising” group (first part of the epidemic), the highest CHD mortality is in Ukraine (787/105) in 2003 and the lowest in Mexico (118/105) in 2000.
Countries in the same geographical area, continent or WHO region may well be different. The CHD epidemic patterns in the concerned countries, and probably other countries, are not the same. All countries are at different stages in the epidemic cycle and can be usefully classified according to magnitude of the epidemic and its pattern. Some developed Western countries (that is European Mediterranean and France) and developed Asian countries (such as Japan and Singapore) have had very modest epidemics.
Russian Federation, Belarus, Ukraine and Central Asian republics show the highest CHD mortality rates ever seen and are significantly higher than recognised high peaks in the United States, Australia, New Zealand, Finland and Scotland.2 In general, except for FSU states, countries that peaked later also peaked at lower levels—for example, Eastern and Central Europe, suggesting that they may have benefited from existing knowledge of causes and control of CHD.
Comparison of age-standardised CHD mortality rates between countries at any particular year (or triennium)—for example, Levi et al,9 gives a static picture of a moving phenomenon. It is important for policymakers to know whether a mortality rate is tracking up or down, or static. The timing of any peak can give clues whether therapeutic or community interventions are having effects.
Miscoding and classification changes of WHO mortality data can explain some of the variation over time and between countries. However, the pattern and peak magnitude of CHD in the present study is relatively consistent with other studies.9 11–13 20 24 Lozano et al have made a thorough study of the potential effect of miscoding and misclassification on CHD mortality data of 59 developed and developing countries.14 They estimate the fraction of CHD deaths that are assigned to ill-defined cardiovascular codes. With correction, the age-standardised death rates increased slightly in all countries and increased somewhat more in France, Japan and Greece. However, the relative CHD death rate among countries remained almost the same.14
In spite of the limitations of routine mortality data, their values for public health and health policy is substantial. As Rosenberg concluded: “No other health data source exists that is as universal in coverage, as standardized, uniform, and timely as mortality data from the vital statistics system. Mortality data continue, therefore, to be a key database for epidemiologic, demographic, and historic research and increasingly for public policy”.25
Comparison of CHD mortality across various developing countries has been made by other researchers.9 12 WHO mortality data for China are limited to 1985–1995; however, the Chinese national statistics show a similar trend until 2005.26 In comparison with other Asian countries, CHD mortality is much lower in Thailand, and this is consistent with the result of a cross-sectional electrocardiographic CHD incidence study in Thailand.27
The magnitude and peak points of CHD epidemics reported in this study may vary slightly from previously published reports and articles as the age groups, periods and methods of comparison and standardisation are different.28 For example, Byrington et al calculated the change in CHD mortality rate in Western industrialised countries from 1965 to 1975 using average of age-specific mortality rate of males and females 35–74 years, instead of age-standardised mortality rates, and found slightly different results.29 Other studies either did not report what population was used for age standardisation30 or only reported world population without specifying which world population distribution were used (for example, Segi or WHO).9 12 Using different world population distribution gives remarkably different age-standardised rates.19
The peak points of an epidemic may also vary owing to use of different methods of calculation, such as joinpoint regression, fitting quadratic curves or visual identification of peak points on trend lines based on three years’ moving average of the data.12 31
Different patterns of CHD epidemics in developing countries suggest that, while CHD is a global problem, no single strategy for its control is equally applicable in all countries at the same time. Prediction of this epidemic’s future moves in different countries might be possible based upon what happened to countries with a similar earlier pattern. Developing countries drawn from different geographical regions, but sharing the same pattern of the epidemic—for example, Mexico and the Philippines, might well share information and interventions to control CHD. Similar patterns of epidemics in a group of countries with similar cultural and/or language background—for example, figure 1 and figure 2, may represent the result of dissemination of useful control policies across such countries. But the “Western” (classic) pattern of CHD with high mortality is not a biological necessity, as can be seen in some of the data in figures 1 and 2—for example, Cuba. The pre-epidemic (stable) phase of the disease in some Asian and South American countries might suggest that the priorities of public health in these countries could be different from other countries of the same regions.
In conclusion, it cannot be assumed that WHO regions or any other geographical regions will be useful when deciding upon strategic launch-pads to control CHD in individual countries, because the epidemic curve can exhibit very different patterns in different countries in the same region. Instead of regions as the basic descriptor to draw countries together to find common ground in addressing the CHD epidemic, we propose grouping countries into “rise and fall” (classic epidemic), “rise only” and “flat”, further subdivided by magnitude and timing. Countries with similar patterns could share information and interventions even if they are in different regions. Where the CHD epidemic can be seen to be increasing there is a greater need for action.
REFERENCES
Footnotes
Funding: MM was supported by a National Health and Medical Research Council Program Grant (no 402793), on which he was a postdoctoral research fellow.
Competing interests: None.