Article Text

Abstract
Introduction Exposure to secondhand smoke (SHS) is associated with occult obstructive lung disease as evident by abnormal airflow indices representing small airway disease despite having preserved spirometry (normal forced expiratory volume in 1 s-to-forced vital capacity ratio, FEV1/FVC). The significance of lung volumes that reflect air trapping in the presence of preserved spirometry is unclear.
Methods To investigate whether lung volumes representing air trapping could determine susceptibility to respiratory morbidity in people with SHS exposure but without spirometric chronic obstructive pulmonary disease, we examined a cohort of 256 subjects with prolonged occupational SHS exposure and preserved spirometry. We elicited symptom prevalence by structured questionnaires, examined functional capacity (maximum oxygen uptake, VO2max) by exercise testing, and estimated associations of those outcomes with air trapping (plethysmography-measured residual volume-to-total lung capacity ratio, RV/TLC), and progressive air trapping with exertion (increase in fraction of tidal breathing that is flow limited on expiration during exercise (per cent of expiratory flow limitation, %EFL)).
Results RV/TLC was within the predicted normal limits, but was highly variable spanning 22%±13% and 16%±8% across the increments of FEV1/FVC and FEV1, respectively. Respiratory complaints were prevalent (50.4%) with the most common symptom being ≥2 episodes of cough per year (44.5%). Higher RV/TLC was associated with higher OR of reporting respiratory symptoms (n=256; r2=0.03; p=0.011) and lower VO2max (n=179; r2=0.47; p=0.013), and %EFL was negatively associated with VO2max (n=32; r2=0.40; p=0.017).
Conclusions In those at risk for obstruction due to SHS exposure but with preserved spirometry, higher RV/TLC identifies a subgroup with increased respiratory symptoms and lower exercise capacity.
- secondhand tobacco smoke
- COPD
- air trapping
- airflow obstruction
- obstructive lung disease
- respiratory symptoms
- expiratory flow limitation
- cardiopulmonary exercise
- maximum oxygen consumption
- pulmonary function testing
- quantitaive CT imaging
- mosaic perfusion
- low attenuation lung density
This is an Open Access article distributed in accordance with the Creative Commons Attribution Non Commercial (CC BY-NC 4.0) license, which permits others to distribute, remix, adapt, build upon this work non-commercially, and license their derivative works on different terms, provided the original work is properly cited and the use is non-commercial. See: http://creativecommons.org/licenses/by-nc/4.0/
Statistics from Altmetric.com
- secondhand tobacco smoke
- COPD
- air trapping
- airflow obstruction
- obstructive lung disease
- respiratory symptoms
- expiratory flow limitation
- cardiopulmonary exercise
- maximum oxygen consumption
- pulmonary function testing
- quantitaive CT imaging
- mosaic perfusion
- low attenuation lung density
Key messages
In this study of a cohort at risk for chronic obstructive pulmonary disease (COPD) due to prolonged (although remote) exposure to second-hand tobacco smoke but with normal spirometry, we found that lung volumes that represent air trapping, even when within the normal range, were associated with higher occurrence of respiratory symptoms and lower exercise capacity.
Our findings show that lung volume measurements provide an additional dimension to spirometry for characterisation and prognostication of obstructive lung disease in these individuals without overt COPD.
Introduction
The forced expiratory volume in 1 s (FEV1), forced vital capacity (FVC) and their ratio (FEV1/FVC) commonly define airflow obstruction.1 2 The widely used Global Initiative for Obstructive Lung Disease (GOLD) criteria require an absolute reduction in FEV1/FVC below 0.70 (stage 1), with higher stages of chronic obstructive pulmonary disease (COPD) defined by a concomitant reduction in FEV1 as a per cent predicted.3 There has been far less attention given to the diagnostic implications of other lung function abnormalities that could be markers of subtle airway disease in the absence of overt COPD.
Air trapping, defined as abnormal increase in volume of air remaining in the lungs at the end of spontaneous exhalation, is a manifestation of obstructive lung diseases.3–6 Although usually thought of as a consequence of airflow obstruction, air trapping can persist even after airflow obstruction (measured by FEV1 and FEV1/FVC) has improved, and thus may reflect additional pathophysiology beyond what is measured by these spirometric measures of airflow obstruction.7–9 Previous studies have documented that, in those with overt chronic airflow obstruction (abnormal FEV1/FVC), air trapping is associated with dyspnoea, exercise limitation and mortality.10–14 Others have shown that in smokers without GOLD-defined COPD, evaluation of air trapping and hyperinflation indices, beyond the commonly used spirometric indices, could avoid underestimation of clinically important physiologic impairment.15 16 Despite this, air trapping as measured by lung volumes often is not emphasised in the interpretation of lung function when spirometry findings are otherwise within normal limits.
In previous studies of never-smoking flight attendants with history of prolonged occupational exposure to secondhand tobacco smoke (SHS) in aircraft cabin, we found the exposed flight attendants to have decreased flow at low-lung and mid-lung volumes (forced expiratory flows at 25%–75% and at 75% of FVC (FEF25–75 and FEF75)) while having preserved spirometry (normal FEV1/FVC) and thus not meeting the spirometric criteria for COPD.17 18 In this study, we wished to examine the clinical significance of lung volumes representing air trapping as measured by the ratio of residual volume to total lung capacity (RV/TLC) in the same cohort. We hypothesised that in individuals at risk for COPD due to exposure to SHS but with preserved spirometry (normal FEV1/FVC and FEV1 by lower limit of normal (LLN) criterion), lung volumes reflecting air trapping (RV/TLC) define a phenotype with greater respiratory symptoms and lower exercise capacity. We further hypothesised that radiographic measurement of lung density attenuation consistent with radiographic ‘gas trapping’ will also be predictive of those outcomes.
Methods
Study overview
This was an observational, cross-sectional analysis of findings in a larger cohort of subjects with a range of SHS exposure.17 18 We used data from this cohort to examine the associations among airflow obstruction indices (FEV1/FVC, FEV1, FEF25–75 and FEF75), air trapping (RV/TLC and radiographic gas trapping), progressive air trapping (defined as an increase in either fraction of tidal volume (VT) that is flow limited on expiration (per cent of expiratory flow limitation, %EFL) or end-expiratory lung volume (EELV or functional residual capacity, FRC) during exercise), respiratory symptoms and exercise capacity (maximum oxygen uptake (VO2max) and maximum work achieved (Wattsmax)).
Study population
Between July 2007 and July 2015, we recruited US airline flight crewmembers as part of an investigation of the potential adverse health effects of the cabin environment on those employed before and after introduction of the ban on smoking in US commercial aircraft. Crewmembers were eligible to participate in the study if they had worked ≥5 years in aircraft. A referent group of ‘sea-level’ subjects who lived in San Francisco Bay area and had never been employed as airline crewmembers were also recruited. All subjects were non-smokers defined by never smoking or, in ever smokers, no smoking for ≥20 years and a cumulative history of smoking <20 pack-years. Overall, 440 subjects were enrolled in the larger cohort, of whom 49 did not undergo plethysmography and were not eligible for the current analysis. Otherwise eligible subjects were excluded if they manifested impaired spirometry (abnormal FEV1/FVC or FEV1 by LLN) (n=61), body mass index ≥30 kg/m2 (n=21), had no SHS exposure (n=26), or reported any known medical diagnosis that could have adversely affected their lung function (n=27). Overall, 256 eligible subjects with preserved spirometry were included in the study. Of those, 179 agreed and underwent cardiopulmonary exercise testing (figure 1). To examine the effect of air trapping during exercise, starting July 2013, subjects were offered an additional exercise protocol of inspiratory capacity (IC) and maximal expiratory flow (MEF) measurements at progressive levels of exercise for determination of %EFL and EELV (n=32). Additionally, to demonstrate radiographic ‘gas trapping’, subjects were offered and 23 agreed to undergo thoracic CT imaging using a low radiation protocol. Characteristics of the subgroups undergoing IC with MEF measurements and CT imaging are shown in online supplementary e-Table 1. Written institutional review board-approved informed consent was obtained from all participants.
Supplementary file 1

Subject flow. BMI, body mass index; EFL, expiratory flow limitation; FEV1, forced expiratory volume in 1 s; FVC, forced vital capacity; PFT, pulmonary function test; SHS, secondhand tobacco smoke; VO2max, maximum oxygen uptake; w, with; w/o, without.
SHS exposure characterisation
SHS exposure was characterised by a questionnaire developed by UCSF Flight Attendant Medical Research Institute (FAMRI) Center of Excellence,19 and modified to acquire information on airline-related occupational history, as described previously.17 18 Briefly, this included employer airlines, duration of employment and flight routes with quantification of ‘cabin SHS exposure’ as the number of years during which the crewmembers were exposed to SHS in aircraft. Other possible sources of SHS exposure were also explored by questioning subjects about their non-cabin exposures in additional settings, as described previously.20
Pulmonary function and cardiopulmonary exercise testing
Lung function measurement procedures are detailed in online supplementary e-Methods 1. Routine pulmonary function tests were performed in the seated position as described previously.17 Subjects performed symptom-limited, progressively increasing exercise tests in the supine position on a cycle ergometer as part of a separate study, which examined changes in diffusing capacity during exercise and required supine positioning.18 During this maximum VO2 testing, subjects were encouraged to continue exercise until a VO2 plateau effect on a breath-to-breath analysis of oxygen consumption was visually observed. Additionally, a subset of subjects underwent VT, IC and MEF measurements in seated position at increasing work rates corresponding to 20%, 40% and 80% of their VO2max as described previously.21 22 The volume of the VT that was flow limited on expiration (VFL) was measured on flow-volume loop graphics and used to calculate %EFL according to formula [(VFL/VT)*100] at each work rate. Similar methods were used to measure EELV (FRC) and RV (TLC-IC).
CT imaging of lungs
Two low-dose thoracic CT scans (at maximum inspiration (TLC) and maximum expiration (RV)) were completed on a subset of participants (online supplementary e-Methods 1). Lung density measurements were performed using ‘density mask’ technique23 by computing the per cent of voxels between −860 and −950 Hounsfield unit (HU) on 1 mm sections at RV scans to determine low attenuation areas (mosaic perfusion) that reflects gas trapping (LAAexp −860 to −950) as described previously.24–28 Low attenuation lung density areas below −950 HU on 1 mm sections at TLC scans (LAAinsp<−950) were also measured to examine presence of emphysema. A voxel threshold of ≥5% was used to define presence of gas trapping or emphysema on respective measurements.
Respiratory symptom scoring
Respiratory symptoms were assessed using modified Medical Research Council (mMRC) Dyspnea Scale and another self-reported internal questionnaire (FAMRI Center of Excellence questionnaire19) that elicited symptoms of dyspnoea, cough and subjects’ perception of a decreased level of exertion compared with peers over the year preceding enrolment. A dichotomous indicator of respiratory symptoms was defined by mMRC ≥1 or report of at least one respiratory symptom on the FAMRI questionnaire.
Data analysis
We examined correlations among airflow indices and RV/TLC using the Pearson partial correlation test controlling for covariates. Linear or logistic regression analyses were used to examine the association among lung function (airflow indices or RV/TLC) or LAAexp −860 to −950 as independent variables and respiratory symptoms or maximum observed work (VO2max and Wattsmax) as the dependent variable. Models were adjusted for age, sex, height and weight unless noted otherwise.
Measurements of %EFL, VFL, RV and EELV at maximum exercise are technically challenging to perform. As an alternative, we assumed the rates of increase in these variables to provide a proxy for their values at maximum exercise. Thus, the rates of increase in %EFL, VFL, RV and EELV were estimated by linear regression approach, and then used as independent variables to determine their contribution to maximum exercise achieved.
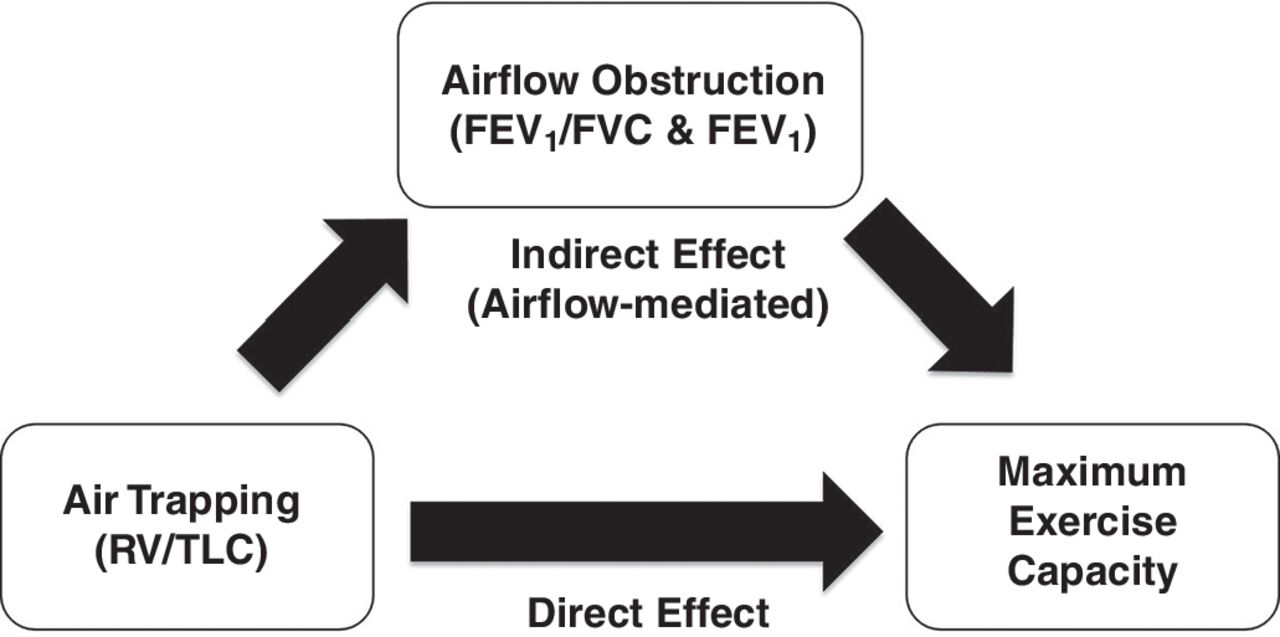
To assess whether association between VO2max and RV/TLC was mediated through airflow indices, we performed Sobel-Goodman mediation testing in ‘mediator models’29 with VO2max (dependent variable), RV/TLC (independent variable) and airflow indices (mediator variables), with inclusion of covariates (figure 2).

Mediation effect modelling diagram. Association of air trapping with maximum exercise capacity may be mediated through its effect on airflow indices. FEV1, forced expiratory volume in 1 s; FVC, forced vital capacity; RV, residual volume; TLC, total lung capacity.
We performed receiver operating characteristic (ROC) analyses to examine the suitability of airflow indices (FEV1/FVC and FEV1) and air trapping (RV/TLC) as predictors of respiratory symptoms and exercise capacity (VO2max). For respiratory symptoms, a binary variable of having or not having any symptoms was used in ROC analysis. For exercise capacity, a binary variable of low and high capacity was generated based on the ability to achieve the predicted VO2max (≥100% predicted value) and used in ROC analysis. To obtain comparable area under the curve (AUC) values, the predictor variables were given a negative sign if they were inversely associated with the outcome variable (eg, the value of RV/TLC was made negative for its contribution to VO2max). The AUC values from RV/TLC, FEV1/FVC, FEV1 and FRC (per cent-predicted values) were calculated with adjustment for covariates, and compared for their ability to discriminate between the binary outcomes. To construct risk groups, optimal cut-points of RV/TLC for each ROC analysis were calculated, and used to define at-risk and not at-risk groups.
Sensitivity analyses on effects from smoking or exceeding abnormal predicted limits for RV, TLC, FVC or FRC were done and results were congruent to primary results.
Results
RV/TLC had a wide variance and was not correlated with FEV1/FVC in subjects with preserved spirometry
Subject characteristics for the 256 participants included in the analysis are shown in table 1. The subjects were predominantly women (232 (90.6%)) and never smokers (230 (89.8%)) and among those who had smoked, the median (IQR) amount of smoking was 4.0 (3.0–13.8) pack-years. All subjects had past exposure to SHS. The prevalence of exposure to cabin and non-cabin SHS was 62.9% and 93.3%, respectively. One subject had FVC below LLN, and four had TLC below LLN (online supplementary e-Table 2). The subgroup of subjects who underwent exercise testing (n=179) was slightly younger with less average SHS exposure and otherwise was similar in characteristics (table 1).
Subjects’ characteristics
FEV1/FVC was inversely correlated with RV/TLC (correlation coefficient (r)=−0.34; p<0.001); however, this correlation was no longer present after controlling for age, height, weight and sex (partial correlation coefficient (rp)=−0.01; p=0.896) (online supplementary e-Table 3). Additionally, the inverse correlation between FEV1 and RV/TLC was moderate when adjusted for covariates (rp=−0.37; p<0.001) (online supplementary e-Table 3). Consistently, the RV/TLC, although within the predicted normal limits, manifested a wide range of observed values with an average span of 22.4%±13.1% and 16.0%±7.9% across the increments of FEV1/FVC and FEV1, respectively, corresponding to coefficient of variation (SD-to-mean ratio) ranges of 13.6%–27.8% and 11.1%–32.9% (figure 3).
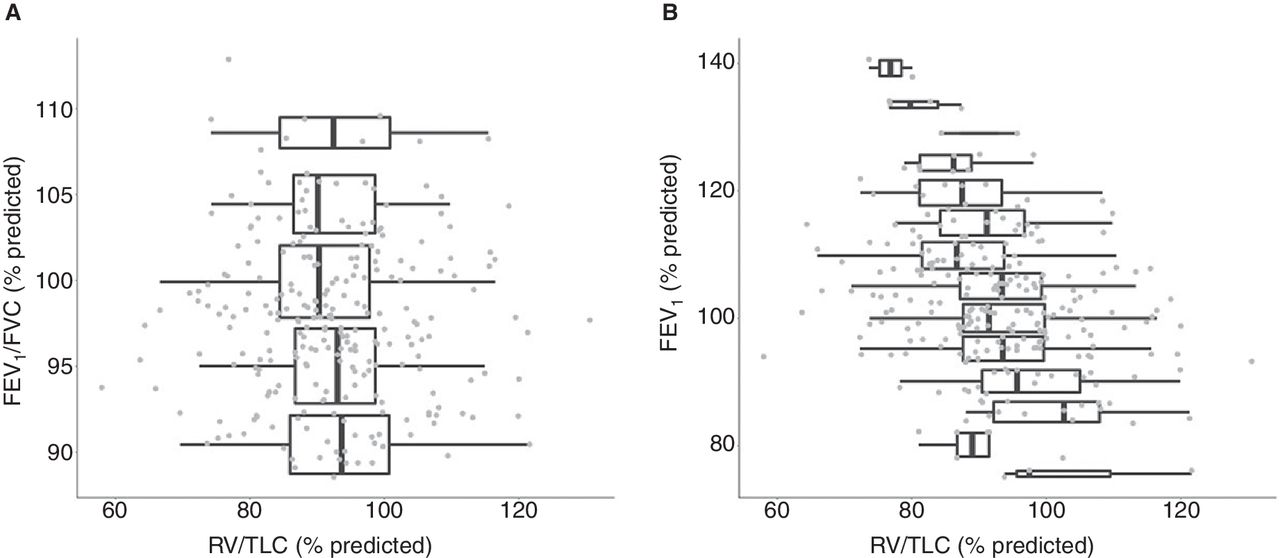
Association between RV/TLC and FEV1/FVC or FEV1. Box plots show distributions of RV/TLC versus FEV1/FVC (A) or FEV1 (B) by 5% increments. Values are shown as per cent predicted of normal. FEV1, forced expiratory volume in 1 s; FVC, forced vital capacity; RV, residual volume; TLC, total lung capacity.
Higher RV/TLC was associated with having respiratory symptoms in subjects with preserved spirometry
Respiratory complaints defined by mMRC were present in 9.0% of subjects (table 1). Using an internal respiratory questionnaire that included measurement of cough, respiratory symptoms were present in half the group (50.4%) with the most common symptom being ≥2 episodes of cough per year (44.5%) (table 1). In adjusted models, higher RV/TLC was non-significantly associated with an mMRC score ≥1 (p=0.112). Using our internal questionnaire, higher RV/TLC was significantly associated with the likelihood of having any of the respiratory symptoms with an average of 9% increase in OR for each 1% increase in RV/TLC (p=0.011) (table 2). In adjusted models, FEV1/FVC was also associated with respiratory symptoms; however, the direction of the association was opposite to that anticipated for obstructive lung disease (table 2). Inclusion of FEV1/FVC as a covariate in the same model as RV/TLC did not affect its association with respiratory symptoms. Other airflow indices were not associated with having respiratory symptoms (table 2) nor did they affect the association of RV/TLC with respiratory symptoms when they were individually included in a multivariable lung function model along with RV/TLC.
Association of subjects’ symptoms with lung function
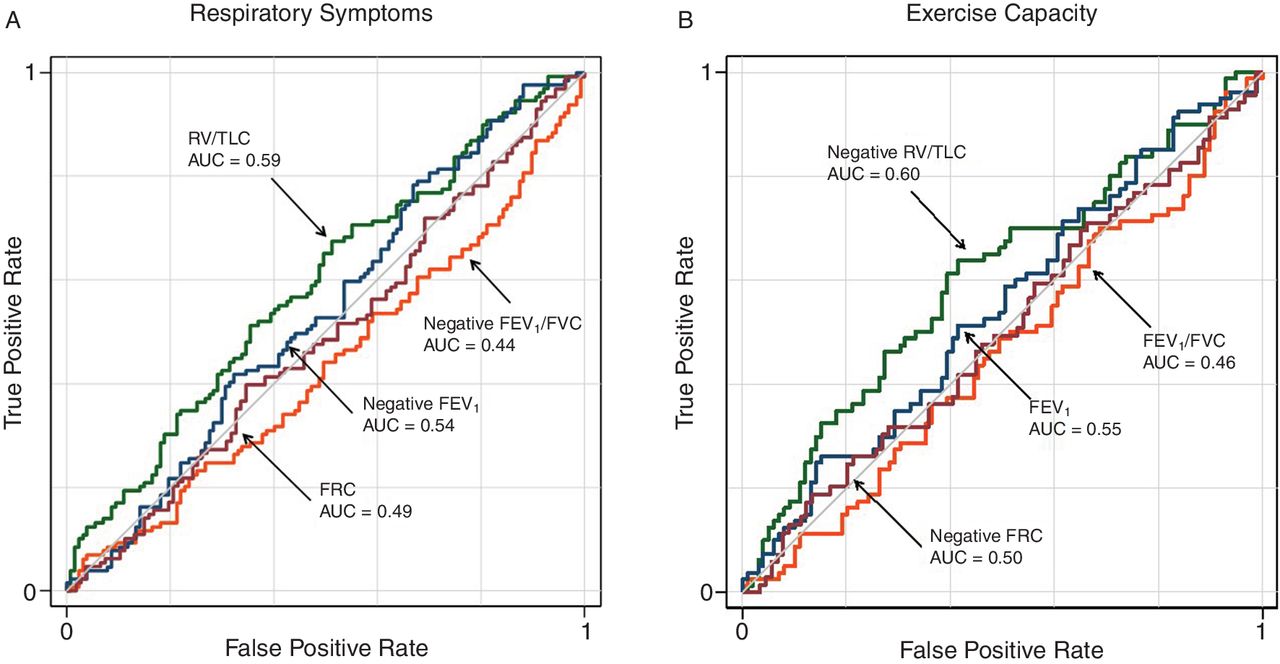
On ROC analysis, RV/TLC was a better, although not statistically significantly different, predictor than FEV1 and FEV1/FVC to discriminate between the subjects with and without reports of respiratory symptoms. The AUC measurements for RV/TLC were 0.59 while those for FEV1 and FEV1/FVC were 0.54 and 0.44, respectively. To identify at-risk groups, subjects were categorised based on having an RV/TLC per cent-predicted value of 90% (statistical optimised cut-point for ROC analysis was 89% predicted). Subjects with RV/TLC values ≥90% predicted were 92% more likely to report respiratory symptoms (p=0.015).
Higher RV/TLC was associated with lower maximum exercise capacity in subjects with preserved spirometry
In the subgroup that underwent exercise testing (n=179), the average VO2max was 1.496±0.429 L/min (99.6%±23.5% predicted) with a range of 0.695–3.004 L/min reflecting 53%–186% of normal values based on Wasserman predicted formulas30 (table 3). In adjusted models, RV/TLC was inversely associated with maximum work level achieved (both VO2max and Wattsmax) (table 4 and online supplementary e-Table 4). On average, there was a decrease of 16±6 mL/min in VO2max and 1.4±0.6 W in Wattsmax with each 1% increase in RV/TLC (r2=0.47, p=0.013 and r2=0.47, p=0.023, respectively).
Exercise parameters of subjects who performed exercise
Association of maximum exercise capacity with lung function
In adjusted models that included only a single lung function variable, none (FEV1/FVC, FEV1, FEF25−75 or FEF75) was associated with VO2max (table 4). Furthermore, when FEV1/FVC, FEV1, FEF25–75 or FEF75 each was individually included in multivariable lung function models along with RV/TLC, RV/TLC retained its statistical significance (models’ r2 ≥0.47; models’ p≤0.044) (online supplementary e-Figure 1). The association of these airflow indices with Wattsmax followed a similar pattern. Additionally, when tested for any potential confounding effects of airflow indices, FEV1/FVC, FEV1, FEF25–75 or FEF75 had no clinically or statistically significant mediation effect on the association between RV/TLC and VO2max (figure 2; table 5).
Test of possible mediation effect of airflow measures on association of maximum exercise capacity with air trapping
On ROC analysis, RV/TLC was a better, although not statistically significantly different, predictor than FEV1 and FEV1/FVC to discriminate between the subjects who were and those who were not able to achieve their 100% predicted maximum exercise capacity (100% predicted VO2max). The AUC measurement for RV/TLC was 0.60 while those for FEV1 and FEV1/FVC were 0.55 and 0.46 (figure 4). Subjects with RV/TLC values ≥90% predicted were 49% less likely to achieve their predicted maximum exercise capacity (VO2max of 100% predicted or higher) (p=0.045).

Receiver operating characteristic (ROC) analysis of lung function (FEV1/FVC, FEV1, FRC and RV/TLC) as predictors of maximum exercise capacity (VO2max). ROC curves were constructed by dichotomising having any respiratory symptoms (A) or reaching ≥100% predicted of maximum oxygen uptake (B) to show independent contributions of the lung function indices after adjustment for covariates. The AUC values were not statistically significantly different from each other. AUC, area under the curve; FEV1, forced expiratory volume in 1 s; FRC, functional residual capacity; FVC, forced vital capacity; RV, residual volume; TLC, total lung capacity.
Progressive EFL during exercise was associated with lower maximum exercise capacity in subjects with preserved spirometry
In the subgroup that underwent IC and MEF measurements (n=32), 9 had EFL at baseline, 25 developed EFL with exercise and 21 had progressive EFL (increasing %EFL) during exercise (online supplementary e-Table 5). The rate of change in %EFL was inversely associated with maximum work level achieved (both VO2max and Wattsmax) (table 4 and online supplementary e-Table 4). On average, there was a decrease of 3.52±1.39 mL/min in VO2max and 0.42±0.14 W in Wattsmax with each 1%/W increase in slope of %EFL (r2=0.40, p=0.017 and r2=0.67, p=0.004, respectively). Similarly, the rate of change in VFL was inversely associated with maximum work level achieved (both VO2max and Wattsmax; r2=0.42; p=0.009 and r2=0.64; p=0.021, respectively) (table 4 and online supplementary e-Table 4). Pertinently, RV/TLC was associated with the rate of change in %EFL and VFL (0.5%±0.2%/W and 5.9±2.8 mL/W increase in %EFL and VFL per 10% increase in RV/TLC (online supplementary e-Table 6)). The rates of change in EELV (FRC) or RV were not associated with maximum work achieved (table 4).
Radiographic gas trapping was associated with lower maximum exercise capacity in subjects with preserved spirometry
In the subgroup that underwent CT imaging (n=23), the total lung voxels with low attenuation area (LAAexp −860 to −950) were 7.6%±13.5% with 9 out of 23 (39%) having ≥5% LAAexp −860 to −950. In adjusted models, LAAexp −860 to −950 was inversely associated with maximum work level achieved (both VO2max and Wattsmax) (table 4 and online supplementary e-Table 4). On average, there was a decrease of 9±4 mL/min in VO2max and 1.2±0.5 W in Wattsmax with each 1% increase in voxels representing gas trapping (r2=0.24; p=0.049 and r2=0.28; p=0.018, respectively). Furthermore, the association of LAAexp −860 to −950 with exercise capacity was not affected by inclusion of FEV1/FVC or FEF75 (model r2 ≥0.24; p≤0.048) and minimally affected by inclusion of FEV1 or FEF25–75 (model r2 ≥0.20; p≤0.077). Only 2 out of the 23 subjects that underwent CT imaging had ≥5% LAAinsp<−950 meeting the criteria for presence of emphysema.
Higher exposure to SHS was associated with lower maximum exercise capacity
Complete non-cabin SHS exposure data were available in 127 out of the 179 subjects who underwent maximum effort exercise testing. In these, length of exposure to cabin SHS was inversely associated with maximum work level achieved (both VO2max and Wattsmax) (table 6 and online supplementary e-Table 7). On average, there was a decrease of 7±4 mL/min in VO2max and 0.8±0.4 W in Wattsmax achieved with each year increase in exposure to cabin SHS (p=0.040 and p=0.027, respectively). Other measures of SHS exposure (SHS exposures from childhood, adult home and non-airline occupational) were not significantly associated with maximum exercise capacity (table 6 and online supplementary e-Table 7).
Association of maximum exercise capacity and SHS exposure
Discussion
In a cohort at risk for obstructive lung disease because of prolonged SHS exposure but with preserved spirometry, we found RV/TLC to be overall within the predicted normal limits. However, RV/TLC showed remarkable variability across the range of FEV1/FVC or FEV1, suggesting that, at least in this cohort with preserved spirometry, RV/TLC informs an additional dimension to the obstructive lung disease not captured by standard airflow indices. Higher RV/TLC was associated with greater odds of reporting respiratory symptoms, and was predictive of lower maximum exercise capacity, independent of the level of airflow indices (FEV1/FVC, FEV1, FEF25–75 or FEF75). In a subgroup of the subjects, we found many with normal RV/TLC to have EFL at rest, and many more to develop EFL with exercise. We also demonstrated that exercise capacity, although not associated with an increase in EELV (FRC), was associated with progressive EFL (an increase in %EFL that in turn was related to RV/TLC), implicating higher RV/TLC as a possible mechanism that limits exercise capacity in this cohort with preserved spirometry. Finally, in a subgroup with imaging data, we found that LAAexp −860 to −950, the radiographic estimation of air trapping, was also associated with lower maximum exercise capacity. Overall, our findings show that in those at risk for obstruction due to SHS exposure but with preserved spirometry, the amount of air retained in lungs at the end of full expiration (RV/TLC), even if within the predicted normal range, has prognostic value in estimating functional capacity.
Many studies have documented the significance of air trapping in patients with overt COPD and its association with increased morbidity and mortality.10–14 Others have shown that in mild disease or in smokers without GOLD-defined COPD, air trapping and hyperinflation may be associated with physiologic impairment beyond the information provided by spirometry.15 16 Our study further uncovers the informative nature of lung volumes representing air trapping, even when they are in normal range, in predicting respiratory symptoms and exercise capacity. In fact, we found that having RV/TLC of 90% predicted or higher doubled the likelihood of reporting respiratory symptoms and halved the likelihood of being able to achieve the expected normal exercise capacity. Although our study was done in a cohort of never smokers with prolonged SHS exposure, it is likely that its findings are generalisable to others who are at risk for COPD due to any cause but have preserved spirometry. Furthermore, since many studies have reported worsened respiratory symptoms and exercise tolerance in patients with spirometric COPD and air trapping,6 21 31 32 it would be interesting to ascertain whether RV/TLC is a uniform predictor of worse outcomes regardless of spirometry status of patients (preserved or spirometrically defined COPD).
The physiologic mechanisms that result in air trapping have been extensively studied.33–35 In those with obstruction, active exhalation during exercise is thought to further augment air trapping via progressive increase in intrathoracic pressure and thus earlier closure of small airways, a process that results in EFL and increased EELV, reduced vital capacity and exercise limitation. An intriguing finding in our study is that many subjects who did not have evidence of air trapping at baseline (by either RV/TLC or baseline EFL) proceeded to develop EFL with exertion. Similarly, in the small subgroup that underwent CT imaging, many had evidence of mosaic perfusion and gas trapping in the setting of normal RV/TLC. Overall, these observations underscore the value of physiologic measurements during exercise and radiographic CT imaging for diagnosis of subclinical obstructive lung disease. Furthermore, they convey the diverse underlying processes that are likely involved in development of air trapping, and the complexity in its definition through various testing modalities.
A recent study in heavy smokers with preserved spirometry showed evidence of dyspnoea and lower exercise tolerance associated with increased airway resistance and diaphragm dysfunction.36 However, that study did not evaluate the association of air trapping with such outcomes. Our study showed that, at least in this cohort with individuals at risk for obstruction but with preserved spirometry, the effect of lung volumes representing air trapping (RV/TLC) on maximum exercise capacity was not mediated by airflow obstruction as measured by spirometric airflow indices, and suggests that air trapping may reflect additional pathophysiology beyond what is measured by the airflow indices of small airways. Evidence supporting this hypothesis includes other studies in patients with overt obstruction, which have shown persistence of air trapping for days to weeks even after improvement in airflow obstruction by bronchodilator therapy.7–9 Interestingly, a recent cohort study showed that the areas with gas trapping on CT imaging of patients with COPD indeed proceed to become emphysematous on follow-up CT imaging.37 Overall, it appears that the pathophysiology of air trapping may be more complicated than previously thought.
In recent years, CT imaging has been used extensively to characterise patients with COPD and identify radiographic characteristics that could help define functional phenotypes. Some of these measures include presence of emphysema, airway wall thickening and ‘gas trapping’. Additionally, various methods have been proposed for optimal quantification of these radiographic attributes.24–28 38 A few of these studies have shown gas trapping to be associated with poor respiratory outcomes.34 39 In our study, we used a method validated by Matsuoka et al 40 to measure gas trapping via calculation of LAAexp −860 to −950 in subjects with preserved spirometry. Remarkably, even in the small number of subjects examined in our radiographic subset, LAAexp −860 to −950 was associated with lower maximum exercise capacity. Our findings are consistent with another recent report about the association of gas trapping on CT imaging and respiratory symptoms in a cohort of smokers without spirometric COPD.41
Our study has limitations that should be kept in view. The cohort studied had only modest past direct smoking but experienced substantial SHS exposure. The American Thoracic Society statement on COPD considers SHS exposure to be a possible, but not definite, cause of COPD.42 Since that statement, however, further evidence has emerged supporting a contribution of SHS to development of COPD as well as to obstructive-type lung disease which do not meet the current definition of COPD.20 43 The weight of new evidence suggests that the disease caused by exposure to SHS, while it may not be spirometrically defined as COPD, is indeed similar to the lung disease of those smokers without GOLD-defined COPD.17 18 44 Another potential limitation is that to assess the presence of respiratory symptoms, we used mMRC and a similar questionnaire that additionally asked about coughing,19 and found a significant association of RV/TLC only with the latter. However, the direction of association of RV/TLC with symptoms measured by mMRC, although not significant, was consistent with our hypothesis.
In conclusion, we found that in a cohort at risk for COPD due to prolonged occupational exposure to SHS but without spirometric COPD, lung volumes representing air trapping (RV/TLC) had a wide distribution across increments of airflow indices. Higher RV/TLC, even within normal range, identified a subgroup with more prevalent respiratory symptoms and lower exercise capacity. Many of those without abnormal RV/TLC and frank air trapping had or developed EFL with exercise, which was associated with respiratory symptoms and exercise capacity. Our findings, along with other literature, suggest that lung volumes representing air trapping could be used for prognostication in populations with preserved spirometry who are at risk for COPD due to any cause such as direct smoking or air pollution.
Supplementary file 2
![[bmjresp-2018-000284-SP2.jpg]](https://bmjopenrespres.bmj.com/content/bmjresp/5/1/e000284/DC2/embed/inline-supplementary-material-2.jpg?download=true)
Acknowledgments
We thank Oliver Beech, Patricia Emerson-Healy, Emily Ghio and Liane Tolang for help with performance of cardiopulmonary exercise testing, and Drs Jonathan Goldin and Berend C Stoel for their consultation regarding CT imaging. We also appreciate the contribution of the flight attendants who took time out of their busy schedules to participate as research subjects in this study.
References
Footnotes
Contributors Conceived and designed the experiments: MA, WMG. Developed study protocols: MA, WMG. Collected the data: MA, JG, IvK, JK, BB, RKS, BE. Analysed and interpreted the data: MA, SZ, WMG, JG, IvK, BE. Prepared the manuscript: MA, SZ. Edited the manuscript: JG, WMG, PDB. Obtained funding: MA, WMG.
Funding This work was supported by the Flight Attendant Medical Research Institute (MA and WMG) and the discretionary funds from the University of California San Francisco (UCSF) Cardiovascular Research Institute (MA and WMG).
Competing interests None declared.
Patient consent Not required.
Ethics approval UCSF IRB.
Provenance and peer review Not commissioned; externally peer reviewed.
Data sharing statement No additional data are available.