Article Text

Abstract
Aims: To explore the effects in normal and asthmatic adults of exposure to 200 ppb sulphur dioxide (SO2) and 200 μg/m3 and 2000 μg/m3 aerosols of ammonium bisulphate (AB) and sulphuric acid (SA) (MMD 0.3 μm).
Methods: Exposures were placebo controlled, for one hour at rest, double blind in random order. ΔFEV1 was the primary outcome; secondary outcomes included symptoms, ventilation, exhaled nitric oxide (NO) concentrations, and nasal lavage fluid ascorbic (AA) and uric acid (UA) concentrations.
Results: There were no significant changes in spirometry or symptoms with any exposure in either group. SO2 exposure was associated with an increased respiratory rate relative to air exposure in the asthmatic group (SO2: 958.9 breaths/hour; air: 906.8 breaths/hour) but the mean volume breathed did not differ significantly (SO2: 318.8 litres; air: 311.4 litres). AB exposures were associated with a significant rise in [NO] in the asthmatic (+1.51 ppb, and +1.39 ppb), but not in the normal group. Mean pre- and post-exposure [AA] tended to be higher in the normal than in the asthmatic group. Within each group, [AA] did not change significantly with any exposure. Post-exposure [UA] were greater than pre-exposure concentrations for all exposures, significantly so in the normal group for all exposures except SO2. There were no significant differences in the mean change in [UA] for any exposure relative to air.
Conclusions: The pollutant exposure concentrations employed in this study were generally much greater than ambient. It is unlikely that short lived exposures at lower concentrations would show significant effects, but effects of longer term lower concentration exposures cannot be ruled out.
- air pollution
- sulphuric acid
- ammonium bisulphate
- antioxidants
- mechanisms
- AA, ascorbic acid
- AB, ammonium bisulphate
- BMA, bottled medical air
- ELF, epithelial lining fluid
- eNO, exhaled nitric oxide
- FEV, forced expiratory volume
- FVC, forced vital capacity
- MMEF, maximum mid-expiratory flow
- NL, nasal lavage
- SA, sulphuric acid
- UA, uric acid
Statistics from Altmetric.com
- AA, ascorbic acid
- AB, ammonium bisulphate
- BMA, bottled medical air
- ELF, epithelial lining fluid
- eNO, exhaled nitric oxide
- FEV, forced expiratory volume
- FVC, forced vital capacity
- MMEF, maximum mid-expiratory flow
- NL, nasal lavage
- SA, sulphuric acid
- UA, uric acid
Acid aerosols, sulphur oxides, and particles form a complex group of distinct air pollutants that have been associated with a wide range of adverse health effects including short term respiratory morbidity and mortality.1–9 These pollutants share a common source (fossil fuels)10 which makes unravelling which component might be responsible for any given health effect methodologically challenging. At a more complex level, especially for particles and acid aerosols, it makes identifying the characteristic of the specific pollutant (for example, particle size, mass/number concentration, chemistry) associated with an adverse effect difficult. While single agent human challenge studies have begun to address these issues and explore putative mechanisms,11–13 few agents have been studied comparatively. In addition, the technical difficulties in producing controlled particulate exposures of relevant particle size make even some single agent studies using particle challenge difficult to interpret.
Annual mean concentrations of sulphur dioxide (SO2) in urban areas are generally less than 10 ppb, but maximum one-hour means may reach 200 ppb.10 There has been a substantial reduction in UK emissions of SO2 over the past three decades, but in many parts of the less developed world, far higher concentrations still prevail. Particulate sulphates in ambient air are principally secondary particles, their main source being the atmospheric oxidation of SO2 to sulphuric acid (H2SO4).14 Sulphuric acid exists in the air in particle form; it reacts irreversibly in two stages with ammonia gas, abundant in the atmosphere, to form ammonium bisulphate or ammonium sulphate. Particulate sulphuric acid and its partially or fully neutralised salts are generally sub-micronic in diameter and constitute a major fraction of the smaller respirable particles found in ambient air. In the UK, sulphates typically account for 20–25% of urban total suspended matter by mass,15 of which 85% is in the fine (<2.5 μm) fraction. Earlier this century, hourly levels of sulphuric acid in the UK may at times have exceeded 1000 μg/m3,16 but more recent rural data shows levels 90% lower.17
SO2 can cause bronchoconstriction in both normal adults18–20 and those with asthma,21–23 but challenge studies with sulphuric acid and ammonium bisulphate have reported variable airway effects. Most studies in normal subjects show no change in lung function after sulphuric acid exposures at concentrations of up to 1500 μg/m3 with occasional exceptions.24,25 In several studies, asthmatic subjects have shown no response to sulphuric acid at concentrations of up to 3000 μg/m3,26–28 but again not consistently.29 Ammonium bisulphate challenge is less potent than equivalent concentrations of sulphuric acid.30
As a preliminary step in a series of studies exploring the effects of exposure to sulphurous pollutants, we aimed in this study to determine the effects of challenge with SO2, sulphuric acid, and ammonium bisulphate on a range of respiratory and non-respiratory parameters in normal and asthmatic subjects. Here we report the symptom, ventilation, lung function, exhaled nitric oxide, and nasal lavage antioxidant results. Nasal cytokine and heart rate variability results31 are reported elsewhere.
Main messages
-
High levels of exposure to sulphurous air pollutants had no effect on lung function or exhaled nitric oxide in normal and asthmatic subjects.
-
Nasal uric acid levels were increased post-exposure for all pollutants, but also for air, suggesting an effect of nasal lavage as a stimulus rather than pollutant exposure. No changes in other antioxidants were found.
METHODS
Study design
This was a double blind, random order, placebo (air) controlled study comparing exposure to high and low mass concentrations of particulate sulphuric acid and ammonium bisulphate, and 200 ppb of SO2 in normal and asthmatic adults. The primary outcome was change in forced expiratory volume in one second (FEV1) before and after exposure. Secondary outcomes included symptoms, minute ventilation, oronasal partitioning of breathing, exhaled nitric oxide concentrations, heart rate variability, and changes in the antioxidant composition of nasal epithelial lining fluid.
Subjects
Twenty four volunteers were studied, 12 with physician diagnosed mild asthma and 12 normal, healthy adults (table 1). Asthma was defined as a history of recurrent episodes of wheezy breathlessness responding to inhaled bronchodilators with evidence either of peak flow variation of greater than 15% or a >15% response in FEV1 to inhaled β agonist. None of the volunteers were current smokers or ex-smokers, and subjects with coexisting cardiovascular disease were excluded. The asthmatic subjects were using short acting β agonists with or without inhaled corticosteroids at a daily dose not exceeding 400 μg of beclomethasone or equivalent. Use of short acting β agonists was withheld for a minimum of four hours before each exposure. The project was approved by the East Birmingham Health Authority Research and Ethics Committee.
Ventilation parameters recorded during exposures, by group
Exposures
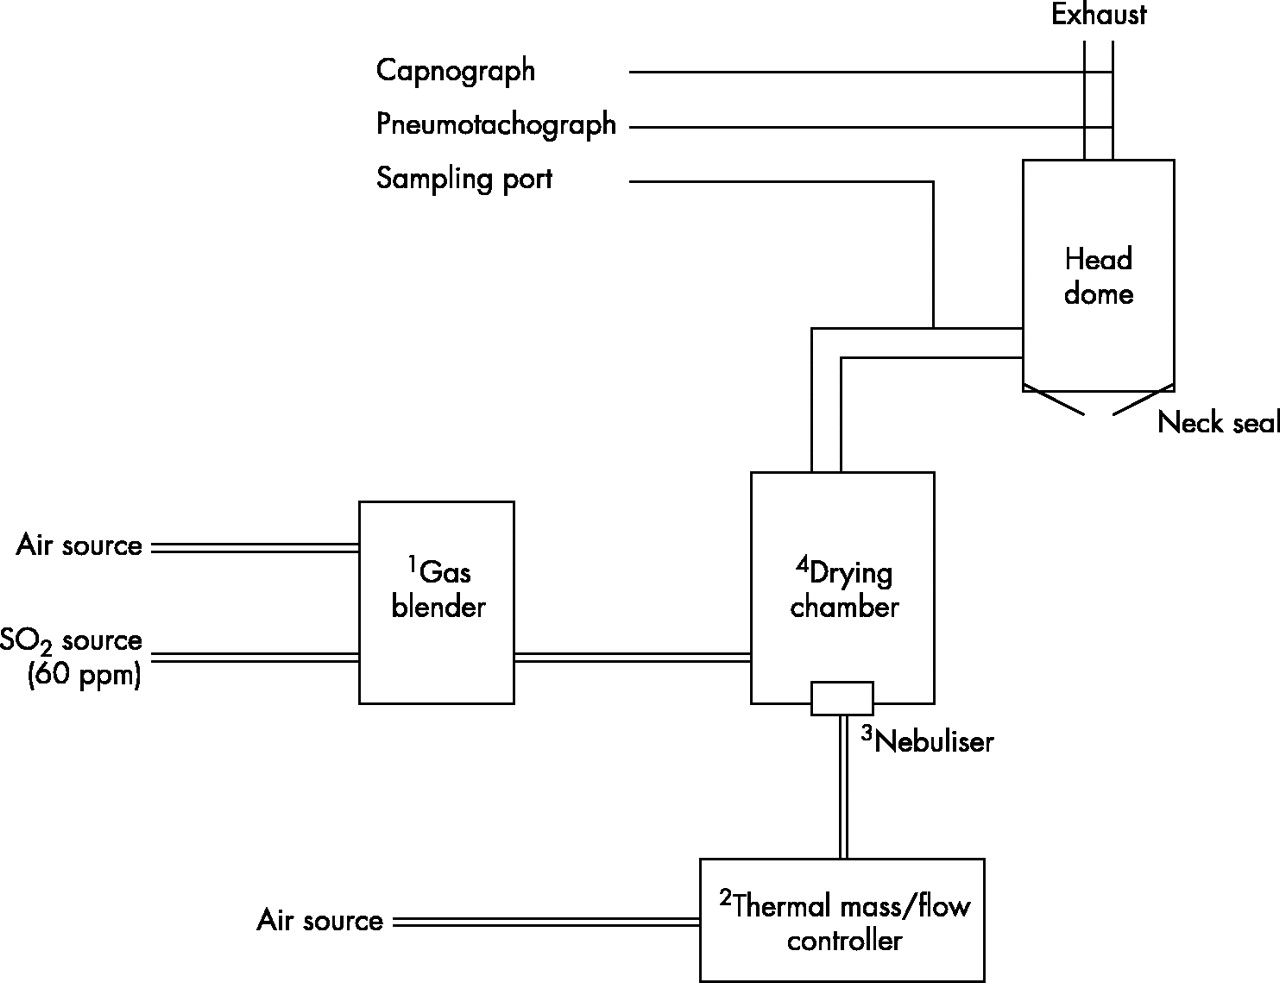
Exposures were at least two weeks apart, of an hour’s duration at rest and at the same time of the day for each individual. The pollutants used were 200 ppb gaseous SO2, 200 μg/m3 and 2000 μg/m3 particulate sulphuric acid, and 200 μg/m3 and 2000 μg/m3 ammonium bisulphate. Bottled medical air was used for the placebo exposure. All exposures were conducted using a head only exposure system (fig 1),32 a detailed description of the design and performance of which will be reported elsewhere. In brief, the circuit consisted of an integrated pollutant source, a drying/mixing chamber, and a cast acrylic head dome. During exposures, the subject sat in a comfortable chair, their head within the dome. The entry port was positioned within their breathing zone, the exit port in the roof of the dome (containing a pneumotachograph), and distally, a sampling port for a real-time capnograph. A neck seal was achieved with a modified diving suit neckpiece. Before each exposure, subjects brushed their teeth, and gargled with an antiseptic mouth rinse to reduce the possibility of neutralisation by oral ammonia. For all exposures, a carrier stream of gas at 120 l/min was delivered to the circuit to avoid significant re-breathing within the circuit. For the particulate and placebo exposures the carrier stream was bottled medical air (BMA); for the SO2 exposures it was BMA blended with a bottled 60 ppm source of SO2 (BOC Special Gases, Guildford, UK) to yield a final concentration of 200 ppb. The output from a standard medical nebuliser (Micro-Cirrus, Intersurgical, Berks, UK) driven by BMA at a flow rate of 4.5 l/min, was delivered to the base of the mixing/drying tank, contained in the circuit upstream of the head dome. All gas flows were governed by mass-flow control valves under microprocessor control (Flowtech Solutions, Stockport, UK). For the air and SO2 exposures, the nebuliser contained deionised distilled water. For the sulphuric acid and ammonium bisulphate exposures the water was replaced with a dilute solution of the required agent, the mass concentration of the final exposure aerosol being governed by the solution’s concentration. For the gas exposures, the water droplets produced by the nebuliser evaporated to produce water vapour; for the particulate exposures the drying capacity of the carrier stream conditioned the nebuliser output to produce final exposure aerosols with mass median diameters of approximately 300 nm and count modes of around 30 nm.
Particle generator and exposure system. 1Gas blender: yoked thermal mass/flow controllers regulating turbulent carrier flow of medical air or medical air blended with SO2. 2Thermal mass/flow controller regulating nebuliser driving gas flow to 4.5 l/min (medical air). 3MicroCirrus nebuliser with integral filling loop containing distilled deionised water or dilute solutions of sulphuric acid or ammonium bisulphate. 425 litre drying chamber allowing mixing of nebuliser output with turbulent carrier stream.
The delivered SO2 concentration was verified using a calibrated ultraviolet fluorescent gas analyser (API Corp., San Diego, CA, USA). The mass concentrations of the sulphuric acid and ammonium bisulphate aerosols were confirmed by sampling a known aerosol gas volume through a PTFE filter at the inlet port of the head dome. The filter was wetted with propan-2-ol and extracted with deionised distilled water. The sulphate content of the extract was analysed by ion chromatography using a Dionex DX 100 system and an AS 4 anion column. The particle size distributions of the aerosols were assessed by a TSI scanning mobility particle sizer, a Dekati electrical low pressure impactor, and a micro-orifice uniform deposit impactor (MOUDI).
The initial concentrations of the sulphuric acid solutions were 0.0005 and 0.005 molar, and of ammonium bisulphate 0.01 and 0.1 molar. Calculations using the thermodynamic properties of sulphuric acid solutions and allowing for the Kelvin effect indicate that the sulphuric acid content of the aerosol droplets is at a maximum for the smallest particles (2 nm diameter) at 67.5%, falling to around 60.7% at 100 nm and greater diameter. However, at the water vapour concentrations of the human respiratory system (approximately 99%) the sulphuric acid concentrations of the droplets are expected to decline rapidly to values similar to those in the nebuliser solution following inspiration.
Biological endpoints
Symptoms
Subjects were asked to record the degree of cough, breathlessness, eye and throat irritation, sub-sternal discomfort, wheeze, and sputum production before and at the end of each exposure, using an ordinate scale; with 0 representing no symptoms and 10 the maximum possible degree of symptoms.
Ventilation
The pneumotachograph (Vitalograph, Buckingham, UK) was calibrated prior to each exposure and allowed the volume, duration, and start time of each breath to be recorded. An oral thermocouple flow sensor (HMS 5000 Case Clinical and Scientific, Biggin Hill, UK) was worn by the subjects, to determine the partitioning of oral and nasal ventilation.
Lung function
FEV1, maximum mid-expiratory flow (MMEF), and forced vital capacity (FVC) were measured before and immediately after exposures. All lung function measurements were made with a Fleisch pneumotachograph interfaced with the Vitalograph Spirotrac III system (Buckingham, UK), calibrated at the start of each study day. The best of at least three technically acceptable blows was taken as the measured value.
Exhaled nitric oxide
Exhaled nitric oxide (eNO) was measured with a chemiluminescence analyser (Model LR2000, Logan Research Ltd, Rochester, UK) (range 1–500 ppb NO, resolution 0.3 ppb NO), calibrated with certified NO mixtures (55 ppb NO in nitrogen, BOC Special Gases, Guildford, UK).33 Measurements were made immediately after spirometry prior to (pre) and following (post) each exposure, and just prior to the repeat nasal lavage (late) at the end of the study day.
Nasal lavage
Each subject underwent nasal lavage (NL) prior to each exposure, immediately after measurement of eNO and was repeated 5.5–6 hours later. NL was performed using a modified Foley catheter, its balloon being introduced and inflated at the external nares to create a seal. A 7 ml aliquot of phosphate buffered saline (PBS) was instilled, withdrawn, and instilled again into each nostril sequentially. Subjects were seated with their heads tipped slightly forward to prevent posterior escape. Samples were recovered by gentle aspiration prior to balloon deflation, residual fluid being caught in a funnel and added to the aspirate. Recovered material was placed on ice prior to centrifugation at 400 g for 15 minutes. The supernatant was then split into two samples and stored at −70oC for later batch analysis. One set of the nasal lavage fluid samples were analysed for ascorbic acid (AA) and uric acid (UA) (antioxidants), using reverse phase high performance liquid chromatography with electrochemical detection.34
Data analysis
With 12 subjects in each group, the study had approximately 80% power to detect a change in FEV1 of around 120 ml associated with a pollutant exposure, at the 5% significance level.
Within group matched pair analysis was used to compare the change in lung function parameters, measures of ventilation, exhaled nitric oxide concentrations, and the assayed components in the nasal lavage samples with exposures. Paired t tests were used for significance testing.
RESULTS
Demographics
The mean age of the asthmatic group was 35.7 years (five females, seven males). Mean % predicted FEV1 was 88.5% and FVC 97.2%. All were using short acting β agonists; six were taking inhaled steroids at doses between 100 and 400 μg/day of beclomethasone or equivalent.
The mean age of the normal group was 34.5 years (seven females, five males). Mean % predicted FEV1 was 98.9% and FVC 101.2%.
Symptoms
All exposures were well tolerated and there were no withdrawals. There were no significant differences in symptom scores in either the normal or the asthmatic group between exposures (data available on request).
Ventilation
In the normal group there were no significant differences between the mean total or oral breath count, or the mean volume breathed for any of the pollutant exposures relative to the air exposure (table 1). In the asthmatic group, SO2 exposure was associated with a small but significant increase in mean respiratory rate relative to placebo (SO2: 958.9 breaths/hour; air: 906.8 breaths/hour, p = 0.04, 95% CI of difference: 9.7 to 94.2 breaths/hour), but the mean volume breathed over one hour did not differ significantly (SO2: 318.8 litres; air: 311.4 litres, p = 0.7). At least 95% of all breaths in all exposures were nasal, and there was no significant association between the frequency of oral breaths and any exposure in either group.
Lung function
Changes in mean lung function parameters are listed by group and exposure in table 2. There were no significant changes in mean FEV1, FVC, or MMEF in either group with any exposure.
Changes in lung function parameters with exposures by group
Exhaled nitric oxide (Table 3)
Changes in exhaled nitric oxide concentrations with exposure by group
Complete data are not available for all subjects due to a mechanical breakdown of the measurement equipment as the study was nearing completion. All mean eNO concentrations in the asthmatic group were greater than in the normal group. Exposures to 200 μg/m3 and 2000 μg/m3 ammonium bisulphate were associated with a significant rise in eNO in the asthmatic group (+1.51 ppb, 95% CI of difference 0.77 to 2.25 ppb, p = 0.003; and +1.39 ppb, 95% CI of difference 0.36 to 2.43 ppb, p = 0.02), but not in the normal group. No other exposure was associated with any significant change in mean eNO concentrations in either group.
Antioxidant levels in nasal lavage (table 4)
Ascorbic and uric acid concentrations in nasal lavage fluid by exposure and group
In general, nasal lavage was well tolerated by most participants. Catheter dislodgement and sneezing resulted in the loss of four of 288 lavage samples. The volume of recovery in a further 19 samples was low and ascorbic acid analysis was abandoned in those. The mean volume recovered for all pre-exposure samples was 12.8 ml (SD 1.1), and for all post-exposure samples was 11.0 ml (SD 1.3).
Mean pre- and post-exposure ascorbic acid concentrations tended to be higher in the normal group. Within each group, there were no significant differences in the mean pre- and post-exposure concentrations for any exposure. In the group with asthma, the mean change in AA concentration with SO2 exposure (+0.1 μmol/l) was significantly smaller than the mean change for air (+0.24 μmol/l) (difference = 0.15 μmol/l; 95% CI of difference 0.04 to 0.26 μmol/l, p = 0.03), but there were no other significant differences relative to air in either group for any exposure.
For uric acid, in all exposures in each group, mean post-exposure concentrations were greater than mean pre-exposure concentrations, significantly so in the normal group for all exposures except for SO2. There were no significant differences in the mean change in uric acid concentrations for any exposure relative to the changes following air exposure in either group.
DISCUSSION
We did not show any significant change in symptoms or lung function as measured by FEV1, FVC, and MMEF in either normal or asthmatic adults in response to hour-long exposures to 200 ppb SO2, 200 μg/m3, and 2000 μg/m3 particulate sulphuric acid or ammonium bisulphate, relative to air, findings which are concordant with published work. Bronchoconstriction in response to SO2 challenge appears to be, at least in part, concentration dependent,20,23 and has not been observed in normal subjects exposed to less than 1000 ppb35,36 and in general in asthmatics exposed to less than 250 ppb.22,36 Data for sulphuric acid and ammonium bisulphate exposures are more limited and less consistent. For sulphuric acid, most studies in normal adults have shown little or no effect26,37–39 at concentrations of up to around 1500 μg/m3. In one study of the effects of orally inhaled 1000 μg/m3 sulphuric acid and sulphates, only a small change in lung function was seen after sulphuric acid (maximum fall in FEV1 of 150 ml).40 Several studies, like ours, found no change in lung function after exposure to sulphuric acid in a range of concentrations up to 3000 μg/m3,26–28,41 while others have detected bronchoconstriction in asthmatic patients after inhalation of sulphuric acid at concentrations of 1000 μg/m3,38,42 in one study at only 100 μg/m3.29 Interpretation of these differences is difficult as all of the changes that have been reported have been very small, and no clear dose response relations have been shown. It seems improbable that the variation between studies in the method of delivery, particle size, and the variable inclusion of exercise in exposure protocols adequately explains these differences.
The design of our exposure system, allowing unfettered oronasal breathing, is more like the real life setting. We showed no significant differences in oronasal partitioning of ventilation, or volumes breathed with any exposure in either group. SO2 exposure was associated with a small but statistically significant increase in mean respiratory rate in the asthmatic group relative to air, but the similar volumes breathed during each exposure suggests a compensatory reduction in tidal volume. Similar effects have been recorded in normal adults during ozone exposure,43 are thought to be initiated by autonomic receptors in the nasal airway, and may be observed at exposures below the threshold of sensory perception or symptoms.44 While such changes may not necessarily per se indicate an adverse effect, they may have implications for the regional delivery of other co-pollutants, potentially altering the distribution of airway exposure to a gas or particles. The reasons for the lack of a response in normals remain uncertain. We have recently reported divergent autonomic consequences of SO2 exposure in these groups,31 and suggest this may in part contribute to the observed differences. The ability of air pollutants to affect autonomic modulation at concentrations that do not impact on symptoms or lung function also has possible implications for the understanding of the cardiovascular effects of air pollution.
Baseline eNO concentrations were, as anticipated, greater in the asthmatic group than the normal group,45 but no consistent pattern of effect within either group was seen for any of the exposures except for ammonium bisulphate. Mean immediate post-exposure eNO concentrations following both concentrations of ammonium bisulphate were increased in both groups, significantly so in the group with asthma. The increase was transient, with late concentrations returning to around baseline levels, and so was unlikely to have been consequent to nitric oxide synthase induction. There is mounting evidence that epithelial lining fluid (ELF) chemistry can modulate NO. Marshall and Stamler have proposed that increased airway acidity in subjects with asthma may at least in part account for increased eNO concentrations46; we have shown an increase in eNO in smokers minutes after exposure to cigarette smoke,47 and a reduction in eNO concentrations in normal adults shortly after exposure to 1.5 ppm nitrogen dioxide.48 Our findings may reflect a change in ELF pH following inhaled ammonium bisulphate. The absence of a significant change in eNO following sulphuric acid may reflect the small numbers studied, and no differing effects of the exposure aerosols on exhaled NO concentrations should be inferred from these findings.
Nasal lavage samples were examined for the effects of exposures on upper airway ELF antioxidants, ascorbic acid, and uric acid thought to be important in respiratory tract defence. Baseline ascorbic acid values tended to be greater in the normal group than in the group with asthma, supporting previous observations of altered airway antioxidant status in patients with mild asthma.49 All mean post-exposure values were greater than pre-exposure values in both groups, significantly so in the normal group for each exposure except SO2. These results suggest that when employing repeated nasal lavage, the process of initial lavage is likely to influence subsequent results, emphasising the importance of a placebo arm in such studies. The further interpretation of these data as regards consumption and repletion kinetics of nasal antioxidants in response to air pollutant challenge is constrained by use of only two sampling times in relation to the exposures. The apparent attenuation of uric acid response in the asthmatic group relative to the normal group suggests that their kinetics may differ.
In summary, we have not shown any changes in a variety of lung function measures in a group of normal and asthmatic adults when exposed to a range of sulphurous air pollutants. In contrast, we have shown differences in nasal ELF antioxidant status between normal and asthmatic subjects, changes in ventilatory timing in subjects with asthma in response to SO2, and changes in eNO in subjects with asthma after ammonium bisulphate. These changes were seen at levels of exposure generally much higher than ambient, and so extrapolation to day-to-day exposure is unwise. It is likely that short lived exposures at lower concentrations would not have an effect, but effects of longer term lower concentration exposures cannot be ruled out.
Acknowledgments
This project was supported by a grant from the Department of Health