Article Text

Abstract
Objectives Several respirable hazards, including smoking and indoor air pollution from biomass, were suggested to increase the risk of tuberculosis. Few studies have been conducted on ambient air pollution and tuberculosis. We investigated the association between exposure to ambient air pollution and incidence of active tuberculosis.
Methods We conducted a cohort study using 106 678 participants of a community-based screening service in Taiwan, 2005–2012. We estimated individual exposure to air pollution using data from the nearest air quality monitoring station and the road intensity within a 500 m buffer zone. The incidence of tuberculosis was ascertained from the national tuberculosis registry.
Results After a median follow-up of 6.7 years, 418 cases of tuberculosis occurred. Exposure to fine particulate matter (PM2.5) was associated with increased risk of active tuberculosis (adjusted HR: 1.39/10 μg/m3 (95% CI 0.95 to 2.03)). In addition, traffic-related air pollution including nitrogen dioxide (adjusted HR: 1.33/10 ppb; 95% CI 1.04 to 1.70), nitrogen oxides (adjusted HR: 1.21/10 ppb; 95% CI 1.04 to 1.41) and carbon monoxide (adjusted HR: 1.89/ppm; 95% CI 0.78 to 4.58) was associated with tuberculosis risk. There was a non-significant trend between the length of major roads in the neighbourhood and culture-confirmed tuberculosis (adjusted HR: 1.04/km; 95% CI 0.995 to 1.09).
Conclusions Our study revealed a possible link between ambient air pollution and risk of active tuberculosis. Since people from developing countries continue to be exposed to high levels of ambient air pollution and to experience high rates of tuberculosis, the impact of worsening air pollution on global tuberculosis control warrants further investigation.
Statistics from Altmetric.com
What this paper adds
Previous laboratory studies and ecological studies pointed to the possibility of a positive association between ambient air pollution and tuberculosis. However, no epidemiological study has investigated this association.
In the first cohort study on ambient air pollution and tuberculosis, we found that fine particles and several traffic-related pollutants, including nitrogen dioxide, nitrogen oxides and carbon monoxide, were associated with increased risk of active tuberculosis disease.
Since people from developing countries continue to be exposed to high levels of ambient air pollution and to experience high rates of tuberculosis, further epidemiological studies are warranted to evaluate the potential impact of ambient air pollution on the burden of tuberculosis.
Introduction
Tuberculosis (TB) remains a major infectious disease in the world, with an estimated 9.0 million incident cases and 1.5 million deaths every year.1 Most individuals infected by the pathogen, Mycobacterium tuberculosis, have a clinically latent infection for a lifetime, and approximately 5–10% of them will develop active disease. The precise mechanism of reactivation is still unknown, but it is believed that reactivation tends to occur when the host immune response is compromised.2 For example, HIV infection and diabetes are associated with increased risk of TB disease.3
Several respirable risk factors including smoking (active and passive) and indoor air pollution from biomass were suggested to increase the risk of TB because of their potential negative impact on the airway defence mechanism.4–6 We hypothesise that ambient air pollution, which is now a major public health issue in most developing countries, might also be associated with increased risk of TB.7 8 Previous laboratory studies and ecological studies pointed to the possibility of a positive association between ambient air pollution and TB.9–12 However, no epidemiological study has directly investigated this association, and TB was not included as the health outcome in the global burden of disease assessment for air pollution.7 8 Since many developing countries are heavily affected by ambient air pollution and TB, the rising trend of air pollution might undermine the effort of TB control in these places if it indeed increases the risk of TB. We conducted a cohort study to investigate the association between exposure to ambient air pollution and active TB in Taiwan.
Methods
Study participants
The study population consisted of participants who participated in the voluntary community-based integrated screening programme in New Taipei City.13 All individuals who participated in the programme during 2005–2008 were recruited. Among the 127 085 participants, 2630 (2%) refused to participate, 1493 (1%) were excluded because of a history of active TB, and 16 284 (13%) were excluded because of missing residential address or other covariates. The final sample size was 106 678 (eFigure 1). The participants were followed up until incidence of TB or the end of the study, December 2012, whichever came first.
Exposure assessment of ambient air pollution
The exposure of interest is particulate matter 2.5 μm or less in aerodynamic diameter (PM2.5) and PM 10 μm or less in aerodynamic diameter (PM10). We also investigated specific air pollutants including carbon monoxide (CO), nitrogen dioxide (NO2), nitrogen oxides (NOx) and ozone (O3). The air quality monitoring network of Taiwan Environmental Protection Administration recorded the information of all common pollutants, and we used data from the nearest (relative to the residential address) air quality monitoring station to estimate the level of ambient air pollution. Sixteen community air quality monitoring sites around the study area were included (figure 1). The information on PM2.5 in Taiwan was available only after August of 2005; we therefore projected the previous level of PM2.5 (up to August of 2004) using the observed association between PM2.5 and other pollutants (see online supplementary and eTable 1).
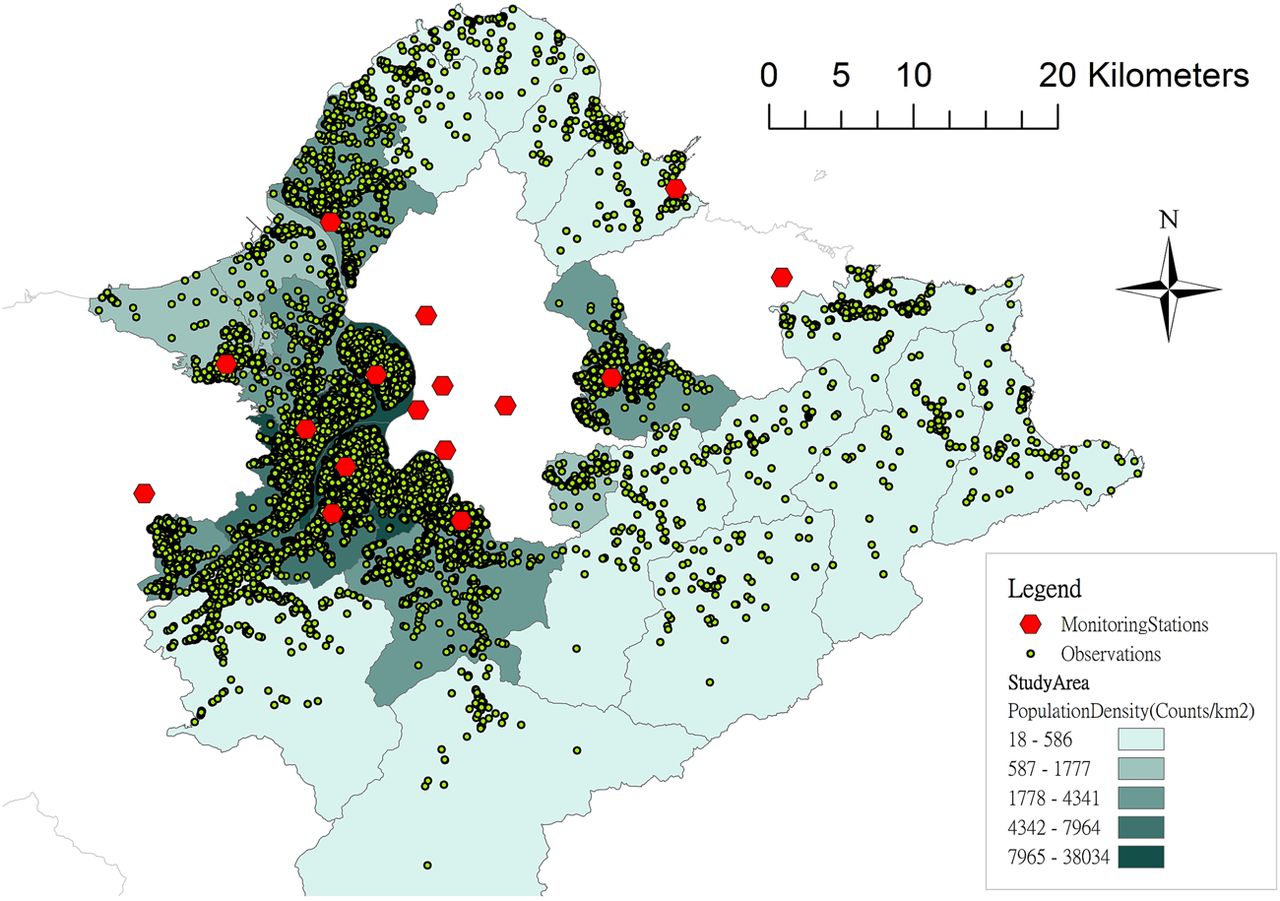
Spatial distribution of study participants and air quality monitoring stations in the study area (New Taipei City).
Measurement of other covariates
We adjusted for major risk factors for TB in the analysis based on a literature review of previous studies.2 3 We used information from the baseline questionnaire and blood examinations to determine individual-level risk factors, including sex, age, body mass index, education level, marital status, smoking status, alcohol use, betel nut use and history of TB in the family. In addition, we used the median annual income in each district as a proxy of the area-level socioeconomic indicator.14
Measurement of TB status
The primary outcome of this study was active TB. The occurrence of confirmed TB disease during follow-up was ascertained by linking the screening database to the National TB Registry of Taiwan Centers for Disease Control (CDC) using the unique national identification number. According to the CDC guidelines for TB diagnosis and treatment, the diagnosis of active TB was based on physical examination, chest radiograph, bacteriological evidence from laboratory tests, and positive response to anti-TB treatment.15 A previous study revealed that over 96% of previously treated patients with TB were notified to the National TB Registry.16
Statistical analysis
We computed the median and IQR of air pollution level during 2005–2012. The associations between pairs of pollutants were estimated using the correlation coefficient. We conducted time-dependent Cox proportional hazards regression analyses to estimate the HR and 95% CI of the association between ambient air pollution and active TB, adjusting for major TB risk factors (see Measurement of other covariates section). We used the causal diagram to decide which variables to include in the multivariable model (see online supplementary and eFigure 2).17–19 For each individual, we calculated the annual relevant exposure level using the average level of air pollution in the preceding 2 years. Therefore, the exposure to air pollution was time-varying and updated annually. The 2-year window was selected because the risk of developing active TB was the highest in the initial 2 years after being infected.20 The effect of air pollution was modelled linearly as each 10 μg/m3 (PM2.5, PM10), 10 ppb (NO2, NOx, and O3) or 1 ppm (CO) increase in the risk of active TB. In order to avoid misdiagnosis of TB, we conducted a sensitivity analysis using only culture-confirmed TB as the outcome. To explore if there was any non-linear relation between air pollution and TB, we examined the exposure–response trends using a penalised smoothing spline.21 22 Analyses were carried out with the use of SAS V.9.2 (SAS Institute Inc., Cary, North Carolina, USA) and R V.3.0.0 (The R Foundation for Statistical Computing, Vienna, Austria).
Additional analyses using alternative methods for exposure assessment
We conducted an additional analysis investigating road intensity as a proxy of traffic-related air pollution. We measured the lengths of roads within the 500 m buffer zone around each residential address.23 ArcGIS 10.0 (ESRI, Redlands, California, USA) was used to calculate the cumulative lengths of all roads and major roads as a measurement of road intensity. Major roads included the national highway, provincial highway, expressway, city street and county street. We applied the multivariable Cox analysis to estimate the HRs and 95% CIs of the association between traffic indicators and active TB.
Lastly, we conducted a subgroup analysis using the previously constructed land use regression models to obtain more precise estimates of air pollution.23 24 We restricted this part of the analysis to those who lived in the districts where actual measurements of air pollution were performed (n=44 144) (see online supplementary and eTable 2 for details of land use regression modelling). Using the estimated level of air pollution from the land use regression models, we conducted multivariable Cox analysis to investigate the HRs and 95% CIs of the association between air pollution (PM2.5, PM10, NO2 and NOx) and active TB.
Results
Of the 106 678 participants in the cohort, 65% were female and the median age was 50.85 years. Table 1 provides the baseline characteristics of the study participants. After a median follow-up of 6.7 years, 418 cases of incident TB occurred (incidence rate, 61/100 000; 95% CI 46 to 93/100 000). Among the 418 cases of active TB, 390 (93%) had pulmonary TB and 280 (67%) were culture-confirmed.
Baseline characteristics of the study population (N=106 678)
The median distance between the air quality monitoring site and the participant's residence was 2.40 km (first and third quartiles, Q1–Q3, 1.53–3.95). The period-average level of air pollutants (2005–2012) varied only moderately across the study populations; the median concentration was 27.79 μg/m3 (Q1–Q3, 25.09–30.27) for PM2·5, 47.34 μg/m3 (Q1–Q3, 45.55–51.74) for PM10, 0.61 ppm (Q1–Q3, 0.49–0.70) for CO, 22.13 ppb (Q1–Q3, 17.41–24.70) for NO2, 35.64 ppb (Q1–Q3, 26.44–49.21) for NOx, and 26.83 ppb (25.22–28.65) for O3 (table 2). The correlations between pairs of pollutants were presented in eTable3. There was a strong correlation between NO2, NOx, and CO; O3 was negatively correlated with all other pollutants.
Distribution of estimated air pollution concentration based on monitoring stations and road intensity indicators (N=106 678)
In the multivariable analysis, PM2.5 was associated with an increased risk of active TB (adjusted HR per 10 μg/m3: 1.39; 95% CI 0.95 to 2.03), although the association did not reach statistical significance. There was no association between PM10 and active TB (adjusted HR per 10 μg/m3: 0.95; 95% CI 0.78 to 1.17) (table 3). In the analysis of specific pollutants, we found that NO2 (adjusted HR per 10 ppb: 1.33; 95% CI 1.04 to 1.70), NOx (adjusted HR per 10 ppb: 1.21; 95% CI 1.04 to 1.41) and CO (adjusted HR per ppm: 1.89; 95% CI 0.78 to 4.58) were associated with an increased risk of active TB (table 3). On the other hand, O3 was inversely associated with risk of TB (adjusted HR per 10 ppb: 0.69; 95% CI 0.49 to 0.98). When the outcome was changed from active TB to culture-confirmed TB to avoid misdiagnosis, the association between air pollution and TB increased (table 3). In the two-pollutant analysis, the associations between NO2 and NOx and active TB were robust to adjustment of other pollutants, while the associations between CO and PM2.5 with TB were attenuated after adjustment for NO2 and NOx (eTable 4). On the other hand, the inverse association between O3 and TB disappeared when NO2 and NOx were adjusted for. In the non-parametric analysis using penalised smoothing spline regression, there was no evidence of a major departure from the linear association between air pollution and risk of TB (eFigure 3).
Univariable and multivariable HRs and 95% CIs between air pollution (estimated using information from monitoring stations) and TB from the Cox proportional hazards analysis (number of active TB cases: 418)
In the analysis of road intensity as a proxy measure of traffic-related air pollution, the length of major roads within the 500 m buffer zone was possibly associated with risk of culture-confirmed TB (adjusted HR: 1.04/km; 95% CI 0.995 to 1.09), while the association for the length of all roads was weaker (adjusted HR: 1.01/km; 95% CI 0.99 to 1.04). In a separate analysis using the estimated air pollution from the land use regression models in selected districts, the number of TB cases was reduced to 149 (as opposed to the 418 cases in the main analysis). We did not find significant associations between active TB and PM2.5 (adjusted HR per 10 μg/m3: 0.91; 95% CI 0.60 to 1.38), PM10 (adjusted HR per 10 μg/m3: 0.88; 95% CI 0.55 to 1.40), NO2 (adjusted HR per 10 ppb: 0.97; 95% CI 0.67 to 1.39) and NOx (adjusted HR per 10 ppb: 1.04; 95% CI 0.92 to 1.16) (table 4).
Univariable and multivariable HRs and 95% CIs between air pollution (estimated from land use regression models) and TB from the Cox proportional hazards analysis (no. of active TB cases: 149)
Discussion
In this cohort study from a TB endemic setting, we found a possible link between ambient air pollution and risk of active TB. The positive association was observed for fine particles and several traffic-related pollutants, including NO2, NOx and CO. The association was stronger when the outcome was restricted to culture-confirmed TB. There was also a non-significant trend between the length of major roads in the neighbourhood and culture-confirmed TB. However, in a sensitivity analysis using land use regression models to estimate air pollution in a subpopulation, we did not find any significant association between air pollution and risk of TB.
To date, few studies have been conducted on ambient air pollution and TB. In a study of 196 patients with TB from California, Jassal et al25 found that the level of PM2.5 based on the residential proximity to the nearest monitoring station was associated with sputum smear positivity. However, the authors did not include individuals without TB as the control group; therefore, it was not possible to investigate the effect of air pollution on the incidence of TB. Several ecological studies have also been conducted. A historical trend analysis revealed a high correlation between coal consumption and TB incidence at the country level in the USA, Canada and China in the 20th century.9 In an ecological study from North Carolina, the level of PM was not associated with incidence of pulmonary TB in the county-level analysis.10 In Japan, Iwai et al26 found a positive correlation between suspended particles and TB mortality at the district level. Lastly, a study in South Korea reported a positive association between sulfur dioxide (SO2) and incidence of TB at the township level in males (relative risk (RR)=1.07 per ppb, 95% CI 1.03 to 1.12), but not in females RR=1.02 per ppb, 95% CI 0.98 to 1.07).7 We note that these ecological studies might have ecological fallacy and can suffer from confounding bias. Therefore, the interpretation of these results should be done carefully.
The point estimate of the association between PM2.5 and active TB in our study was larger than that of the observed associations between PM2.5 and cardiovascular disease, lung cancer and chronic respiratory disease in previous studies, although the wide CI in our estimate made the comparison difficult.7 Nonetheless, the observed positive associations were unlikely due to the confounding bias by other TB risk factors. We collected information of major risk factors for TB at the baseline, and adjusted for them as confounders in the analysis. An important concern in the study of health effects of air pollution is the potential confounding by neighbourhood socioeconomic status, that is, those living in the disadvantaged communities might be exposed to a higher level of air pollution.27 However, the situation is different in the study area (metropolitan Taipei) where the affluent neighbourhoods are concentrated in urban areas with severe traffic-related air pollution. In fact, as we adjusted for all potential confounding factors including the area-level socioeconomic information, the association between air pollution and TB increased, suggesting the presence of negative confounding (table 3). In other words, the true association between ambient air pollution and TB would have been even larger if there was residual confounding by area-level socioeconomic information.
In our main analysis, the exposure to air pollutants was estimated at the residential address based on the data from the nearest monitoring stations (with a total of 16 stations around the study area). The estimates may not accurately reflect the intensity of exposure to ambient air pollution of each individual. Since non-differential misclassification of exposure would most likely bias the results towards no association, the effect of air pollution on TB might be underestimated in our study. We also used the length of all roads and major roads near the residential address as a proxy measurement of air pollution, and we observed a non-significant trend for length of major roads and culture-confirmed TB. In addition, we applied cross-validated land use regression models to obtain estimates of air pollution in a subpopulation from selected districts. However, we did not observe significant associations between air pollution and TB in this part of the analysis. Since we were only able to include only 40% of the original participants in this sensitivity analysis, the lack of association might result from the reduction in statistical power and wider CIs. Future large cohort studies with improved methodology for air pollution exposure assessment (such as land use regression modelling) will provide more robust evidence on the association between air pollution and TB.
We caution on the causal interpretation of the observed associations for fine particles and traffic-related pollutants in this observational study, as the pollutants might be aetiologically linked to the development of TB or might simply be the surrogates of the aetiological agent. Nonetheless, several experimental studies have pointed to the biological plausibility that traffic-related air pollution can impair the host defence mechanism against M. tuberculosis. A murine model revealed that exposure to NO2 was associated with decreased pulmonary bactericidal activity.28 An in vitro study of human peripheral blood monocytes showed that exposure to diesel exhaust particles, a major component of traffic pollution, suppressed the nuclear factor kappa-light-chain-enhancer of activated B cells (NF-κB) pathway and decreased the Th1 immunity and impaired antimycobacterial response in humans.11Lastly, CO exposure induced the Dos regulon of Mtb cells and might be associated with the pathogenesis of TB.29 In our two-pollutant analyses, the associations between air pollution and TB seemed to be more robust for NOx and NO2 than for CO and fine particles.
We found an inverse association between O3 and TB, but the association should be interpreted carefully. O3 had a strong negative correlation with NOx and NO2 in our study population; therefore, the observed inverse association between O3 and TB might be due to confounding by other pollutants (eTable 4). Previous studies found that the estimated level of O3 from air quality monitors was a poor proxy for personal exposure, because O3 can react with other pollutants in the ambient environment, especially in the urban area.30 31 In experimental studies, O3 exposure in human alveolar macrophages was linked to decreased phagocytosis and impaired antimicrobial host defence.32 33 The exact relation between O3 and TB requires further investigation.
Our study has several major strengths. First, we used a prospective cohort design to investigate the association between ambient air pollution and TB. This study design avoids problems of control selection in case–control studies and the unclear temporal relationship between exposure and outcome. In addition, we used well-defined TB outcomes from the National TB Registry. The availability of TB culture data helped to reduce misclassification of TB outcome. Indeed, when we restricted the outcome to culture-confirmed TB only, the HRs between air pollution and TB further increased. Lastly, we collected baseline information of major risk factors for TB and adjusted for them as confounders in the multivariable analysis.
Our study also has limitations. In addition to the challenge of the air pollution exposure assessment discussed above, another potential source of exposure misclassification is address change during the study period. In the most recent internal migration survey in 2012, 8.2% of the residents of New Taipei City changed their addresses within the past year.34 However, the rate of migration at the national level was higher for those aged 15–24 years (21%) and 25–44 years (8.6%), and was much lower for those aged 45–64 years (2.8%) and above 65 years (1.8%). Since our study population belongs to the older population, we expect the rate of address change to be much lower than 8.2%. Nonetheless, this exposure misclassification would most likely be non-differential with regard to TB status and would also underestimate the association between air pollution and TB.
In addition, we were not able to analyse the source of particles in our study. A recent study in Taiwan found that PM2.5 came from multiple sources including non-traffic-related sources.35 Further studies are needed to disentangle the relation between PM2.5, traffic-related air pollution and active TB. Besides, the small to moderate variation in the level of air pollution in our study area reduced the statistical power of the study; the estimated associations between air pollution and TB were unstable with wide CIs. Lastly, we did not have information on the vital status of the participants, and we assumed that the participants were followed until the end of the study period. We conducted a sensitivity analysis to quantify the impact of missing vital status on the estimated association between air pollution and TB, and the result suggested a minimal impact on our conclusion (see online supplementary).
Conclusions
In conclusion, our cohort study provided initial evidence that fine particle pollution and traffic-related air pollution might be associated with an increased risk of TB incidence. Given the limitation of exposure assessment in this study and the scarcity of epidemiological studies on the association between ambient air pollution and TB, our result awaits confirmation by subsequent studies. Meanwhile, people from low-income and middle-income countries continue to be exposed to high levels of ambient air pollution and experience high rates of TB.1 36 If ambient air pollution is confirmed to increase the risk of TB in subsequent studies, the colliding epidemics of ambient air pollution and TB could substantially undermine the ongoing global effort to eliminate TB. We urge that further epidemiological studies are warranted to evaluate the potential impact of air pollution on the burden of TB.
Acknowledgments
The authors are grateful for the administrative support from Hsueh-Jung Lin, Chiung-Hui Hsieh and Chia-Chi Lee of the Public Health Department of New Taipei City.
References
Supplementary materials
Supplementary Data
This web only file has been produced by the BMJ Publishing Group from an electronic file supplied by the author(s) and has not been edited for content.
- Data supplement 1 - Online figures
Footnotes
Contributors H-HL had full access to all of the data in the study and takes responsibility for the integrity of the data and the accuracy of the data analysis. H-HL and C-CC were involved in the study concept and design. H-HL, T-CL, C-YC, C-FW and C-CC were involved in the acquisition, analysis or interpretation of data. H-H and T-CL were involved in the drafting of the manuscript. H-HL, T-CL, C-YC, C-FW, Yang, D-PL and C-CC were involved in the critical revision of the manuscript for important intellectual content. H-HL and T-CL were involved in the statistical analysis. C-CC obtained funding. H-HL, T-CL, S-LY, D-PL and C-CC were involved in the administrative, technical or material support. H-HL and C-CC were involved in the study supervision.
Funding This study was supported by the Taiwan National Health Research Institutes (EO-101-PP-09).
Competing interests None declared.
Patient consent Obtained.
Ethics approval This study was approved by the IRB of the National Health Research Institutes (EC1011004-E].
Provenance and peer review Not commissioned; externally peer reviewed.