Article Text

Abstract
Background: Despite the high burden from exposure to both hot and cold weather each year in England and Wales, there has been relatively little investigation on who is most at risk, resulting in uncertainties in informing government interventions.
Objective: To determine the subgroups of the population that are most vulnerable to heat-related and cold-related mortality.
Methods: Ecological time-series study of daily mortality in all regions of England and Wales between 1993 and 2003, with postcode linkage of individual deaths to a UK database of all care and nursing homes, and 2001 UK census small-area indicators.
Results: A risk of mortality was observed for both heat and cold exposure in all regions, with the strongest heat effects in London and strongest cold effects in the Eastern region. For all regions, a mean relative risk of 1.03 (95% confidence interval (CI) 1.02 to 1.03) was estimated per degree increase above the heat threshold, defined as the 95th centile of the temperature distribution in each region, and 1.06 (95% CI 1.05 to 1.06) per degree decrease below the cold threshold (set at the 5th centile). Elderly people, particularly those in nursing and care homes, were most vulnerable. The greatest risk of heat mortality was observed for respiratory and external causes, and in women, which remained after control for age. Vulnerability to either heat or cold was not modified by deprivation, except in rural populations where cold effects were slightly stronger in more deprived areas.
Conclusions: Interventions to reduce vulnerability to both hot and cold weather should target all elderly people. Specific interventions should also be developed for people in nursing and care homes as heat illness is easily preventable.
- CVD, cardiovascular disease
Statistics from Altmetric.com
The large death toll and disruption associated with the bitterly cold weather in Central and Eastern Europe in the winter of 2005–6 was a timely reminder of how poorly prepared many populations are to the dangers of extreme cold temperatures (http://news.bbc.co.uk/1/hi/world/europe/4643718.stm). Similarly, the dangers of hot weather were shown dramatically by the 2003 heat wave that accounted for >30 000 deaths throughout western Europe,1 and >2000 deaths in England and Wales alone.2
Health protection measures are being increasingly developed. The Department of Health’s heatwave plan for England was implemented rapidly in 2004 and includes monitoring of health surveillance data.3 Measures to prevent cold-related mortality currently focus on activities to reduce fuel poverty and improve home insulation,4 as well as advise about behaviour when outdoors.5 However, many uncertainties remain in the identification of those most vulnerable to both hot and cold weather and the most effective means of health protection.
Excess winter mortality in the UK, although falling, is higher than in other European countries.6 Some of this high winter burden can be explained by behavioural factors reflecting poor adaptation to cold weather,7,8 and poorly insulated housing also has a key role.4 It has been observed that winter mortality can be higher among lower social classes9,10; however many others have observed no association with deprivation in the UK,11–17 which is consistent with poorly heated homes being more prevalent in the middle classes.
Information from heatwave events in the US and Europe suggests that vulnerability to heat can be modified by intrinsic factors such as age,2 sex18,19 and possibly race.20 Other “acquired” characteristics may also predispose individuals to heightened susceptibility to environmental exposures.21 These include pre-existing medical conditions such as cardiorespiratory diseases, neurological diseases and mental illness.19
As with cold, the evidence for whether effects of heat are modified by socioeconomic status is unclear. Studies from the US have observed an association with deprivation,22–26 where lack of air conditioning is a strong marker for poverty. However, other work, using area-level indicators, observed no modification of the heat effect in Sao Paulo.27 Other contextual characteristics that increase susceptibility to heat exposure are social isolation,28,29 living in urban areas30 and living on the top floors of buildings.31 Many deaths in France during the 2003 heat wave occurred in nursing and residential homes.32 Important differences in heatwave mortality were also reported between cities in Europe.1 The population in the northern part of France, away from the Atlantic coast, was most affected.33
By using long time-series datasets of daily mortality counts for each region of England and Wales, we investigated which subgroups of people are most at risk from exposure to hot and to cold weather. Risk factors were identified by linkage of mortality files to small area-level variables on the 2001 UK census and to a database of all care and nursing homes to determine whether or not individuals were residents of care homes at the time of death.
METHODS
Mortality data
All deaths recorded between 1993 and 2003 for all regions of England and Wales were obtained from the Office for National Statistics. Table 1 shows the classification of deaths into broad cause-of-death groups. Deaths were postcode-linked to a database of care and nursing homes in the UK to determine whether individuals had been residents of care or nursing homes at the time of death. This database was obtained from a market intelligence company (http.//www.laingbuisson.co.uk) and included information on every care and nursing home in the UK (including local authority homes) registered in 2003. Most records are fully postcoded, except for a few small registered homes where local authority records are incomplete. Non-linked deaths were assumed to be from non-care-home settings.
Cause of death groupings
Postcode information on the death certificate was used to link the deaths to census output areas, which have an average population size of 300 residents and are the smallest geographical areas for which detailed 2001 UK census results are available. The urban and rural classification 200434 was used to classify the output area as urban (where the majority of the population in the output area falls inside an urban area with a population of ⩾10 000) or rural (all other output areas).
Each death was also linked at the census area statistic ward level to the following 2001 census variables35 that may modify temperature effects: proportion of all people aged ⩾65 years who are living alone; proportion of all people living in a flat, maisonette or an apartment; proportion of all people of all ages who describe themselves as Asian; and proportion of all people of all ages who describe themselves as black. Wards are subdivisions of local authorities with an approximate national average of 5500 people, but with more populous wards occurring in large urban areas.
To allocate an area-level measure of deprivation, the postcodes were linked to indices of multiple deprivation for England36 and Wales.37 These are composite scores based on a range of indicators using a mixture of census data and other routinely available indicators across several domains of deprivation, such as employment, income, housing and health. The underlying indicators and construction of the index are different between England and Wales, and therefore deprivation was considered separately in each country. To be consistent with the census data linkage, the scores which are available at the Super Output Area (groups of output areas) were summarised into a population-weighted average at the census area statistic ward level.
These data were then collapsed into a count of total mortality for each day during the 11-year study period. Counts were subdivided by region, sex, age group (0–64, 65–74, 75–84, ⩾85 years), cause of death (cardiovascular, respiratory, external or other), urban or rural, long-term care status (care home, nursing home or none), and region-specific quintiles of the census and deprivation variables.
Data on weather, air pollution and influenza
Daily maximum and minimum temperature data (°C) for 1993–2003 were obtained from the Central England Temperature series, a weighted mean temperature indicator for Central England.38 In addition, for all regional analyses, the same data were collected from one site representative of each region from the British Atmospheric Data Centre (table 2). Daily mean temperature for each series was created by taking the mean of the daily maximum and daily minimum values.
Location of regional meteorological office weather stations
The short-term relationship between temperature and mortality may be confounded by air pollution levels and influenza epidemics. Therefore, daily ambient levels of PM10 and ozone (μg/m3) were collected from the National Air Quality Monitoring Network, London, UK. One monitoring site in each region for each pollutant that provided most non-missing data was deemed sufficient to provide a measure of temporal change. For the regions in England, weekly reports of laboratory-confirmed influenza A and influenza B activity were also collected from the Centre of Infection, Health Protection Agency, London, UK.
Statistical analysis
Each daily mortality series was examined in relation to daily temperature using Poisson generalised linear models allowing for overdispersion.39 Cubic smoothing splines of time with equally spaced knots were used to control for secular trends in the mortality series and any additional confounding by seasonally varying factors other than temperature. Seven degrees of freedom (df) per year for these smoothing splines (roughly equivalent to a 2-month moving average) were used.40 This number of degrees of freedom was chosen as a compromise between providing adequate control for unmeasured confounders and leaving sufficient information from which to estimate temperature effects. The same level of seasonal control was conducted on each series, although estimates were found to be largely unchanged when differing levels of seasonal control were considered in sensitivity analyses.
Daily levels of particulate matter with a diameter of <10 µm and ozone (average of current and previous days) were incorporated into each regression model as possible confounding variables, regardless of statistical significance. Weekly reports of laboratory-based influenza A and B activity were also adjusted for and indicator variables were used to allow for any day-of-week effects.
To establish the general relationship between mortality and temperature, natural cubic splines of the temperature measure (df = 3) were regressed against model residuals after controlling for the above-mentioned confounding factors. The heat relationship was modelled using temperature averaged across values on the same day and the day before the day of death (lags 0–1). As effects of low temperatures are more delayed,41 separate models using temperature averaged across values lagged by 0–13 days before the day of death (lags 0–13) were used to model cold effects.
For quantification of temperature effects, simple linear threshold models were assumed—that is, models which assume a log-linear increase in risk above a heat threshold and below a cold threshold. To estimate temperature effects relative to regional climates, the heat threshold was derived from the 95th centile of mean temperature (average of lags 0–1) and the cold threshold (average of lags 0–13) from the 5th centile for each region separately. Linear heat and cold effects were estimated simultaneously. As a sensitivity analysis, effects for cold were also estimated using the summation of lags 0–13 when each of these lags was entered separately into the regression model—namely, an unconstrained distributed lag model.42 However, results using this approach were largely unchanged.
All analyses were repeated separately for each region. Region-specific estimates of heat and cold effects were pooled across regions in a fixed-effects meta-regression to provide mean estimates.
As temperature-related risk factors may be modified by place of death, all analyses were repeated on just those deaths occurring at home. All analyses were conducted using Stata V.9.43
RESULTS
Table 3 shows summary statistics of the daily mortality and temperature data. The more elderly population of the East and South of England are reflected in a higher percentage of deaths in the ⩾85 years of age group in these regions. The percentage of deaths in males for the whole of England and Wales (not shown in the table) was 47.8% and the percentage of deaths due to cardiovascular disease (CVD), respiratory disease and other causes was 41.0%, 15.5% and 2.9%, respectively. There were few regional departures from these distributions except that there was a slightly lower percentage of male deaths in southeast England, a slightly higher percentage of deaths due to respiratory disease in London, more deaths due to CVD in Wales and more deaths due to CVD and less deaths due to respiratory disease in southwest England.
Summary statistics of daily mortality and mean temperature, by region
Mean summer temperatures were highest in the southern regions, with London having particularly high levels, and mild wintertime temperatures were observed in Wales and the South West due to the Gulf Stream.
Temperature–mortality relationships
Figure 1 shows the relationship of the relative risk (RR) of death (all regions) with daily mean temperature from the Central England Temperature series, subdivided by age and cause. Graphs A and B show the relationship with temperature averaged across lags 0–1 to model the heat effect, and graphs C and D show temperature averaged across lags 0–13 to model the cold effect.

Adjusted relationship between relative risk of death and mean temperature, by age group and cause of death. av lags, average of lags; CVD, cardiovascular disease; Resp, respiratory.
In general, effects for both heat and cold were stronger in the more elderly age groups. Heat effects seemed to begin once mean temperature reached a value of 17–18°C and cold effects were strongest once temperatures fell below about 5°C. The relationship of death with both heat and cold seemed fairly linear above and below the threshold points.
An increase in deaths was associated with high temperatures in all cause-of-death groups; however, effects were strongest for respiratory disease and deaths from external causes. With longer lags of temperature, risks were particularly strong for low temperature and those with respiratory disease. When repeating this analysis by age group (not shown), heat effects were strong in those with respiratory disease only for the ⩾85 years age group, whereas for the 0–64 year age group the strongest heat effect was on external causes. Both respiratory and external causes were strongly associated with cold in the ⩾85 years age group, but only respiratory deaths were cold related in the 0–64-year olds.
Figure 2 shows the temperature relationships by sex and rurality. Heat effects were stronger in females than males, but little modification of the cold effect was observed by sex. Similarly, a stronger heat effect was observed for those people living in urban areas, but no differences were observed for cold.
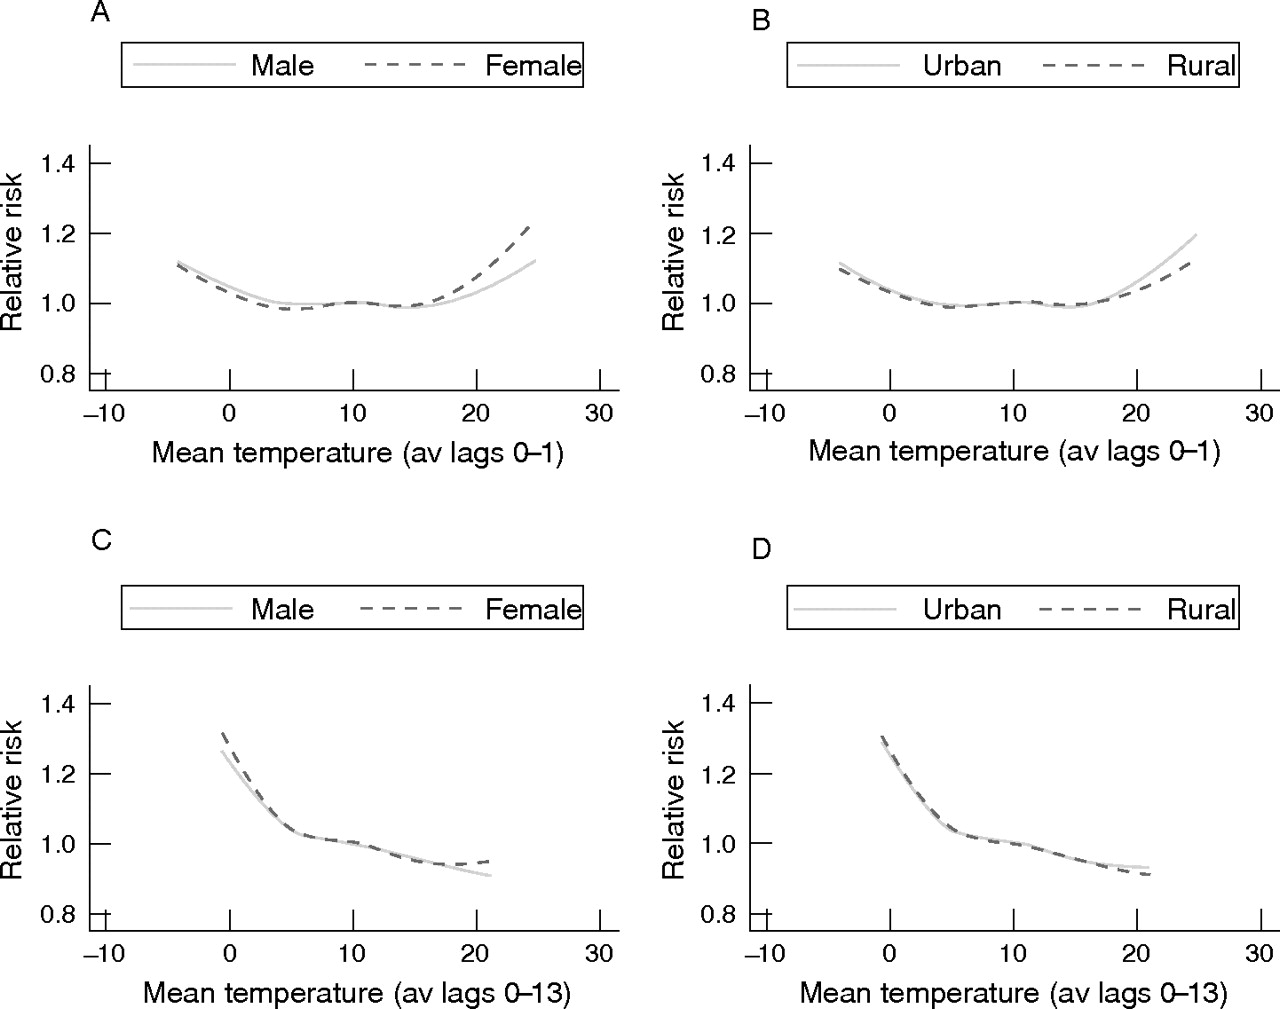
Adjusted relationship between relative risk of death and mean temperature, by sex and rurality. av lags, average of lags.
Figure 3 shows the temperature relationships by long-term care status. A stronger effect for both heat and cold exposure was observed in deaths in nursing homes than those in care homes, which in turn was stronger than for non-residential home deaths. This differential remained for heat exposure when analysis was restricted to the ⩾85 years age group; in the case of cold weather, however, all groups now seemed equally vulnerable (data not shown).
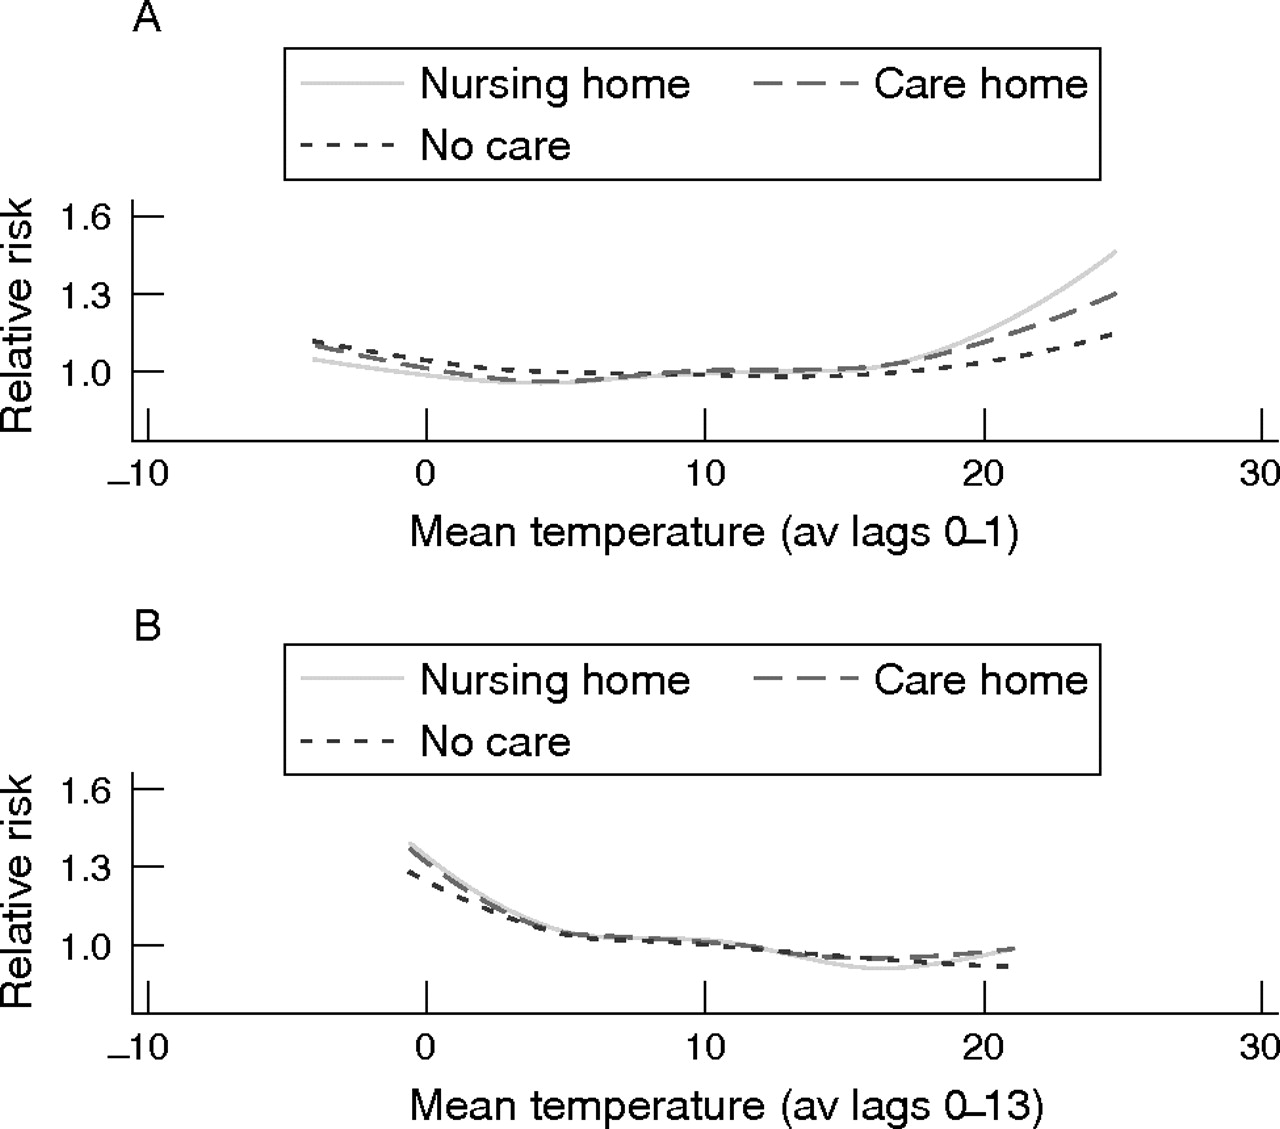
Adjusted relationship between relative risk of death and mean temperature, by long-term care status. av lags, average of lags.
Regional estimates
All the above relationships were largely unchanged when analyses were repeated for individual regions, although a stronger cold effect in rural settings was apparent in the regions of the North and the Midlands.
Figure 4 shows for each region the RR of total mortality associated with a 1°C change in temperature above and below region-specific heat and cold thresholds. Also shown is a mean effect estimated from a fixed-effect meta-analysis, giving a RR of 1.03 (95% confidence interval (CI) 1.02 to 1.03) for each degree increase in high temperature, and twice that for the cold effect: RR 1.06 (95% CI 1.05 to 1.06). Heat effects were strongest in London compared with other regions. Cold effects seemed particularly strong in the East of England; however, the amount of data available for this time series was much reduced because of missing pollution data. When pollution was not controlled for, and the full 11 years of deaths were analysed, the cold estimate for the East region was more in line with the other regional estimates: RR 1.06 (95% CI 1.05 to 1.07).

Relative risk of heat-related and cold-related death for every 1°C change in mean temperature, by region and combined estimate.
Figure 5 shows the mean estimate per degree change by sex and age groups. The heat effect was greater in women than in men for all age groups ⩾65 years, and the differences become larger with increasing age. Cold effects were not modified by sex within each age group.

Relative risk of heat-related and cold-related death for every 1°C change in mean temperature, by sex and age group.
Deprivation and census variables
Very little modification was observed by quintiles of deprivation for either the heat or cold effect in any of the 10 regions studied. Figure 6 shows the mean estimate for each level of deprivation separately for urban and rural settings. As before, the heat effect was stronger in urban locations than in rural settings. However, there was very little pattern across quintiles of deprivation. The notable exception to this was for cold exposure in rural areas where a stronger effect seemed to be in evidence for increasingly deprived groups, but conventional levels of significance were not reached in a test for trend because of the wide CIs in the individual estimates.

Relative risk of heat-related and cold-related death per degree change in mean temperature, by rurality and quintiles of deprivation. 1, least deprived group, 5, most deprived.
There was little evidence of modification of either the heat or cold effect by quintiles of the proportion of people living in flats, the proportion of elderly (aged ⩾65 years) people living alone or the proportion of ethnic minority groups (not shown).
Restriction of all analyses to only those deaths occurring at home (20.0% of all deaths) did not substantially alter any of the temperature relationships except that a heat effect in rural communities was no longer apparent.
DISCUSSION
Our results confirm that elderly people are most at risk from temperature-related mortality, but within this group there are important determinants of risk. Women aged ⩾65 years seem to be at increased risk of heat-related mortality. There may be an adverse effect of menopause on thermoregulation, in addition to its effects on cardiovascular fitness. Other studies have also shown greater vulnerability to heat in women.19,44 Important social factors may explain differences in mortality patterns between men and women during heat waves. For example, in Paris, the heat risk increased for unmarried men but not for unmarried women, and being a foreign national benefited women but not men.45 Macey and Schneider44 found stronger cold effects in men, whereas Wilkinson et al16 reported an increased cold risk in women. We observed little modification of the cold effect by sex.
Clear regional differences were observed in the temperature–mortality relationships, with London residents being particularly vulnerable to heat effects. Cold exposure seemed particularly strong in the East region of England; however, the estimate was much reduced when years with missing pollution data were also included in the analysis. Previous work has also hinted at stronger cold effects in the East region,46 which may be partly explained by a relatively old population and also by exposure to cold winds. Although the importance of wind chill has been shown,47,48 wind chill was not found to be a better predictor of mortality than temperature alone.49 Additional analysis (not shown) of our East region data showed that mean wind speed (measured in knots) did not predict mortality in our models, but wind direction did slightly (measured as north, south, east or west derived from degrees true). Only wind direction on the same day as the day of death was predictive, and no interactions between wind direction and cold temperature were observed. Also, estimates for both heat and cold remained unchanged when relative humidity (%) was controlled for.
When analysing by cause, we observed that deaths from respiratory and external causes were most strongly associated with hot weather, although it should be remembered that these two groups accounted for only 18.4% of all deaths in England and Wales during the study period. Although weather and health studies rarely consider effects on deaths from external causes, our results suggest a strong heat signal from such causes in the 0–64 years age group. Such deaths are unlikely to be explained by short-term forward displacement of already vulnerable people (“harvesting”), and so represent substantial shortening of lives.50 Other studies have reported increases in hospital attendance for injuries in young children on dry and sunny days.51,52 Few deaths are categorised as heat stroke being an underlying cause of death. The relationship between cold weather and external diagnoses in the ⩾85 years age group may represent causes such as hypothermia53 and accidents from falls.54
Linkage of deaths with postcodes of care homes showed that people in nursing homes and, to a lesser extent in care homes, were most vulnerable to the dangers of hot and cold weather. Some studies have shown acute heat effects on people in care homes,19,55 but Holstein et al56 showed that during the 2003 heat wave in Paris, less frail patients made the largest contribution in nursing homes to excess mortality. People in nursing and care homes tend to be frail, but their risk of dying should not necessarily be increased by temperature extremes if prevention measures are in place. Currently, nursing homes in the UK are not generally air conditioned, but our results show the need for interventions such as the Department of Health’s heatwave plan for England3 to pay particular attention to training of staff and the infrastructure in such institutions.
As with many other studies, we found no relationship of cold with deprivation.11–17 Previous work has shown that people in lower socioeconomic groups do not necessarily live in cooler homes, as housing association and local authority dwellings tend to be well heated,4 whereas large owner-occupied houses may, on the other hand, be more difficult to heat. Reliance on poor public transport systems may increase exposure to outdoor cold, particularly in more rural areas.57 Lawlor et al58 observed no association between excess winter mortality and rurality in one region of England, whereas Macey and Schneider44 reported a greater risk in rural areas. Our results suggest an increased risk in rural populations only in certain regions of England, but perhaps more importantly, we observed that within these rural populations, cold effects may indeed be stronger in more deprived areas.
Heat effects were observed to be particularly severe in urban areas. This is probably due to the heat-island effect whereby greater heat retention occurs in more heavily built-up areas.59,60 In contrast with studies from the US,22,23,25,26 we observed no modification of the heat effect by deprivation. This difference is likely to be due to the fact that lower social class in the US will, to a large extent, reflect lack of ownership of home air-conditioning units, whereas in the UK, at least at present, few households have such systems.
However, the lack of modification of either the heat or cold effect by quintiles of deprivation may also reflect the fact that area-level markers are being used to represent individual circumstances. Other variables measured at the electoral ward level, such as living arrangement and ethnicity, also seemed to show no modification of temperature effects.
By analysing deaths for the whole of England and Wales, individual-level differences in the heat and cold effect within subgroups of the population could be accurately estimated. In particular, by linking the individual mortality files to the postcoded database of care homes, we could uniquely identify whether each death occurred in care, nursing or home residents. Smaller care homes may not have had unique postcodes and there may have been some de-registering of care homes over the study period; however, such misclassification would only serve to reduce any temperature differentials.
In conclusion, our results provide evidence of differences across the population of risk to temperature-related mortality. Public health initiatives to combat the dangers of ambient temperatures should be targeted to elderly people and residents in long-stay care who are particularly vulnerable to both hot and cold weather.
Main messages
-
The effects of both heat and cold on mortality are apparent throughout the elderly population, but those living in nursing and residential homes are at highest risk.
-
Children and adults (aged 0–64 years) were also affected by heat from deaths from external causes.
-
Vulnerability to either the heat or cold was not modified by deprivation, except in rural populations where cold effects were slightly stronger in more deprived areas.
-
There were few regional differences, except that heat effects were particularly strong in London and cold effects were possibly stronger in the East of England.
Policy implications
-
Improvements in care and the indoor environment (such as better staff training and the installation of space conditioning) are needed to reduce vulnerability in nursing and care homes.
Acknowledgments
We thank the Office for National Statistics, London, UK, for supplying the data on mortality.
REFERENCES
Footnotes
-
Published Online First 21 September 2006
-
Funding: This work was undertaken as part of “EUROHEAT: Responses to Heat-waves in Europe”, funded by the European Commission DG SANCO (agreement number 2004322).
-
Competing interests: None.