


Abstract
A cloned rat proteinase-activated receptor (PAR)2-expressing cell line (KNRK-rPAR2) was used to study the structure-activity relationships (elevated intracellular Ca2+) for a series of: 1) PAR1-derived receptor-activating ligands (PAR1-APs) [SFLLR (P5), SFLLR-NH2(P5-NH2), SFLLRNP (P7), SFLLRNP-NH2(P7-NH2), and TFLLR-NH2 (TF-NH2)] and 2) PAR2-derived-activating-peptides (PAR2-APs) [SLIGRL-NH2 (SL-NH2), SLIGR-NH2 (GR-NH2), and SLIGKV-NH2(KV-NH2)]. The activities of the PAR-APs were compared with the PAR2-AP analogtrans-cinnamoyl-Leu-Ile-Gly-Arg-Leu-Orn-NH2tc-NH2), which as a [3H]propionyl derivative ([3H]propionyl-tc-NH2) was used to develop a radioligand-binding assay for PAR2. The relative potencies of the PAR-APs in the Ca2+-signaling assay were tc-NH2 = SL-NH2 > KV-NH2≅ P5-NH2 > GR-NH2 > P7-NH2 > P7 > P5 > TF-NH2. The reverse sequence PAR-APs, LSIGRL-NH2(LS-NH2), LRGILS-NH2 (LR-NH2), FSLLRY-NH2 (FSY-NH2), and FSLLR-NH2(FS-NH2), as well as the XenopusPAR1-AP TFRIFD-NH2, were inactive. The relative biological potencies of the peptides were in accord with their ability to compete for the binding of [3H]propionyl-tc-NH2 (tc-NH2= SL-NH2 > GR-NH2 ≅ P5-NH2 > P5) to KNRK-rPAR2 cells, whereas inactive peptides (FS-NH2; LR-NH2) showed no appreciable binding competition. Our data therefore validate a ligand-binding assay for the use in studies of PAR2 and indicate that the relative biological potencies of the PAR1-APs for activating rat PAR2 parallel their ability to activate human PAR1. The relative receptor-binding activities of the PAR-APs, although in general agreement with their relative biological activities, point to differences in the intrinsic receptor-activating activities between the several PAR-APs. The binding assay we have developed should prove of use for the further study of PAR2-ligand interactions.
Apart from their well recognized abilities to trigger proteolytic enzyme cascades, thrombin and trypsin are known to regulate tissues via the activation of proteinase-specific cell surface G protein-coupled receptors (Rasmussen et al., 1991; Vu et al., 1991; Hollenberg et al., 1996; Brass and Molino., 1997; Ishihara et al., 1997). The unique mechanism by which the proteinase-activated receptors (PARs) are stimulated involves the proteolytic unmasking of a cryptic tethered receptor-activating sequence. The intriguing property of the tethered-ligand (TL) mechanism is that, in isolation, synthetic peptides based on the revealed TL sequence can activate the receptor in the absence of the proteinase (Vu et al., 1991).
Considerable work has now been done using receptor-activating peptides (PAR-APs) as surrogate receptor agonists to stimulate the PAR1 receptor for thrombin (Rasmussen et al., 1991, Vu et al., 1991) and the so-called PAR2receptor activated by trypsin and tryptase (Nystedt et al., 1994, 1995;Corvera et al., 1997; Mirza et al., 1997; Molino et al., 1997). The more recently described thrombin receptor, PAR3, is not activated by such receptor-derived peptides (Ishihara et al., 1997). Unexpectedly, it has been found that the PAR-APs derived from human PAR1 (e.g.,.SFLLR-NH2, SFLLRNP-NH2, and so on) are capable of activating both PAR1 and PAR2 (Blackhart et al., 1996; Hollenberg et al., 1997; Kawabata et al., 1999), whereas such peptides are unable to activate PAR3 (Ishihara et al., 1997). Conversely, the PAR2-APs (e.g., SLIGRL-NH2) have been found to activate PAR2 selectively without activating either PAR1 or PAR3 (Blackhart et al., 1996; Hollenberg et al., 1997; Ishihara et al., 1997). To understand the differences between the tethered ligand sequences for activating the different PARs, it will be necessary to 1) critically assess the peptide structure-activity relationships (SARs) that govern the biological activities of a selected set of PAR-APs for each of the responding PAR family members in isolation and 2) develop a reliable ligand-binding assay to separately assess the ability of a given PAR-AP to both bind to and activate an individual PAR. The development of a reliable ligand-binding assay for the PARs faces unique challenges (Cuatrecasas and Hollenberg, 1976) because of the comparatively low receptor-binding affinity of the PAR-APs (micromolar to submicromolarKD values). Although a successful PAR1 ligand-binding assay has been developed using a high-affinity probe, the radioligand used for that study (Ahn et al., 1997) can interact with both PAR1 and PAR2 (Kawabata et al., 1997, 1999) and therefore does not provide sufficient receptor selectivity for studies of tissues other than platelets, which do not possess PAR2.
The main aim of our study was to develop a PAR2-binding assay. To this end, it was essential to 1) evaluate PAR-AP SARs in the PAR2-expressing KNRK cells and 2) use the SARs as a basis to validate the ligand-binding assay for PAR2 using the same cell system. We used the same series of PAR1-APs that had previously been evaluated for their biological activities in a rat aorta tissue bioassay, in cultured human embryonic kidney (HEK) cells, and in human platelets, namely SFLLR (P5), SFLLR-NH2 (P5-NH2), SFLLRNP (P7), and SFLLRNP-NH2(P7-NH2) (Vassallo et al., 1992; Hollenberg et al., 1993, 1996; Tay-Uyboco et al., 1995; Saifeddine et al., 1996). In addition, we used the PAR2-APs, SLIGRL-NH2 (SL-NH2), SLIGKV-NH2 (KV-NH2), and SLIGR-NH2 (GR-NH2). All of the peptides we evaluated in the work we report here have been found previously to activate either the human or rat PAR1 and PAR2 with greater or lesser potencies (Al-Ani et al., 1995; Böhm et al., 1996;Saifeddine et al., 1996; Hollenberg et al., 1997).
For the binding assay, we synthesized the peptidetrans-cinnamoyl-Leu-Ile-Gly-Arg-Leu-([3H]propionyl)Orn-NH2([3H]tc-NH2), in keeping with the work of Bernatowicz et al. (1996), who prepared a comparable PAR1-targeted peptide. Thetrans-cinnamoyl-PAR2-derived peptide is a potent and selective activator of PAR2(Vergnolle et al., 1998) that can be radiolabeled at the free ornithine amino group with [3H]propionic anhydride to yield [3H]tc-NH2 as a radioligand-binding probe. The relative affinities of the PAR-APs in the radioligand-binding assay were compared with their relative biological activities in a calcium-signaling assay using the PAR2-expressing KNRK-rPAR2cells. We were particularly interested in the relative potencies of the PAR1-APs for activating PAR2.
Materials and Methods
Receptor Expression.
Rat PAR2(Saifeddine et al., 1996) was expressed in Kirsten virus-transformed rat kidney cells (KNRK; American Type Culture Collection, Bethesda, MD) using the pcDNA3 mammalian expression vector (InVitrogen, San Diego, CA), in keeping with the expression of human PAR2in KNRK cells (Böhm et al., 1996). In this cell line, although PAR2 mRNA can be detected by a polymerase chain reaction (PCR) approach (see Results), insufficient receptor is expressed in the nontransfected cells to yield an appreciable calcium signal in response to either trypsin or PAR2-APs (Böhm et al., 1996); nor are cell surface receptors detectable by immunofluorescence using a rat PAR2-targeted receptor antibody (Kong et al., 1997; see Results). Cells were transfected using either the calcium phosphate precipitation technique or the Lipofectamine method, according to the manufacturer’s instructions (GIBCO BRL, Gaithersburg, MD). Transfected cells were subcloned in geneticin-containing medium (0.6 mg/ml), and receptor-bearing cells were isolated with the use of the antireceptor B5 antibody and fluorescence-activated cell sorting to yield a permanent cell line (KNRK-rPAR2). The KNRK-rPAR2 cells were routinely propagated in geneticin (0.6 mg/ml)-containing Dulbecco’s modified Eagle’s medium supplemented with 5% (v/v) FCS, using 80-cm2plastic T-flasks. Cells were subcultured by resuspension in calcium-free saline/EDTA solution, without the use of trypsin. Background KNRK cells were similarly grown in geneticin-free medium. A KNRK cell line transfected with an “empty” pcDNA3 vector was also subcloned and grown in geneticin-containing medium, as for the KNRK-rPAR2 cells. The expression of PAR2 in the KNRK cells was documented both by immunofluorescence and by a reverse transcription (RT)-PCR approach. The B5 antireceptor antibody used in previous work (Kong et al., 1997) was raised in rabbits using a peptide corresponding to rat PAR2(G30PNSKGRSLIGRLDTP46-YGGC) coupled to keyhole limpet hemocyanin (YCGGC added for conjugation). Cells to be used for immunocytochemistry were grown to 90% confluence on 2.2-cm2 glass coverslips, rinsed free from growth medium with isotonic PBS, pH 7.4, and fixed for 30 min at 24°C in 4% (w/v) paraformaldehyde, followed by rinsing with the isotonic buffer. Fixed cells were then incubated overnight at 4°C with a 1:1000 dilution of anti-PAR2 antiserum (B5; Kong et al., 1997), made up as a drop on parafilm in a total volume of 50 μl (without or with the addition of 20 μg/ml concentration of immunizing peptide for “preadsorption”), onto which the fixed cell coverslip was placed face down. Unadsorbed antiserum was washed from the coverslip with PBS, and cyanine 3-coupled goat anti-rabbit IgG (1:100 dilution; Cedarlane Laboratory, Hornby, Ontario, Canada) was used to detect cell surface-bound B5 antireceptor antibody. To assess the presence of increased PAR2 mRNA in the KNRK-rPAR2cells, total RNA was prepared from confluent T-flasks using the TRI reagent (Molecular Research Center, Cincinnati, OH). The RNA was reverse-transcribed with a first-strand cDNA synthesis kit using pd(N)6 primer (Pharmacia LKB Biotechnology, Uppsala, Sweden) according to manufacturer’s recommendations at 37°C for 30 min; 3 μl of this solution was used with primer pairs targeted to rat PAR2: forward primer, PAR2F: 5′-CACCACCTGTCACGATGTGCT-3′, and reverse primer, 5′-CCCGGGCTCAGTAGGAGGTTTTAACAC-3′. The signal yielded by the PAR2 amplimers was normalized to the PCR signal generated from the same RT product using an actin primer pair (Watson et al., 1992) that spans an actin intron: forward primer, 5′-CGTGGGCCGCCCTAGGCACCA-3′, and a reverse primer, 5′-TTGGCCTTAGGGTTCAGGGGG-3′. The detection of an intron-free 243-base pair product using this primer pair can confirm the absence of DNA-derived intron sequences in the RT product obtained from the cell-derived RNA preparation. Routinely, amplification was done using 2.5 U of Taq DNA polymerase (Promega, Madison, WI) in a 10 mM Tris · HCl buffer, pH 9.0 (50:l, final volume) containing 1.5 mM MgCl2, 50 mM KCl, 0.1% (v/v) Triton X-100, and 0.2 mM concentration of each dNTPs. Amplification was allowed to proceed for 25 cycles beginning with a 1-min denaturing period at 94°C, followed by a 1-min reannealing time at 55°C and a primer extension period of 1 min at 72°C. The PCR products were separated by 1.5% agarose gel electrophoresis and visualized with ethidium bromide. A 560-base pair product yielded by the PAR2amplimers has been documented previously by sequence analysis to represent rat PAR2 (Saifeddine et al., 1996). The cell population isolated by fluorescence-activated cell sorting for subculturing was obtained from a fraction in which >95% of the population was found to exhibit cell surface fluorescence using the B5 receptor antibody. The approximate number of antireceptor antibody-binding sites per cell was estimated fluorometrically with the use of Quantum Simply Cellular microbeads (Flow Cytometry Standards Corp., San Juan, Puerto Rico) according to the manufacturer’s instructions and in keeping with previous work (Lopez et al., 1992; Zagursky et al., 1995). However, our polyclonal rabbit B5 antireceptor antibody was used instead of a monoclonal mouse antireceptor antibody, as described previously (Lopez et al., 1992;Zagursky et al., 1995).
Measurements of Calcium Signaling Using Fluorescence Emission.
Cells to be used for measurements of peptide-stimulated fluorescence emission (reflecting an increase in intracellular calcium) were grown to about 85% confluence in 80-cm2T-flasks and were disaggregated with calcium-free isotonic PBS containing 0.2 mM EDTA. Disaggregated cells were pelleted by centrifugation and were resuspended in 1 ml of Dulbecco’s modified Eagle’s medium/10% FCS for loading with the intracellular calcium indicator, Fluo-3 (Molecular Probes Inc., Eugene, OR) at a final concentration of 22 μM (25 μg/ml) of Fluo-3 acetoxymethyl ester. Indicator uptake was established over 20 to 25 min at room temperature in the presence of 0.25 mM sulfinpyrazone, after which cells were washed two times by centrifugation and resuspension with the buffer described below to remove excess dye. Fluo-3-loaded cells were then resuspended to yield a stock solution (about 6 × 10⁶ cells/ml) in a buffer of 150 mM NaCl, 3 mM KCl, 1.5 mM CaCl2, 20 mM HEPES, 10 mM glucose, and 0.25 mM sulfinpyrazone. Fluorescence measurements, reflecting elevations of intracellular calcium, were conducted at 24°C using a Perkin-Elmer fluorescence spectrometer, with an excitation wavelength of 480 nm and emission recorded at 530 nm. Cell suspensions (about 2 ml of approximately 3 × 10⁵ cells/ml) were maintained in suspension with a stirred (magnetic flea bar) thermostatted cuvette (total volume, 4 ml), and peptide stock solutions were added to monitor peptide-induced changes in fluorescence. To construct concentration-response curves for fluorescence yield, the signals caused by the addition of test peptides were expressed as a percentage (% A23187) of the fluorescence peak height yielded by replicate cell suspensions when treated with 2 μM concentration of the ionophore A23187 (Sigma Chemical Co., St. Louis, MO). This concentration of A23187 was at the plateau of its concentration-response curve for a fluorescence responses. Under the assay conditions, the addition of proteinase inhibitors (e.g., Amastain) did not potentiate or diminish the fluorescence response caused by the PAR-APs; thus, routinely, proteinase inhibitors were not added to the assay cuvettes.
Evaluation of Receptor Desensitization.
Measurements of receptor desensitization using the fluorescence assay made use of the principle that exposure of a tissue to a maximally effective concentration of a receptor agonist leads to a diminution/desensitization of the response of that receptor to the further cumulative action of the same agonist, but response of the tissue to a second agonist that activates a distinct receptor system is not affected. We used a protocol developed for evaluating PAR1/PAR2cross-sensitization in cultured HEK cells (Kawabata et al., 1997,1999). In brief a test compound, at the plateau of its concentration-effect curve, was first added to the cell suspension and the calcium signal generated (peak height) was recorded. The fluorescence signal was allowed to return to baseline (see Fig. 2), and exactly 10 min thereafter (a time required for the refilling of intracellular calcium stores in the continued presence of the first agonist), a second agonist was added to the cuvette at a concentration below or in the mid-range of its concentration-effect curve; the calcium signal (or lack thereof) was recorded. Immediately thereafter, the response of a fresh cell suspension to the same concentration of the second agonist was monitored. The diminution of the response to the second agonist, caused by the prior addition of the first agonist, was taken to indicate that both agonists were activating/desensitizing the same receptor (i.e., PAR2 in the KNRK-rPAR2 cells). Measurements were done using three or more replicate cell suspensions derived from two or more independently grown crops of cells. Values in the figures represent the average ± S.E.M. (bars).

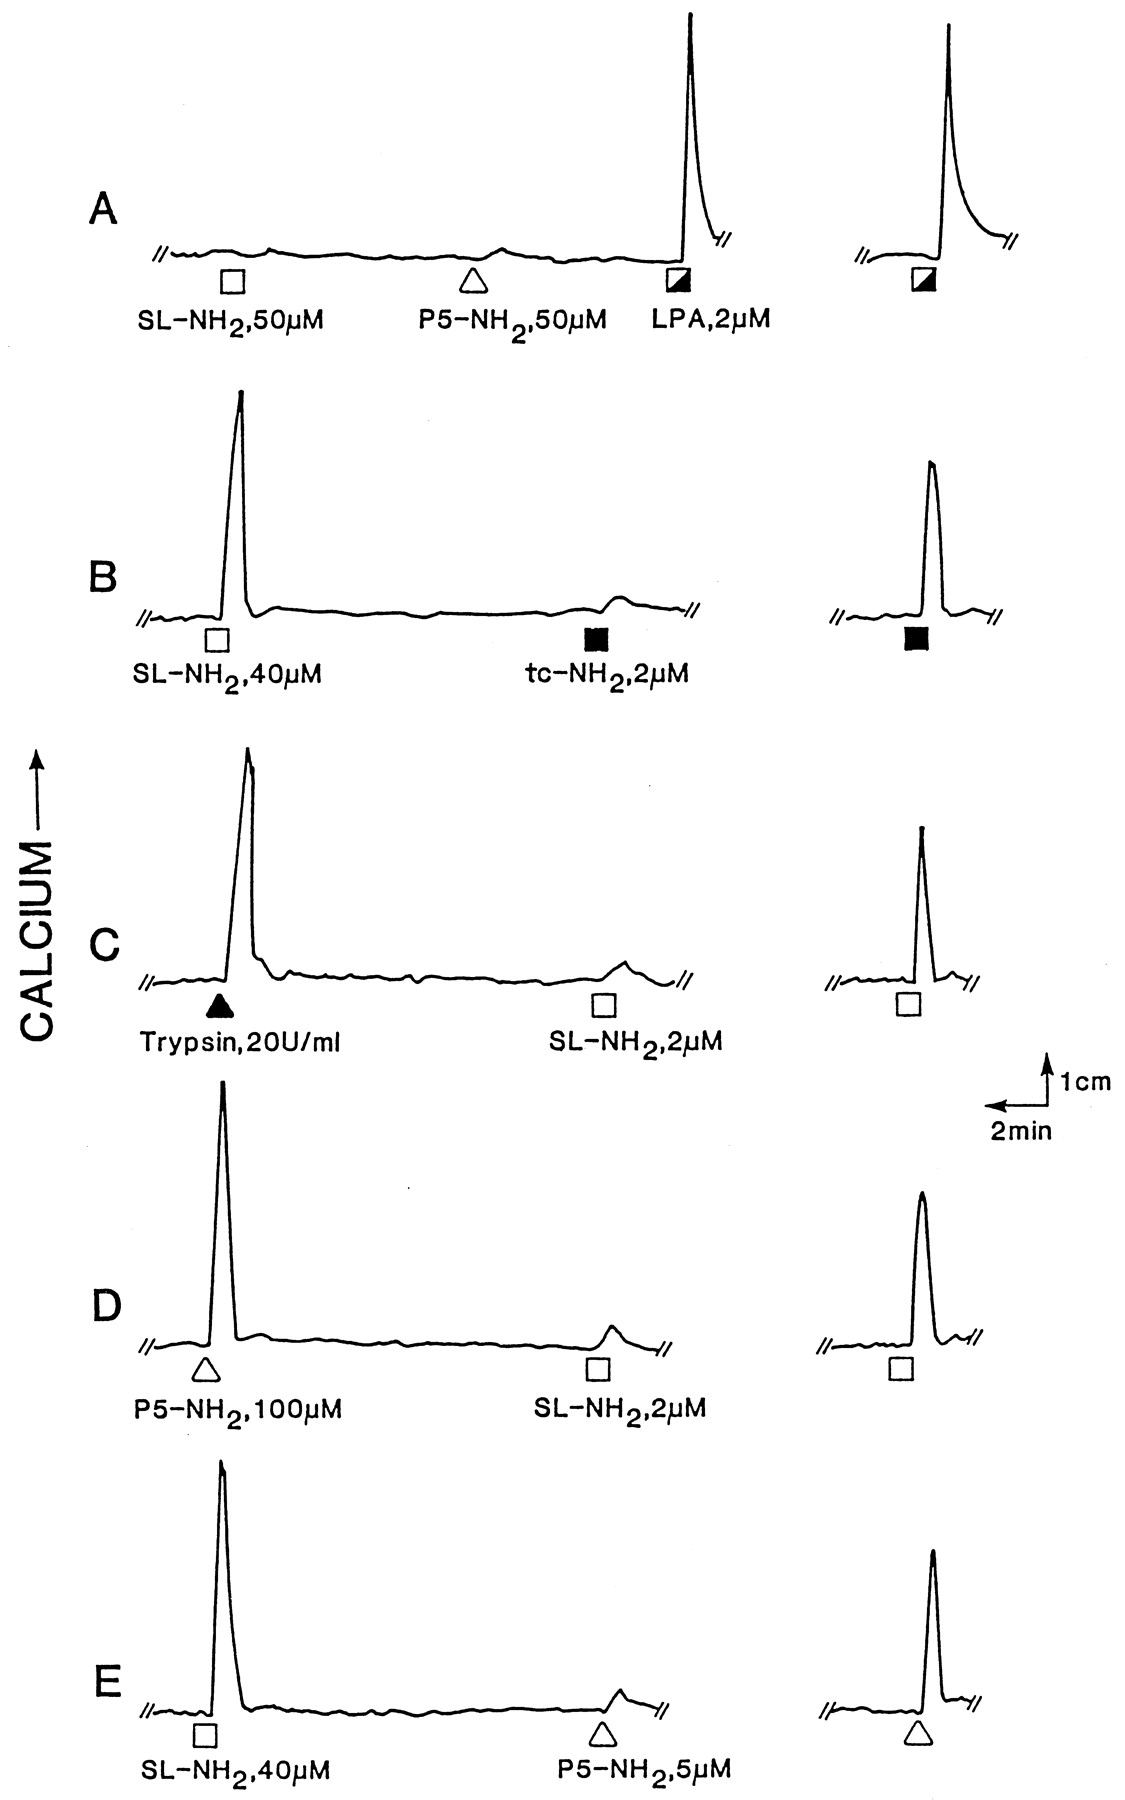
Calcium signaling in KNRK-rPAR2 cells: activation/desensitization by PAR1- and PAR2-targeted agonists. Fluo-3-loaded nontransfected (A) or PAR2-transfected cells (B–E) were monitored for fluorescence, and cells were evaluated by the sequential agonist exposure paradigm outlined in Materials and Methods, with the following agonists: SL-NH2 (■), P5-NH2 (▵), LPA (┌), tc-NH2 (▪), and trypsin (▴). The fluorescence response of the agonist added second in the sequential exposure protocol (left tracings), was compared with the response to cells that had not been previously exposed to the first agonist (right tracings). A, nontransfected cells do not respond to either SL-NH2 or P5-NH2 and remain fully responsive to LPA. B, exposure to SL-NH2 desensitizes the response to tc-NH2. C, trypsin exposure desensitizes the cells to SL-NH2. D, the PAR1-AP P5-NH2 desensitizes the cells to SL-NH2. E, SL-NH2 desensitizes the cells to P5-NH2. The tracings are illustrative of four or more independently conducted experiments with two or more separately grown crops of KNRK-rPAR2 cells.
Peptides and Other Reagents.
All peptides were synthesized by solid-phase methods at the Peptide Synthesis Facility, University of Calgary, Faculty of Medicine (Calgary, Alberta, Canada; director, Dr. Denis McMaster) or were provided through the courtesy of Dr. L. Leblond, via the Peptide Synthesis Facility at BioChem Therapeutic (Laval, Quebec, Canada). The composition and purity of all peptides were confirmed by HPLC analysis, mass spectral analysis, and quantitative amino acid analysis. Stock solutions, prepared in 25 mM HEPES buffer, pH 7.4, were standardized by quantitative amino acid analysis to verify peptide concentration and purity. Porcine trypsin (14,900 U/mg, catalog no. T7418) was obtained from Sigma. A maximum specific activity of 20,000 U/mg was used to calculate the approximate molar concentration of trypsin in the incubation medium.
Preparation of [3H]tc-NH2 for Ligand-Binding Studies.
The parent tc-LIGRLO-NH2 PAR2-AP was radiolabeled on the free amino group of ornithine by reaction with [3H]propionyl succinimide ester (75–110 Ci/mmol; Amersham Corp., Arlington Heights, IL), essentially according to the procedure described by Kummer et al. (1981) for the tritium labeling of antibodies to high specific activity. After [3H]propionation, the monosubstituted [3H]propionyl-tc-NH2(75–110 Ci/mmol) was separated from unreacted peptide by HPLC with a microbond pack C18 column (Waters, Mississauga, Ontario, Canada) using a linear gradient (over 34 min at 1 ml/min.) of acetonitrile (0–51%) in 0.1% trifluoroacetic acid (elution of [3H]propionyl peptide at about 30 min; unsubstituted peptide at 26 min). The peak of [3H]propionyl-tc-NH2 so isolated (about 2% of total peptide used in the propionation reaction) was quick-frozen in aliquots for subsequent use in the binding assay (below).
Ligand-Binding Assay.
Cells grown to the point of about 85% confluence were dissociated in EDTA-containing saline, harvested by low-speed centrifugation, and resuspended at a concentration of about 3.5 × 10⁶ cells/ml in Earle’s balanced buffer, pH 7.5, supplemented with 25 mM HEPES and 0.1% (w/v) BSA. Routinely, cell aliquots (0.2 ml final volume) were incubated in triplicate at 4°C for 1 h along with approximately 106 cpm [3H]propionyl-tc-NH2(approximately 3.5 nM) in either the absence or presence of increasing concentrations of unlabeled competing peptide. At 1 h, the cell suspension was layered in a microfuge tube (total volume, 0.4 ml) onto 0.1 ml of a mixture of dinonyl/dibutyl phthalate, 0.4:0.6 (v/v), and the cell-bound radioactivity was pelleted below the oil/water interface by centrifugation (20,000 rpm) for 5 min at room temperature (Beckman Spinco, Palo Alto, CA). The cell pellet was cut from the bottom of the tube and solubilized overnight using 5 ml of Eco-Lite scintillation fluid (ICN, Costa Mesa, CA), and bound radioactivity was measured by scintillation counting (efficiency, about 65%). The amount of “specific” binding (maximal competition for the receptor-binding sites by unlabeled ligand) was calculated by subtraction from the total amount of radioligand bound in the absence of competing ligand, the amount of radioactivity bound in the presence of an excess (100–200 μM) of unlabeled SL-NH2 or tc-NH2. Binding competition curves for unlabeled peptides were constructed by measuring the percentage of radioligand-binding competition (% max) caused by each peptide concentration, relative to the maximum binding competition caused by 100 to 200 μM concentration of either unlabeled SL-NH2 or tc-NH2. Values represent the mean ± S.E.M. for triplicate measurements done at each peptide concentration, using two or more separately grown crops of cells. The binding competition curves were also used to calculate apparent dissociation constants in keeping with the formula outlined byCheng and Prusoff (1973): Ki = IC50/[1 + (L*/KD*)], where L* andKD* represent the concentration of radiolabeled ligand (L* = 3.5 nM) and the apparent dissociation constant (KD* = 0.05 μM) for the radiolabeled binding probe, respectively. The conditions of the binding assay were such that this formula was applicable (Cuatrecasas and Hollenberg, 1976; Bennett, 1978). The binding-competition curve with unlabeled tc-NH2 was used to calculate the amount of bound (B) and free (F) ligand, assuming that the unlabeled and radiolabeled peptides bound to the receptor with comparable affinities. These data were plotted as a “direct” binding curve (bound versus free ligand) and were also replotted according to Scatchard (1949)(bound/free versus bound).
Results
PAR2 Expression in KNRK Cells.
Although PAR2 mRNA could be detected by RT-PCR in the nontransfected or mock-transfected KNRK cells, no immunoreactivity was detected, even in permeabilized nontransfected cells (Fig.1A, top), and neither PAR2-AP SL-NH2 (50 μM) nor trypsin (20 U/ml) caused a calcium signal in the nontransfected cells (Figs. 2A and 4; and data not shown). Similarly, nontransfected or mock-transfected cells failed to yield a calcium signal in response to either thrombin (10 U/ml) or the PAR1-AP P5-NH2 (50 μM; Fig. 2A, and data not shown). In contrast, such cells yielded a prominent calcium signal in response to lysophosphatidic acid (LPA; Fig. 2A). In comparison with the background or mock-transfected KNRK cells, the transfected KNRK-rPAR2 clone isolated by cell sorting exhibited a robust RT-PCR PAR2signal relative to the signal for actin (Fig. 1, bottom). The transfected KNRK-rPAR2 cells also exhibited a prominent fluorescence with the B5 antireceptor antibody (Fig. 1B, top). The fluorescence was abolished by preabsorbing the antibody with the receptor-derived peptide immunogen (Fig. 1C, top). Furthermore, the KNRK-rPAR2 cells yielded a prominent calcium signal when activated by either the selective PAR2-AP SLIGRL-NH2 (40 μM, Fig. 2B) or trypsin (20 U/ml, Fig. 2C). The magnitude of the Ca2+ signal resulting from PAR2 activation was equivalent to that caused by LPA (compare Fig. 2, A and B). Calibration of the immunofluorescence yield from the cell sorter, according to the Quick Cal program (Flow Cytometry Standards Corp.), provided an estimate of approximately 75,000 B5 antibody-binding sites/cell in the KNRK-rPAR2 cells.

Detection of PAR2 in KNRK cells by immunofluorescence (top) and RT-PCR (bottom). Top, either nontransfected (A) or PAR2-transfected (B and C) KNRK-rPAR2 cells were fixed and immunostained with B5 antibody as outlined in Materials and Methods either without (A and B) or with prior adsorption of the antiserum with immunizing peptide. C, scale represents 50 μm. Bottom, total RNA from either nontransfected (lanes 1 and 2) or PAR2-transfected (lanes 3 and 4) KNRK cells was reverse-transcribed and analyzed by PCR with the PAR2 and actin-targeted amplimers, as outlined inMaterials and Methods. The signal yielded for actin (lanes 1 and 3) can be compared with the signal for PAR2(lanes 2 and 4). The positions of the molecular size markers (BP, nucleotide base pairs) are shown on the left; the positions of the expected PCR products for actin (A) and PAR2 (P) are shown to the right of the separating gel.
Receptor Cross-Desensitization.
We used a receptor cross-desensitization protocol that we developed previously (Hollenberg et al., 1997; Kawabata et al., 1999) to evaluate the activation/desensitization of PAR2 by a variety of agonists. As shown in Fig. 2, pretreatment of the KNRK-rPAR2 cells with either trypsin (tracing C) or SFLLR-NH2 (tracing D) desensitized the cell response to the PAR2-AP SLIGRL-NH2. Furthermore, SLIGRL-NH2 desensitized the subsequent response to either tc-NH2 (Fig. 2B) or to SFLLR-NH2 (Fig. 2E). Thrombin (10 U/ml) failed to either cause a calcium signal in the KNRK-rPAR2cells or desensitize the cell response to SLIGRL-NH2 (not shown). In contrast, treatment of the KNRK-rPAR2 cells with any of the PAR-AP agonists failed to affect the subsequent response to LPA (not shown). The responsiveness of the cells to the PAR2-APs was not affected by the presence of proteinase inhibitors (e.g., 10 μM amastatin) in the calcium-signaling assay buffer (not shown). In summary, the data showed that the KNRK-rPAR2 cell receptor was activated/desensitized by both PAR1- and PAR2-APs, as well as trypsin (but not thrombin). Cell-derived proteinases did not appear to affect the peptide-mediated calcium-signaling assay.
Concentration-Effect Curves for Trypsin and PAR2-APs and PAR1-APs in Calcium-Signaling Assay.
Before assessing the activation of PAR2 by PAR1-APs, we used the calcium-signaling assay to evaluate the structure-activity profile for a number of PAR2-APs that we had studied previously in a rat aorta tissue bioassay. For comparison, the potency of trypsin was also measured. As shown in Fig. 3, the potency order was tc-LIGRLO-NH2 ≅ SLIGRL-NH2 > SLIGKV-NH2 > SLIGR-NH2; LSIGRL-NH2 and LRGILS-NH2 (not shown) were inactive. The relative potencies of the PAR2-APs in the calcium-signaling assay are summarized in Table1.

Calcium signaling in KNRK-rPAR2 cells by PAR2-APs and trypsin: concentration-effect curves. The calcium signal, relative to that caused by A23187 (% A23187), was monitored at 530 nm (E530) for increasing concentrations of the indicated PAR2-APs and for trypsin. Each data point represents the average fluorescence response (±S.E.M., bars) for three or more replicate cell samples derived from two or more independently grown crops of KNRK-rPAR2 cells. S.E. bars smaller than the symbols are not shown.
Relative potencies of PAR-APs in the calcium signaling and binding competition assays
In keeping with the ability of the PAR1-AP SFLLR-NH2 to activate/desensitize PAR2 (Fig. 2D), all other PAR1-APs tested were able to activate PAR2 with different potencies, as shown in Fig.4. All of the PAR1-APs were less potent than the PAR2-AP SL-NH2. The potency order for the PAR1-APs, as shown in Fig. 4 and summarized in Table 1, was SFLLR-NH2 > SFLLRNP-NH2 > SFLLRNP > SFLLR > TFLLR-NH2. Neither the Xenopus-derived PAR1-AP TFRIFD-NH2 nor the partial reverse sequence PAR1-AP FSLLR-NH2 was active in the KNRK-rPAR2 cells (Fig. 4). As mentioned above, neither SFLLR-NH2 nor SLIGRL-NH2 at concentrations that maximally activated the KNRK-PAR2 cells (100 μM) yielded an appreciable calcium signal in nontransfected KNRK cells (symbols denoted by asterisks in Fig. 4). On average, the signal yielded by 100 μM SLIGRL-NH2 in nontransfected cells was about 3.5% of the fluorescence caused by the ionophore in the same cell; 100 μM SFLLR-NH2 failed to yield a detectable fluorescence in nontransfected KNRK cells.

Calcium signaling in KNRK-rPAR2 cells by PAR1-APs: concentration-effect curves. The calcium signal, relative to that caused by A23187 (% A23187), was monitored at 530 nm (E530) for increasing concentrations of the indicated PAR1-APs. The response to the PAR2-AP SLIGRL-NH2 (■) was also monitored. Symbols with an asterisk represent the responses of untransfected KNRK cells to SLIGRL-NH2 and SFLLR-NH2, respectively. Values represent the average fluorescence responses (±S.E.M., bars) for three or more replicate cell samples derived from two or more independently grown crops of cells. S.E. bars smaller than the symbols are not shown.
Ligand-Binding Assay.
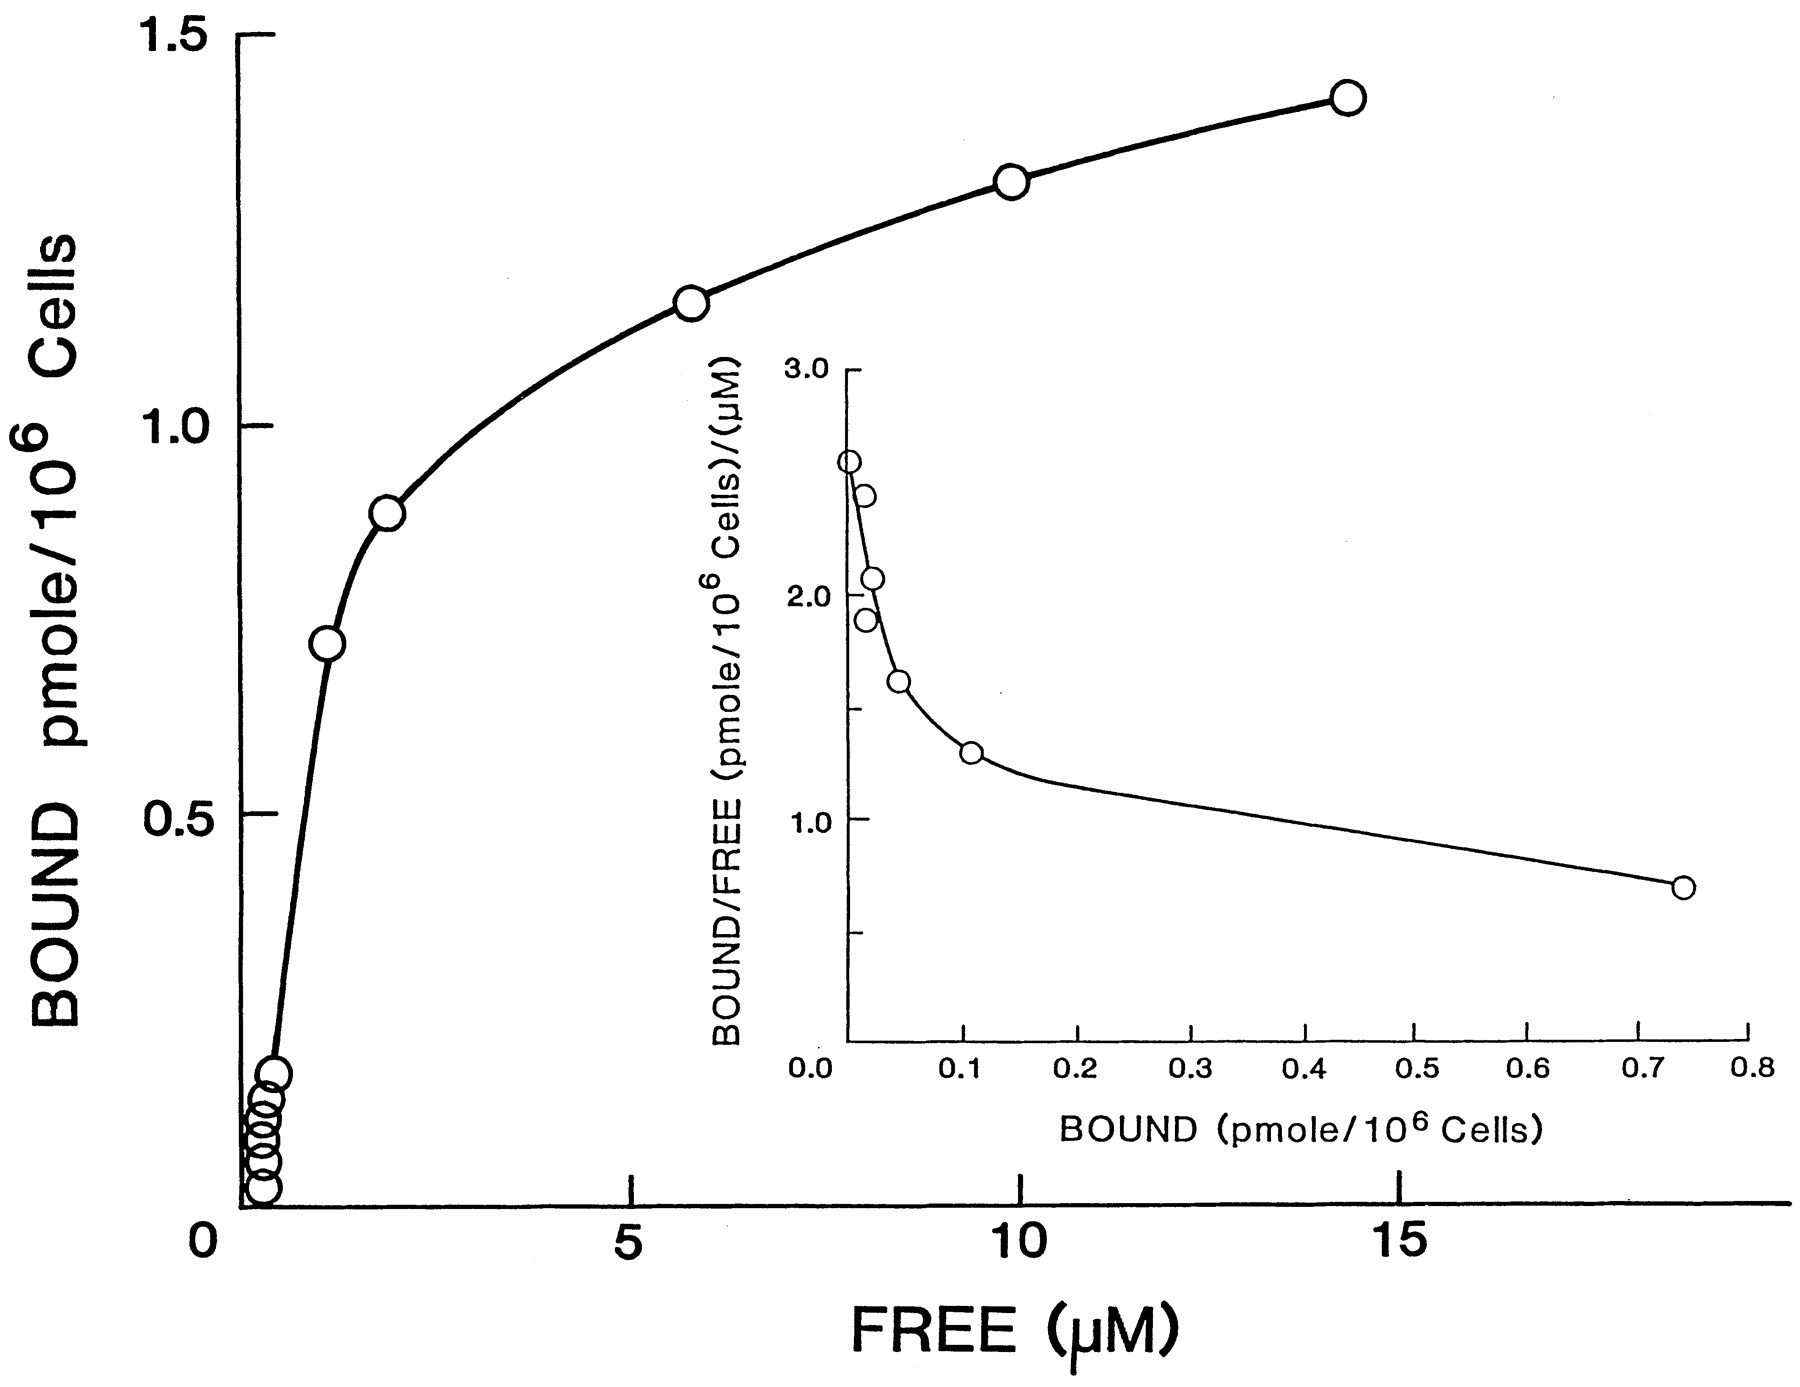
Having established the SARs for a number of PAR2-APs and PAR1-APs in the KNRK-rPAR2 cells, we turned to the development of a ligand-binding assay in which the relative binding affinities of selected PAR-APs could be compared directly with their EC50 values. As indicated in Fig.5, [3H]propionyl-tc-NH2 was able to bind to KNRK-rPAR2 cells in a manner that was competed for by the parent compound (tc-NH2) as well as the PAR2-AP SLIGRL-NH2. Only a low degree of “specific” binding was observed in nontransfected cells (Fig. 5, open square with asterisk), and there was minimal binding competition by the inactive, partial-reverse sequence PAR1-AP FSLLR-NH2 (Fig. 5, diamonds) or the reverse PAR2-AP LRGILS-NH2 (not shown) compared with the active PAR1-AP SFLLR-NH2 (Fig. 5, open triangles). Representative binding data, illustrating the amount of total bound radioactivity typically measured, along with the amount of radioactivity bound in the presence of 100 μM concentration of the competing peptide [either the active peptide, SL-NH2, or the inactive peptide, FSLLR-NH2 (FS-NH2)], are shown in Table 2. In the table, the amount of radioactivity bound in the presence of 100 μM SL-NH2 was considered “nonspecific” binding; little radioactivity was displaced from the cells in the presence of 100 μM of the biologically inactive peptide, FS-NH2, which failed to cause a calcium signal in the KNRK-rPAR2 cells (Table 1 and Fig. 5). At 4°C, binding equilibrium was attained at 1 h, with aT1/2 of about 10 min (not shown). Binding was linear with cell number between 1.5 and 4 × 10⁶ cells/ml. No peptide degradation (HPLC analysis) was observed under these conditions even in the absence of albumin (data not shown). Thus, for the binding competition curves (Fig. 5), samples (0.2 ml) at a cell concentration of 3.5 × 10⁶/ml were equilibrated for 1 h at 4°C before the separation of bound from free radioligand by the microfuge technique. To assess the ligand specificity of the binding assay, we selected for testing two PAR1-APs (SFLLR-NH2 and SFLLR) and two PAR2-APs (SLIGRL-NH2 and SLIGR-NH2), as well as the parent compound (tc-NH2) used to synthesize the radiolabeled ligand probe. The reverse-sequence biologically inactive peptides (FS-NH2 and LR-NH2) were used as “negative” controls. This spectrum of PAR-APs covered a wide range of potencies, as assessed by the calcium-signaling bioassay. As shown in Fig. 5 and summarized in Table 1, the relative ability for the unlabeled compounds to compete for the binding of [3H]propionyl-tc-NH2(tc-NH2 ≅ SLIGRL-NH2 > SLIGR-NH2 ≅ SFLLR-NH2 > SFLLR) reflected their relative potencies in the calcium-signaling assay. The precision of the binding assay proved to be less robust than that of the calcium-signaling assay (e.g., see error bars in Fig. 5compared with Figs. 3 and 4 and values in Table 2). A direct binding curve and an analysis of the binding data according to Scatchard (1949)(Fig. 6) were calculated from the binding competition curve obtained using unlabeled tc-NH2, with the assumption that [3H]propionyl-tc-NH2 was interchangeable with the unlabeled compound at the receptor binding site. The plot of bound/free versus bound ligand was curvilinear (Fig.6, inset), suggesting either negative cooperativity or a heterogeneity of binding sites. Assuming a two-site model of binding, it was possible to discern a high-affinity site with aKD value of about 50 nM, with a maximum of approximately 78,000 sites/cell as well as a low-affinity component (KD ≅ 1 μM), of approximately 840,000 binding sites/cell in the KNRK-rPAR2 cells.

Binding competition: concentration-effect curves for PAR1- and PAR2-APs. The ability of increasing concentrations of the indicated PAR1- and PAR2-APs to compete for the binding of [3H]tc-NH2 to KNRK-rPAR2 cells is shown as a percentage of the maximum binding competition caused by 200 μM concentration of either SLIGRL-NH2 or tc-LIGRLO-NH2. Values represent the average values (±S.E.M., bars) of three or more replicate cell samples derived from two or more separately grown crops of cells. The symbol with the asterisk shows the specific binding competition of SLIGRL-NH2 in nontransfected cells; the binding competition in PAR2-transfected cells of the inactive partial-reverse-sequence PAR1-AP FSLLR-NH2(⋄) is also shown. S.E. bars smaller than the symbols are not shown.
Competition for binding of 3H-labeled tc-NH2 in untransfected and KNRK-rPAR2 cells

Plot of the binding of [3H]tc-NH2 to KNRK-rPAR2 cells both as a binding curve and according to Scatchard (1949). With the assumption that unlabeled tc-NH2 binds to the receptor with the same affinity as 3H-labeled tc-NH2, the binding-competition data for unlabeled tc-NH2 (Fig. 5) were plotted both as a direct binding curve (bound versus free ligand) and as a plot according to Scatchard (1949): bound/free versus bound (inset).
Discussion
The main outcomes of our study were that we were able to validate in the KNRK-rPAR2 cells a radioligand-binding assay for PAR2 that reflected the biological potencies (calcium-signaling assay) of PAR1- and PAR2-APs, and that we were able to clearly establish the relative potencies of a series of PAR1-APs for activating PAR2. The data obtained with the KNRK-rPAR2 calcium-signaling assay considerably extend our previous studies (Hollenberg et al., 1997), wherein the activation/desensitization of PAR2 was evaluated in a cell system (HEK 293 cells) that possesses both PAR1 and PAR2. Furthermore, the data obtained with the KNRK-rPAR2 cell system enabled us to examine more closely and with a much higher degree of precision than in an oocyte expression system (Blackhart et al., 1996) the SARs for a series of PAR1-APs and PAR2-APs, in terms of their interaction with PAR2 in isolation. In the KNRK expression system, as opposed to the Xenopus oocyte expression system, there was no possibility that an interaction of the receptor with a nonmammalian G protein might alter the observed peptide SARs. There was an exact concordance between the relative potencies of the PAR2-APs in the KNRK-rPAR2calcium-signaling assay (Table 1) and their relative potencies measured previously in vivo using an endothelium-intact rat aorta preparation (Saifeddine et al., 1996; Hollenberg et al., 1997; Vergnolle et al., 1998). It was of particular interest to us that the relative potencies of the PAR1-APs, (SFLLR-NH2> SFLLRNP-NH2 > SFLLRNP > SFLLR) were comparable to the relative potencies of the same PAR1-APs for activating PAR1 in human platelets (SFLLR-NH2 ≫ SFLLRNP-NH2> SFLLRNP > SFLLR; Tay Uyboco et al., 1995). Unfortunately, it was not possible to compare our relative potency data directly with the observation of others, either because of the lack of precision of the assay in other work (e.g., in Xenopus oocytes; Blackhart et al., 1996) or because a different series of peptide agonists were evaluated in platelet assays done in the absence of the aminopeptidase inhibitor amastatin (Coller et al., 1992; Scarborough et al., 1992;Vassallo et al., 1992). Taken together, our data suggest that the structural requirements for the interaction of the PAR1-APs with PAR2 may be very similar to their requirements for their interaction with PAR1. If so, our data imply that the PAR1-APs may dock with homologous receptor domains (e.g., extracellular loop 2; Lerner et al., 1996) to be found in both PAR1 and PAR2. Further work with the use of receptor cross-linking probes based on the PAR1-AP motif should be able to evaluate this possibility.
The ligand-binding assay that we developed using the radiolabeled tc-NH2 PAR2-AP probe is comparable to the binding assay developed previously to evaluate the interaction of PAR1-APs with platelet membranes (Ahn et al., 1997). Unfortunately, the radioligand probe used for that study was not entirely specific for PAR1(Kawabata et al., 1999). That the binding data we have obtained with the PAR2-specific [3H]tc-NH2 ligand represents a specific receptor interaction, rather than a nonreceptor interaction, is strongly supported by two principal results: 1) appreciable peptide-specific binding was observed in PAR2-transfected cells, compared with little or no specific binding in the mock-transfected or nontransfected cells (Fig. 5 and Table 2), and 2) in general, the rank order for the binding competition of a series of peptides reflected their relative biological potencies in the cell-based calcium-signaling assay, whereas the reverse-sequence peptides failed to compete for binding (e.g., compare data in Fig. 5 with the bioassay data in Figs. 3 and 4; summarized in Table 1). That said, the PAR2-derived peptide GR-NH2 appeared to be about equipotent with P5-NH2 in the binding competition assay whereas it was slightly less potent than P5-NH2 in the calcium-signaling assay. Such differences may be due to differing intrinsic efficacies (Ariens, 1954; Stephenson and Barlow, 1970) with which the two peptides activate PAR2. Regrettably, the precision of the binding assay did not appear to be sufficient to evaluate that possibility in any depth.
It is of interest that the plot of the binding data for [3H]tc-NH2, according toScatchard (1949; bound/free versus bound), was curvilinear, so as to suggest either negative cooperativity of binding or multiple binding sites (Fig. 6). Assuming a two-site model, it was possible to estimate an abundance of about 78,000 “high-affinity” binding sites/cell, with an affinity constant of approximately 50 nM and about 840,000 “low-affinity” sites/cell, with an affinity constant of about 1 μM. The calculated number of high-affinity binding sites was in remarkably good agreement with the number of receptor sites estimated by the fluorescence cell sorting measurement (about 75,000 sites/cell). It is difficult to interpret the potential function of the low-affinity sites, which appear to be ligand-specific and which clearly contribute to the overall binding of the radioligand. Notwithstanding, because PAR2 is a G protein-coupled receptor, for which ligand affinity can be modulated by the GTP state of the G protein, the estimates of ligand affinity and abundance must be interpreted with considerable caution. Furthermore, the estimates of ligand affinity using the equation of Cheng and Prusoff (1973; these values would reflect only the “average” ligand affinity) must also be interpreted with the knowledge that this approach does not fully take into consideration either the presence of multiple binding sites or the possibility of negative cooperativity of binding. That said, the relative ligand affinities yielded by the relative IC50 values, as reflected by the REC values in Table 1, can be taken to accurately reflect the relative affinities of the PAR-APs for the receptor site that interacts with [3H]tc-NH2.
Even given the 50 nM dissociation constant we can estimate for the high-affinity binding site, an important question to ask is whether the affinity is sufficient (and, therefore, the off rate is slow enough) to use the 3H-ligand probe in a conventional binding assay for a high-throughput drug screening procedure. Our preliminary answer to the question was a qualified “no” (e.g., see Cuatrecasas and Hollenberg, 1976) because the off rate might be too rapid to permit the usual membrane or cell monolayer washing procedures used for such assays. For that reason, we chose to use the oil-separation/microfuge method for our work. As has been pointed out previously (Cuatrecasas and Hollenberg, 1976), the microfuge method permits equilibration of the ligand with the receptor up to the instant that the complex is pelleted below the oil/water interface, allowing for the measurement of lower-affinity interactions. Such a procedure might not prove optimal for a high-throughput screening paradigm but will be useful, nevertheless, for further studies of the interactions of selected PAR-APs with PAR2, for comparison with their biological activities either in vivo or in cultured cells. Notwithstanding, it will be necessary to design higher-affinity radioligand probes for PAR2 to screen very large numbers of compounds.
Acknowledgments
We thank Dr. Keith Sharkey and Winnie Ho for assistance with the immunohistochemical studies, and W. Heidorn of Hellma (Canada) Ltd., who helped with the repair of components for the measurement of cell fluorescence.
Footnotes
-
Send reprint requests to: Dr. M. D. Hollenberg, Department of Pharmacology and Therapeutics, Faculty of Medicine, University of Calgary, 3330 Hospital Dr. N.W., Calgary, Alberta, Canada T2N 1N4. E-mail: mhollenb{at}ucalgary.ca
-
↵1 This work was supported primarily by an NSERC/NRC partnership grant in conjunction with BioChem Therapeutic, Laval, Quebec, Canada, with ancillary support from a Medical Research Council of Canada operating grant.
-
↵2 Present address: Department of Pathophysiology and Therapeutics, Faculty of Pharmaceutical Sciences, Kinki University, 3-4-1 Kowakae, Kigashi-Osaka 577, Japan.
- Abbreviations:
- PAR2
- proteinase-activated receptor 2 (trypsin/tryptase activated)
- FS-NH2
- FSLLR-NH2
- [3H]tc-NH2
- [3H]propionyl-tc-LIGRLO-NH2
- GR-NH2
- SLIGR-NH2
- KV-NH2
- SLIGKV-NH2
- LPA
- lysophosphatidic acid
- LR-NH2
- LRGILS-NH2
- P5
- SFLLR
- P5-NH2
- SFLLR-NH2
- P7
- SFLLRNP
- P7-NH2
- SFLLRNP-NH2
- PAR
- proteinase-activated receptor
- PAR1
- proteinase-activated receptor 1 (for thrombin)
- PAR-AP
- proteinase-activated receptor-activating peptide
- SAR
- structure-activity relationship
- SL-NH2
- SLIGRL-NH2
- tc-NH2
- trans-cinnamoyl-LIGRLO-NH2
- TF-NH2
- TFLLR-NH2
- TL
- tethered ligand
- PCR
- polymerase chain reaction
- RT
- reverse transcription
- HEK
- human embryonic kidney
- Received February 17, 1999.
- Accepted April 2, 1999.
- The American Society for Pharmacology and Experimental Therapeutics


