Article Text

Abstract
Background: Numerous studies have shown a strong association between daily mortality and small particulate with a diameter of <10 µm (PM10) air pollution, but the effects of season have not always been well characterised.
Aim: To study the shape of the association between short-term mortality and PM10 across seasons and quintiles of outdoor temperature.
Design, setting and participants: Daily data on mortality (n = 354 357), outdoor temperature and PM10 in Flanders, Belgium, from January 1997 to December 2003, were analysed across warm versus cold periods of the year (April–September v October–March), with seasons and quintiles of outdoor temperature as possible effect modifiers.
Results: There was a significant (p<0.001) interaction between PM10 and period of the year in relation to mortality. To allow for non-linearity, daily mean PM10 concentrations were categorised into quartiles. Season-specific PM10 quartiles showed a strong and steep linear association between mortality and PM10 in summer and a less linear association in spring and autumn, whereas in winter the association was less strong and mortality was only increased in the highest PM10 quartile. The effect sizes expressed as the percentage increase in mortality on days in the highest season-specific PM10 quartile versus the lowest season-specific PM10 quartile were 7.8% (95% CI 6.1 to 9.6) in summer, 6.3% (4.7 to 7.8) in spring, 2.2% (0.58 to 3.8) in autumn and 1.4% (0.06 to 2.9) in winter. An analysis by quintiles of temperature confirmed these effect sizes.
Conclusion: The short-term effect of particulate air pollution on mortality strongly depends on outdoor temperature, even in a temperate climate.
- ICD, International Classification of Diseases
Statistics from Altmetric.com
Numerous time series studies have indicated a positive association between short-term variations in outdoor levels of particulate matter with a diameter of <10 µm (PM10) and daily mortality.1–5 However, weather-related differences over the seasons may modify the association between air pollution and mortality. Indeed, both high and low temperatures increase mortality6–9 and air pollution is associated with temperature.2 Because of these complex relationships, simple statistical adjustments may be inadequate and some effects of pollutants may be associated with outdoor temperature, or outdoor temperature might behave as an effect modifier in the association between mortality and PM10. We studied in a relatively highly polluted region of Europe (fig 1) the short-term association between mortality and PM10 over a recent 7-year period (1997–2003) by season and by quintiles of temperature, and noted that the shape of the dose–response relationship curve between air pollution and mortality strongly depends on outdoor temperature.
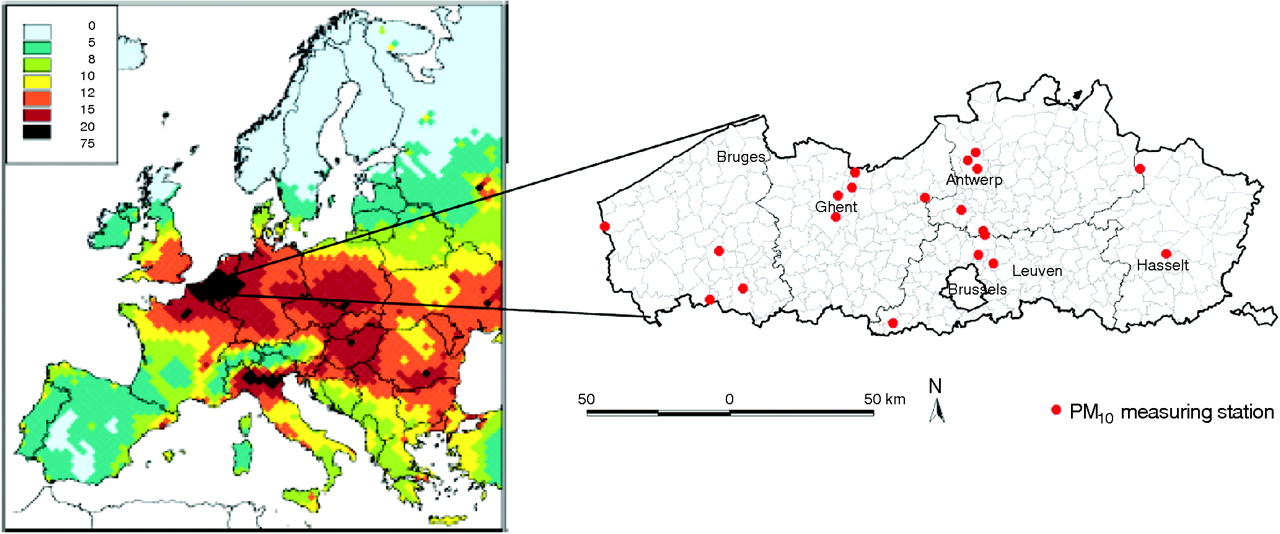
Grid-averaged PM2.5 (annual mean, µg/m3), for the emissions of the year 2002 in Europe. With permission from the International Institute for Applied Systems Analysis (http://www.iiasa.ac.at/rains/CAFE_files/CAFE-MFR3.pdf). The map of the study area (Flanders) is shown on the right side; particulate matter concentrations were measured at 19 fixed monitoring sites representing background levels (red dots).
METHODS
We used the daily time series data on mortality, temperature and air pollution for the period 1997–2003 in Flanders, Belgium (∼6 million inhabitants). Daily mortality counts were obtained from the National Institute for Statistics (Brussels, Belgium); we considered deaths from all causes other than accidents or violence (ninth revision of the International Classification of Diseases (ICD-9, <800)), and also considered separately all respiratory diseases (ICD-9, 460–519) and all cardiovascular diseases (ICD-9, 390–459). Mean outdoor temperature and the air pollution data were obtained from the Flemish Environment Agency (fig 1); the mean of 19 stations was used in the analysis. Winter, spring, summer and autumn are defined as beginning on 21 December, 21 March, 21 June and 21 September, respectively. Additionally, we conducted analysis categorising the three hottest months (June, July and August), the three coldest months (December, January and February) and the intermediate months (March, April, May, September, October and November).
Database management and statistical analyses were done with SAS software (V.8.1). First, we tested for an interaction between PM10 and period of the year (warm and cold periods defined as April–September and October–March, respectively). Because of a significant interaction, we studied the shape of the dose–response relationship curve between air pollution and mortality stratified by season or strata of temperature by plotting the daily mortality for quartiles of PM10 in each season, or for each quintile of outdoor temperature. We plotted additionally the mortality pattern for each quartile of PM10 across the temperature strata, with adjustment for outdoor temperature within each stratum. Finally, we calculated dose–response relationships using a continuous analysis with adjustments made for the day of the week, for outdoor temperature of the same day (linear and squared term) and for the difference in outdoor temperature between the day of the event and the previous day; the dose–response relationships between mortality and PM10 in strata with linear associations were analysed by a regression model to calculate the effect sizes, with 95% confidence intervals (CI), for a 10-µg/m3 increase in PM10. Non-linear associations were analysed by segmented regression models, where it is assumed that the exposure has no influence on the response up to an estimated threshold.10 In sensitivity analyses, we tested previous PM10 exposure and ozone as additional explanatory variables and conducted additional analyses excluding those who died before the ages of 20 and 40 years, separately. Furthermore, the association with air pollutants was estimated examining the delayed relationship up to 5 days (lag 5) previously. Additionally, a smooth loess function as implemented in the SAS statistical package was used to regress total mortality against fine particulate air pollution stratified according to season.
RESULTS
The total number of non-traumatic deaths during the 7-year period was 354 357. Daily mean outdoor temperature and PM10 concentrations averaged 11.7°C (standard deviation (SD) 6.1) and 39.5 µg/m3 (21.9), respectively. Mortality was highest in winter, intermediate in spring and autumn, and lowest in the summer (table 1, fig 2).
Daily mortality, outdoor temperature and PM10 concentration according to season
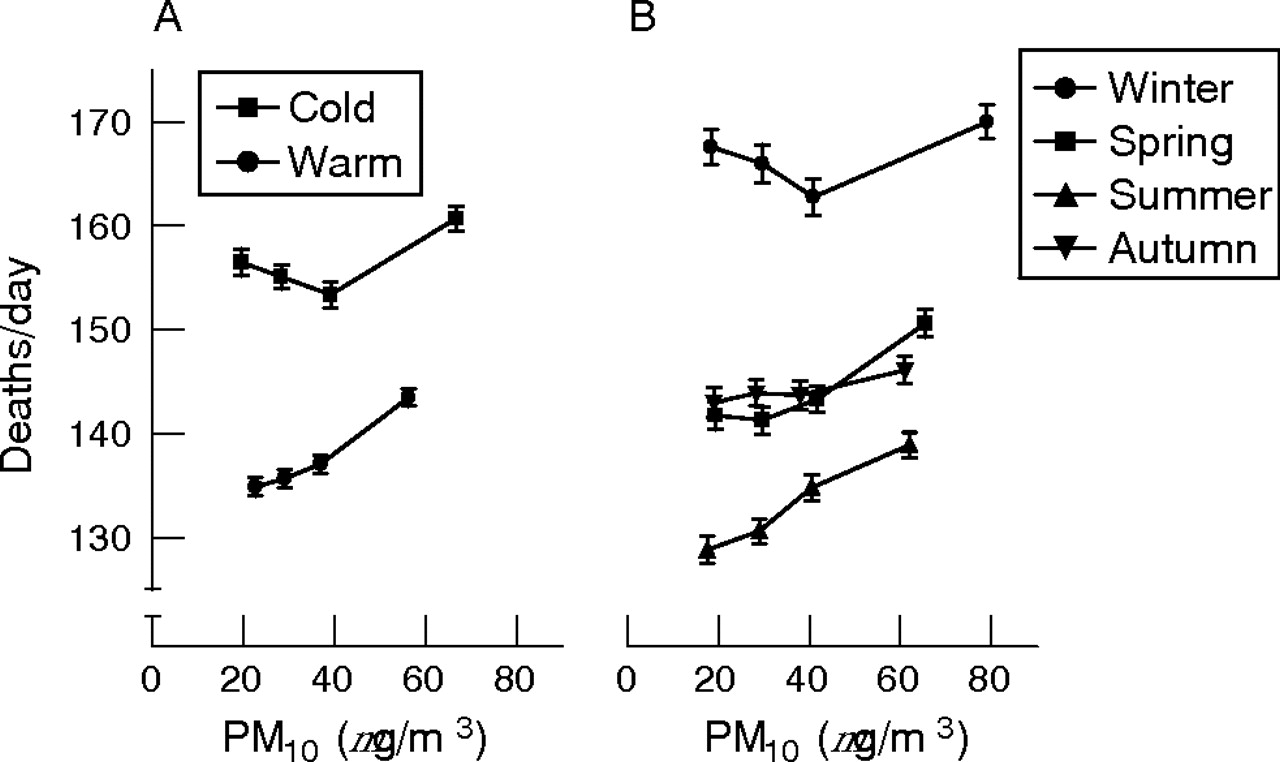
Total daily non-traumatic mortality (means (standard error)) in Flanders (1997–2003) plotted against quartiles of small particulate air pollution (PM10), stratified according to (A) warm (April–September) and cold (October–March) periods and (B) seasons (n = 354 357).
Firstly, we categorised the periods of the year into cold and warm (April–September and October–March, respectively). During the cold period, 86% of the days had temperatures below the median (11.5°C), whereas during the warm period, 86% of the days had temperatures above the median. There was an interaction between PM10 and cold/warm period of the year in relation to total mortality (p<0.001; fig 2A), cardiovascular mortality (p<0.001) and respiratory mortality (p = 0.09). To allow for non-linearity, daily mean PM10 concentrations were categorised into quartiles. Season-specific PM10 quartiles showed a strong and steep linear association between mortality and PM10 in summer and a less linear association in spring and autumn, whereas in winter the association was less strong and mortality was only increased in the highest PM10 quartile (fig 2B). The corresponding effect sizes expressed as the percentage increase in mortality on days in the highest season-specific PM10 quartile versus the lowest season-specific PM10 quartile were 7.8% (95% CI 6.1 to 9.6) in summer, 6.3% (95% CI 4.7 to 7.8) in spring, 2.2% (95% CI 0.58 to 3.8) in autumn and 1.4% (95% CI 0.06 to 2.9) in winter (fig 2B). These estimates may depend on the specification of the season boundaries, which are artificial in winter, spring, summer and autumn, being defined as beginning on 21 December, 21 March, 21 June and 21 September, respectively. Hence, we further compared the effects of particulate matter levels during the three hottest months (June, July and August), the three coldest months (December, January and February) and the intermediate months (March, April, May, September, October and November). Using this alternative stratification for seasonality, the estimated relative rates of death from all causes with an increase from the lowest to the highest season-specific particulate matter quartiles could be confirmed as 7.9% (95% CI 6.2 to 9.6%) during the warm months, 1.5% (95% CI 0.22 to 3.3%) during the cold months and 4.2% (95% CI 2.9 to 5.6%) during the intermediate months. The seasonal pattern using quartiles of PM10 was also confirmed by applying a smoothing model (data not shown). We also plotted the association between mortality and PM10 by quintiles of outdoor temperature. Mortality was highest in the first quintile (<7°C) and lowest in the fourth quintile (14–17°C). Both before (fig 3A) and after additionally controlling for outdoor temperature as a continuous variable (fig 3B), the temperature-specific quartiles of PM10 showed a steep linear increase in mortality at the higher temperature quintiles, but a non-linear association is apparent at the lower temperature quintiles.

Total daily non-traumatic mortality (mean (standard error)) in Flanders (1997–2003) plotted against quartiles of small particulate air pollution (PM10), stratified according to quintiles of mean daily outdoor temperature. (A) Crude data; and (B) data adjusted for outdoor temperature within each temperature-specific stratum (n = 354 357).
A continuous segmented regression model10 showed that the risk of death was independent of the PM10 air concentration up to 29.9 µg/m3 (95% CI 26.2 to 34.3; p<0.035) during the colder periods (October–March), whereas no threshold was detected during the warmer periods (April–September). Excluding subjects who died from pneumonia or influenza did not change the observed pattern. In all further continuous analyses, we consistently adjusted for the day of the week, for outdoor temperature of the same day (linear and squared term) and for the difference in outdoor temperature between the day of the event and the previous day. A 10-µg/m3 increase in PM10 on the same day was associated, during the warmer periods (April– September), with a 1.5% (95% CI 1.1 to 2.0; p<0.001) increase in total mortality, a 2.0% (95% CI 0.6 to 3.7; p = 0.008) increase in respiratory deaths and a 1.8% (95% CI 1.1 to 2.4; p<0.001) increase in cardiovascular deaths. Further analysis in which PM10 exposure of the previous days was used as an explanatory variable showed significant associations up to lag 2 for total mortality, up to lag 3 for respiratory mortality and up to lag 5 for cardiovascular disease. Additional adjustments for ozone (8-h maximum) did not alter these associations. In view of the non-linear pattern of the PM10–mortality relationship observed in winter, the continuous calculation was not made for the colder period of the year. Exclusion of persons in the analysis who died at <20 years of age (n = 3108; 0.8%) or at <40 years of age (n = 6524, 1.8%) of age did not modify our findings.
DISCUSSION
Our results show that a quantitatively similar increase in PM10 is not equally harmful under different weather conditions, even after adjustment for outdoor temperature during the preceding days. We can only speculate about the mechanisms underlying the much stronger association between mortality and PM10 during warmer periods, even though the PM10 levels reach higher values in winter (fig 2). The component-specific toxicity of PM10 may differ across the temperature range. A recent study11 that exposed isolated macrophages of rats to ambient particulate matter collected during winter, spring and summer (in Amsterdam, Lodz, Oslo and Rome) shows that PM10 samples collected in summer were more potent at inducing inflammatory cytokines (interleukin 6 and tumour necrosis factor α). Studies have reported correlations between indoor and outdoor PM10 ranging from 0.40 to 0.79, in general with lower correlations in the colder periods of the year.12–14 Nevertheless, a study carried out in the colder periods of the year found high correlations between indoor and outdoor PM10 (r = 0.79).14 Overall, the higher relative effects during the summer might be also a consequence of more time spent outdoors or because of a closer similarity between indoor and outdoor PM10. The higher relative effects observed in summer might also be due to lower background mortality in summer, thus resulting in a larger pool of susceptible people in summer.7
It is known that outdoor temperature is an effect modifier of the relationship between air pollution and mortality. This has been shown mainly at a geographical level by comparing the effect sizes of mortality and black smoke for European cities with different mean winter temperatures.15,16 However, only a few studies have investigated this for a single region, as we did here.17,18 However, in these studies,17,18 information on the shape of the association was not provided. Recent evidence from the US shows a strong seasonal pattern in the northeast and little seasonal variation in the southern regions of the country.15 In the northeast regions of the US, the extremes of temperature are much more pronounced, with a much higher prevalence and use of air conditioning than in western Europe.19
The shape of the association found between mortality and air pollution shows that reduction in the daily mean value of PM10 to <20 µg/m3 (proposed 2010 European limit for PM10),3 which corresponds with our first quartile, would be associated with reductions in acute mortality of 18 deaths in winter, 26 in spring, 51 in summer and 14 in autumn per 1 000 000 people/year. Time series studies such as ours must be interpreted with their limitations, including exposure misclassification and response misclassification. A limitation of our study is that we used ambient air pollution as a surrogate for personal exposure, which might have resulted in a measurement error. Inaccuracies in exposure measurements increase random errors and normally reduce the statistical significance of the mortality–air pollution association, but they should not introduce bias unless these inaccuracies covary with pollution. Risk factors such as cigarette smoking or socioeconomic variables may contribute to the baseline or underlying cardiopulmonary disease rates in the population, but because they do not change from day to day in association with PM10 pollution, they are not potential confounders. In contrast, there are day-to-day correlations between pollution, season and weather variables, making confounding or effect modification by weather variables possible. This is why we conducted a stratified analysis by quintiles of outdoor temperature, with adjustments made for outdoor temperature within each quintile, and conducted continuous analyses stratified by period of the year, with adjustment made for outdoor temperature (both the linear and squared term) and the difference between the current day and the previous day’s temperature. Although a quantification of deaths associated with particulate air pollution has not been done before in Belgium, one of the most polluted areas of Europe (fig 1), we realise that there is nothing new in showing an association between particulate pollution and daily mortality. The novelty of our findings is that we show, without having to resort to complex statistical modelling, that the effects of air pollution are much stronger in the summer months than in the winter months, even in our temperate climate. Moreover, the relationship between mortality and pollution is linear in summer, whereas we observed a non-linear association in winter. Such findings have substantial implications for the setting of air pollution standards in Europe.
Policy implications
Based on our data, reduction in the annual mean value of PM10 to a level of 20 µg/m3 would be associated with reductions in mortality (per 1 000 000 people/year) ranging from 18 in winter to 51 in summer. Our findings have substantial implications for the setting of air pollution standards in Europe.
What this paper adds
-
Epidemiological research has shown that mortality is higher on days with fine particulate air pollution, during cold spells and during heat waves.
-
The effect of particulate air pollution on mortality strongly depends on outdoor temperature even in a temperate climate.
-
Our data suggest a non-linear association in winter and a linear association between daily mortality and small particulate air pollution during the other seasons.
Acknowledgments
We thank G Verbeke and S Fieuws (Biostatistical Centre, Leuven) for their help with the statistical analysis and for constructive suggestions about the segmented regression procedure.
REFERENCES
Footnotes
-
This study was commissioned and financed by the Ministry of the Flemish Community (AMINAL, Brussels, Belgium).
-
Competing interests: None declared.
-
The mortality dataset was obtained from the Milieu en Gezondheid (Environment and Health) Study Group.
-
TSN is a fellow of the Flemish Scientific Fund (FWO).
Linked Articles
- In this issue