


Abstract
The stability of housekeeping genes (HKGs) is critical when performing real-time quantitative PCR. To date, the stability of common HKGs has not been systematically compared in human airway epithelial cells (AEC) in normal and atopic subjects.
Expression levels of 12 HKGs were measured in AECs from a cohort of 30 healthy atopic nonasthmatic or atopic asthmatic children. Gene expression stability was determined using three different Visual Basic for Applications applets (geNorm, NormFinder and BestKeeper).
All 12 HKGs were expressed in AECs. However, the hypoxanthine ribosyltransferase and TATA-binding protein genes were excluded from further analysis due to low expression levels. The cyclophilin A gene was ranked the most stable by all three methods. The expression levels of the β-actin and glyceraldehyde-3-phosphate dehydrogenase genes were significantly different between the three groups of patients, with atopic asthmatics showing the highest expression levels for both genes.
The results suggest that the cyclophilin A gene is the most suitable housekeeping gene analysed for expression studies utilising uncultured bronchial airway epithelial cells from healthy and asthmatic children, and highlight the importance of validating housekeeping genes for each experimental model.
The airway epithelium is emerging as an especially attractive tissue in which to identify novel mechanisms of asthma pathogenesis and new therapeutic strategies 1. The epithelium is important as a barrier and/or a source of secreted biomolecules. Accumulating evidence suggests that intrinsic differences exist between asthmatic and nonasthmatic epithelial cells both biochemically and functionally 2. These intrinsic changes could influence susceptibility to asthma. Careful comparison of the gene expression profiles of normal and asthmatic epithelium could further elucidate the molecular basis of the development of asthma.
Real-time quantitative PCR (qPCR) is a very powerful technique for the comparison of gene expression profiles under different biological conditions. When comparing gene expression profiles in normal and disease cells and tissues, it is critical to consider factors that confound expression levels, such as different amounts and quality of starting material, and RNA extraction and reverse transcription efficiencies. Among several normalisation approaches proposed 3, housekeeping genes (HKGs) are accepted and frequently used to normalise qPCR and thus reduce possible errors generated in the quantification of gene expression. An ideal HKG should be stably expressed in the cells and tissues of interest without alteration by the experimental conditions or by disease status. However, such an ideal HKG does not currently exist 4. Commonly used HKGs have shown variability in expression levels in different tissues and/or disease states 5–8, emphasising the importance of evaluation studies for the identification of the most stable HKGs in different tissues and/or disease states before commencement of any qPCR study.
A previous study reported a reduction in mRNA expression of two commonly used HKGs, namely the genes encoding β-actin (ACTB) and glyceraldehyde-3-phosphate dehydrogenase (GAPDH), in both bronchoalveolar lavage fluid cells and biopsy tissues from asthmatics not using inhaled corticosteroids compared with that in both normal controls and asthmatic subjects using inhaled corticosteroids 7. This provides direct evidence that HKGs require careful validation before use in quantitative mRNA assays in asthmatics. However, there have been no studies that have systematically compared the stability of common HKGs in normal and atopic human airway epithelial cells (AECs).
In the present study, the expression levels of 12 HKGs were measured and the stability of their expression analysed in uncultured human AECs derived from healthy nonatopic nonasthmatic, healthy atopic and atopic asthmatic children. After analysis and comparison using three different statistical methods, the present authors recommend that the cyclophilin A gene (or peptidylprolyl isomerase A gene (PPIA)) should be used as a HKG for gene expression studies in AECs of asthmatics.
METHODS
Sample collection
The present study received the approval of the Providence Health Care Research Ethics Board (Providence Health Care Research Institute, Vancouver, BC, Canada) and the Children’s Human Ethics Committee of Princess Margaret Hospital for Children (Perth, Australia). Subject selection (table 1⇓) and AEC collection have been described in detail previously 2, 9. Asthma was defined as physician-diagnosed asthma plus wheeze documented by a physician in the 12 months prior to sampling. Atopic status was determined by a positive radioallergosorbent test result using a panel of common allergens, including grass pollens, milk, mould, peanut, egg white and animal hair. All atopic asthmatic children showed mild disease, such that none were treated with inhaled or oral glucocorticosteroids. For the present study, AECs were obtained from 30 children undergoing elective surgery for nonrespiratory conditions representing three groups of patients. Briefly, immediately prior to surgery, a cytology brush (BC 25105; Olympus, North Ryde, Australia) was inserted directly through the endotracheal tube and rubbed against the epithelial surface in order to sample the cells. The brush was then withdrawn and the tip cut off into 5 mL culture medium (RPMI 1640 containing 20% (volume/volume) heat-inactivated foetal calf serum). The cell suspension was immediately put on ice and the process repeated at least once more. The collection medium was then pooled, centrifuged and resuspended in 5 mL collection medium, and macrophages were removed by positive selection. Cell number was determined using a Neubauer haemocytometer (BOECO, Hamburg, Germany) within 15 min of collection. Each sample of epithelial cells obtained by nonbronchoscopic brushing contained a mean±sd of 3.41±1.40 million cells, and this did not differ significantly between phenotype groups (data not shown). Of the 5-mL cell suspension, 2 mL (∼1.4 million cells) were used for RNA extraction.
Demographic characteristics of the three groups of children
RNA extraction and complementary DNA synthesis
Total RNA was extracted from cells using the RNeasy Mini extraction kit (Qiagen, Hilden, Germany) as described by the manufacturer. Genomic DNA was eliminated by RNase-free DNase I digestion (Qiagen) during the isolation procedure. The quality and quantity of randomly selected extracted RNA samples were assayed using the Agilent Bioanalyzer system (Agilent Technologies, Inc., Santa Clara, CA, USA). All samples were quantified using a spectrometer. Complementary DNA (cDNA) was synthesised using hexanucleotide primers and MultiscribeTM Reverse Transcriptase (Applied Biosystems, Foster City, CA, USA) in a final reaction volume of 20 μL containing 1× reverse transcriptase buffer, 5.5 mM MgCl2, 0.5 mM of each deoxyribonucleoside triphosphate, 2.5 μM random hexamers, 0.4 U RNase inhibitor, 1.25 U Multiscribe reverse transcriptase and 200 ng RNA. All reactions were performed under the following conditions: initial primer incubation step for 10 min at 25°C, followed by reverse transcriptase incubation for 1 h at 48°C, ended by reverse transcriptase inactivation for 5 min at 95°C, and cooled to 4°C before storage at -80°C.
Reference gene selection and real-time quantitative PCR
Twelve HKGs were selected from commonly used reference genes; their full names, abbreviations and functions are listed in table 2⇓. The first 11 genes were the endogenous control panel genes recommended by Applied Biosystems. The guanine nucleotide-binding protein, β-peptide 2-like 1 gene (GNB2L1) was also included as it has been shown to be stably expressed in isolated human neutrophils 10. It has also been identified as a reliable HKG for macrophages in chronic obstructive pulmonary disease patients irrespective of disease severity 11.
Housekeeping genes evaluated in the present study
The expression study for all 12 genes was performed in 384-well plates using an ABI Prism 7900HT Sequence Detection System (Applied Biosystems) using pre-made primers and probes (Applied Biosystems). The assay identifications are listed in table 2⇑. The reactions were performed according to the manufacturer’s instructions with minor modifications. Briefly, 2 μL cDNA working solution (20-fold dilution) was used in a final PCR reaction volume of 10 μL, containing 1× TaqMan PCR master mix (Applied Biosystems), 0.9 μM of each forward and reverse primer and 0.25 μM probe. The conditions for the PCR included AmpliTaq Gold activation (Applied Biosystems) for 10 min at 95°C followed by 40 cycles of 15 s at 95°C and 1 min at 60°C. All reactions were performed in triplicate, with non-template controls for each gene. The E-method 12 was used in order to adjust for differences in the amplification efficiency of the various genes. Standard curves were generated for each gene studied using the following serial dilutions of stock cDNAs: 1.33-, 4-, 12-, 36-, 108- and 324-fold. The threshold cycle (Ct) was manually determined at a fixed value of 0.2 using SDS 2.1 software (Applied Biosystems). The Ct were subsequently used to calculate a linear regression line by plotting the logarithm of template amount against the corresponding Ct. Genomic DNA contamination was checked using a pair of primers that amplify an intronic region of a gene.
Statistical analysis
In order to determine the stability of the selected reference genes, three different specific Visual Basic for Applications (VBA) applets (geNorm, BestKeeper and NormFinder) were used. The geNorm applet provides a measure of gene expression stability (M), the mean pairwise variation (V) between an individual gene and all other tested control genes 4. The BestKeeper applet determines the optimal HKGs by pairwise correlation analysis of all pairs of candidate genes, and calculates the geometric mean of the best suited ones 13. The NormFinder applet focuses on finding the gene with the least intra- and inter-group expression variation 14.
Data are presented as mean±sd. The comparisons of gene expression levels between three groups of subjects were performed using one-way ANOVA (two tailed) when expression levels were normally distributed, and by a nonparametric (Wilcoxon) test when expression levels were not normally distributed. Bonferroni correction was used to adjust for multiple comparisons.
RESULTS
Quality control and amplification efficiency
The quality and quantity of RNA extracted from the epithelial cells was assayed in eight randomly selected samples from asthmatic and healthy children using the Agilent Bioanalyzer system. Samples from atopics were not included in this analysis. Results from the Agilent Bioanalyzer were generated in the form of an electropherogram. The mean±sd quantity of RNA extracted was 2.7±0.67 μg. The quality of the total RNA, as determined by the RNA integrity number (RIN), was 7.93±0.60. The ratio of 28S to 18S RNA was 1.85. The high RIN and intact 28S and 18S ribosomal RNA subunits observed on the electropherograms indicated that degradation of the RNA occurred at an acceptable level (fig. 1⇓). Ten cDNAs were randomly amplified using intron-specific primers; all 10 cDNA samples gave negative results, whereas the genomic DNA control was positive.
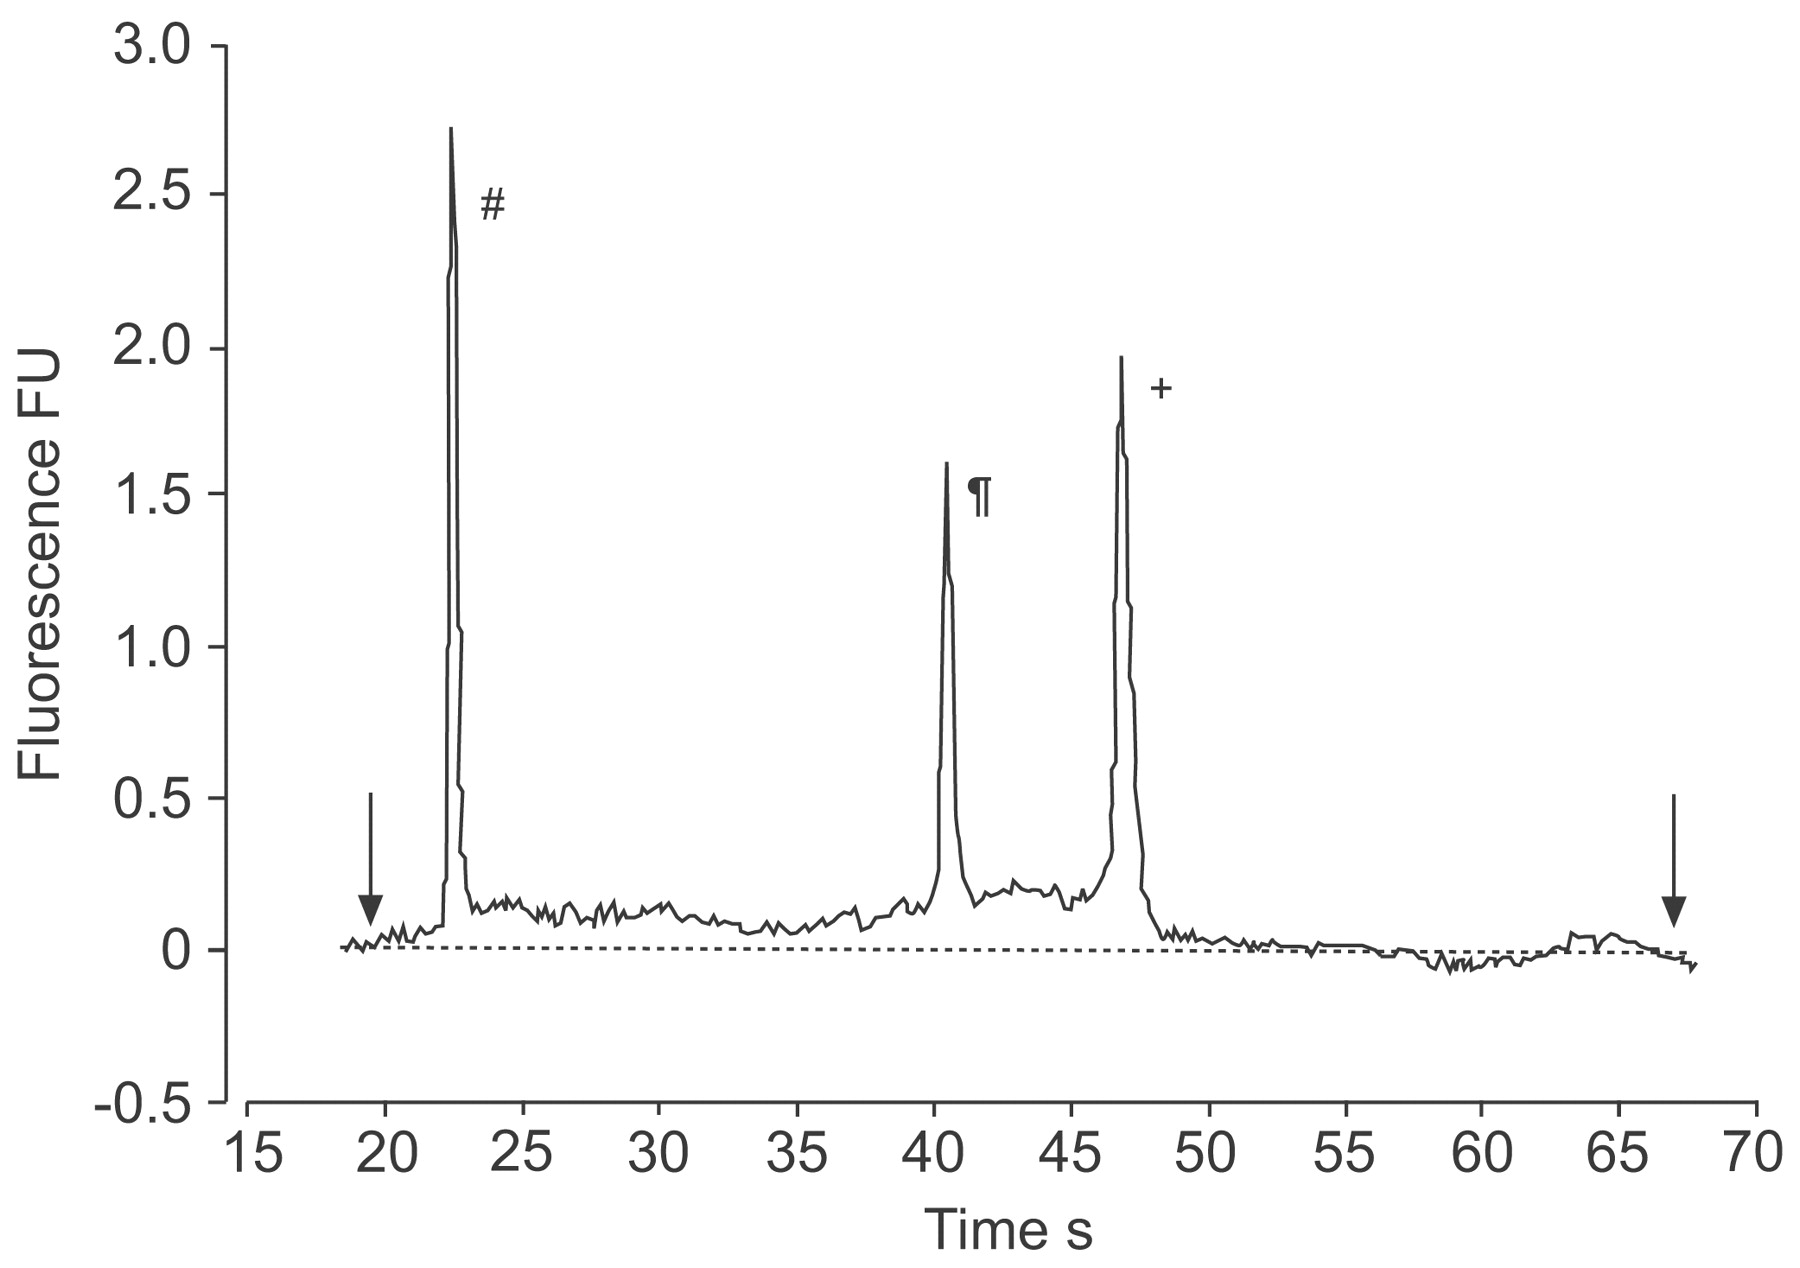
RNA analysis using the Agilent Bioanalyzer (Agilent Technologies, Inc., Santa Clara, CA, USA). Three RNA peaks are shown (#: 50 bp molecular-mass marker; ¶: 18S ribosomal RNA; +: 28S ribosomal RNA). The arrows represent the set start and end times for calculation of RNA concentration (░: baseline for calculation). FU: fluorescence unit.
Standard curves were generated by plotting times of dilution of stock cDNA against the Ct of each gene. The linear correlation coefficient (R2) of all of the 12 genes ranged 0.994–0.999. Based on the slopes of the standard curves, the amplification efficiencies of the standards, derived from the formula E = 10−1/slope – 1, ranged 89–109%. The Ct of all of the 12 genes in the samples was covered by the range of the standard curves. The E-method was then used to adjust for the amplification efficiency differences of different genes, and adjusted expression levels were calculated from the Ct of samples from the standard curves for each studied gene 12.
Expression levels of candidate HKGs
The 12 HKGs demonstrated a wide range of expression level, from the lowest median Ct of 15.8 for the 18S rRNA gene (RNR1) to the highest median Ct of 34.4 for the TATA-binding protein gene (TBP) (fig. 2⇓). In triplicate assays performed for each of the 30 cohort subjects, the sd of the Ct was >0.3 for 11 samples for the hypoxanthine ribosyltransferase gene (HPRT1) and for 16 samples for TBP. Therefore, the accuracy of the data were questionable for these two genes. This may be explained by the fact that the median Ct were 33.2 and 34.4 for HPRT1 and TBP, respectively. These high Ct indicate that the target cDNA quantities approached single copy level. Therefore, HPRT1 and TBP were excluded from further analysis. For the remaining 10 HKGs, only one sample from the healthy atopic group had a high sd in the triplicate assays for one gene, this sample also had the lowest Ct for four genes. Another sample from the healthy nonatopic nonasthmatic group had atypically high Ct, which led to outliers in the assays for two of the HKGs. Thus both of these samples were excluded from further analysis and the final analysis contained 28 samples for 10 HKGs.

Raw quantitative RT-PCR cycle threshold (Ct) for 12 candidate housekeeping genes in the 30 airway epithelial samples (□: healthy nonatopic nonasthmatic; ○: healthy atopic; ▴: atopic asthmatic). RNR1: 18S ribosomal RNA gene; RPLP0: acidic ribosomal protein gene; ACTB: β-actin gene; PPIA: cyclophilin A (or peptidylprolyl isomerase A) gene; GAPDH: glyceraldehyde-3-phosphate dehydrogenase gene; PGK1: phosphoglycerokinase gene; B2M: β2-microglobulin gene; GUSB: β-glucuronidase gene; HPRT1: hypoxanthine ribosyltransferase gene; TBP: TATA-binding protein gene; TFRC: transferrin receptor gene; GNB2L1: guanine nucleotide-binding protein, β-peptide 2-like 1, gene.
Determination of HKGs expression stability
HKG stability was evaluated using three different VBA applets, geNorm, BestKeeper and NormFinder. The geNorm program calculates the M of a gene based on the mean V between all studied genes. All 10 studied genes reached high expression stability, with low M, i.e. below the default limit of 1.5, with the exception of the transferrin receptor gene (TFRC) which had an M of 1.7. Figure 3⇓ shows the mean M of the candidate HKGs. The curve represents stepwise exclusion of the least stable HKGs. With the initial exclusion of TFRC, the acidic ribosomal protein gene (RPLP0) and PPIA were identified as the two most stable genes (table 3⇓). The geNorm program was also used to calculate a normalisation factor (NF) and to assess the optimal number of reference genes for generating this factor (fig. 4⇓). The NF was calculated first from the two most stable genes, and V was quantified between NFn and NFn+1. Adding the third gene to the most stable two HKGs, RPLP0 and PPIA, produced a V of 0.125, which was below the cut-off of 0.15, indicating that it would not be necessary to include additional reference genes for normalisation, although including six HKGs showed the smallest variation as adding the seventh gene produced the smallest V of 0.082.

Determination of the expression stability (M) of the housekeeping genes using the geNorm program. The genes were serially excluded from the analysis, with M representing the mean pairwise variation between an individual gene and all other tested control genes. The gene indicated at each point on the x-axis is the one that is to be excluded from the following step. The most stable genes are those that are still included, i.e. those that exhibit the lowest M. TFRC: transferrin receptor gene; ACTB: β-actin gene; GAPDH: glyceraldehyde-3-phosphate dehydrogenase gene; RNR1: 18S ribosomal RNA gene; B2M: β2-microglobulin gene; GUSB: β-glucuronidase gene; PGK1: phosphoglycerokinase gene; GNB2L1: guanine nucleotide-binding protein, β-peptide 2-like 1, gene; RPLP0: acidic ribosomal protein gene; PPIA: cyclophilin A (or peptidylprolyl isomerase A) gene.
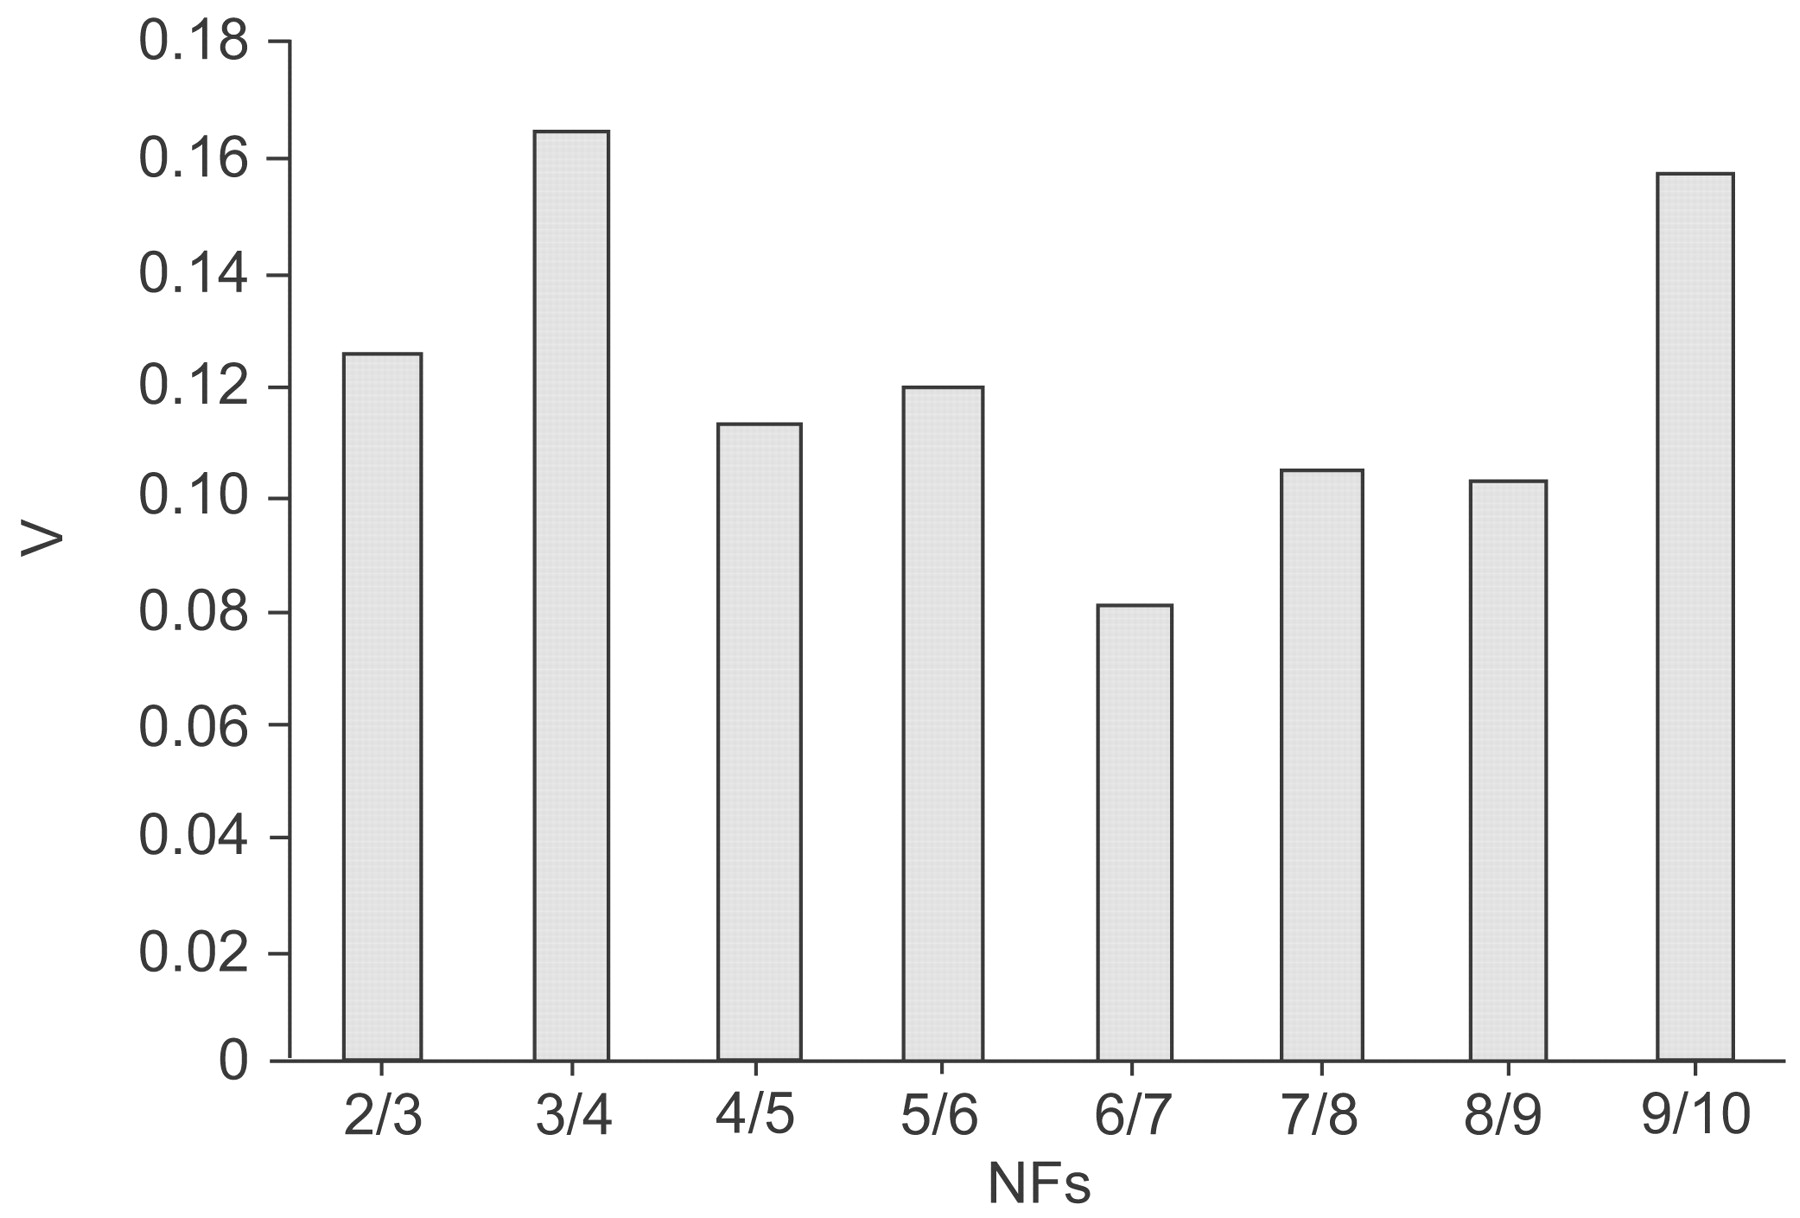
Determination of the optimal number of reference genes for normalisation. geNorm calculates a normalisation factor (NF) from at least two genes and determines the mean pairwise variation (V) between two sequential NFs, e.g. 2/3 represents the comparison of the NFs from two and three genes, respectively.
Housekeeping gene(HKG) expression stability# as determined by three different Visual Basic for Applications applets
The BestKeeper program was used to grade candidate HKG stability. This approach permits a comparative analysis across HKGs. All 10 candidate HKGs were highly correlated and were combined into an index. Subsequently, the correlation between each HKG and the index were calculated. The best correlation between the HKGs and the BestKeeper index was obtained for PPIA (r = 0.988; table 3⇑).
Finally, the NormFinder program was used to rate candidate HKG stability. This approach combined the intragroup and intergroup expression variation into a stability value that enabled the genes to be ranked by expression stability. The most and least stable genes identified by this program were PPIA and TFRC, respectively, which were identical to those generated by the geNorm and BestKeeper analyses, although the order of stability of the other genes, as judged by the three different programs, differed slightly (table 3⇑).
Expression levels of candidate HKGs in three groups of subjects
PPIA was the only HKG among the top two most stable HKGs as found by the three different analytical methods. Using this gene as reference, the expression levels of the other candidate HKGs were compared in three phenotypically distinct groups of children, healthy nonatopic nonathmatics, healthy atopics and atopic asthmatics (fig. 5⇓). The results show that, before correcting for multiple comparisons, the expression levels were nonsignificantly different between the three groups of patients for three genes (RPLP0, GNB2L1 and the β2-microglobulin gene (B2M)). There were borderline significant differences for one gene (phosphoglycerokinase gene (PGK1), p = 0.07), moderately significant differences for three genes (β-glucuronidase gene (GUSB), p = 0.026; TFRC, p = 0.021; RNR1, p = 0.037) and highly significant differences for two genes (ACTB, p = 0.0047; GAPDH, p = 0.0008). After Bonferroni correction (nine comparisons), the expression levels of ACTB and GAPDH were still significantly different; atopic asthmatics showed the highest expression levels for both genes, whereas healthy nonatopic nonasthmatics exhibited the lowest expression for both genes (adjusted p-values of 0.042 and 0.007, respectively).

Comparison of the relative expression levels of housekeeping genes between the three groups (□: atopic asthmatic; ▓: healthy atopic; ▒: healthy nonatopic nonasthmatic). The relative expression level of each gene was calculated by using the cyclophilin A (or peptidylprolyl isomerase A) gene as the reference. a) Comparison of the expression levels of six genes by one-way ANOVA (two tailed). Data are presented as mean±sem. b–d) Boxplots comparing the expression of three genes using the nonparametric Wilcoxon test. Boxes represent median and interquartile range; vertical bars represent range. RNR1: 18S ribosomal RNA gene (p = 0.037); RPLP0: acidic ribosomal protein gene (p = 0.677); ACTB: β-actin gene (p = 0.0047); GAPDH: glyceraldehyde-3-phosphate dehydrogenase gene (p = 0.0008); PGK1: phosphoglycerokinase gene (p = 0.07); GNB2L1: guanine nucleotide-binding protein, β-peptide 2-like 1, gene (p = 0.543); B2M: β2-microglobulin gene (p = 0.129); GUSB: β-glucuronidase gene (p = 0.026); TFRC: transferrin receptor gene (p = 0.021).
Although the orders of HKG expression stability differed slightly between the three different VBA applets, the seven most stable HKGs were the same for all three programs. In addition, the geNorm program identified that the six most stable HKGs produced the smallest variation. An NF was calculated from the expression levels of these six genes, the expression levels of all 10 studied HKGs in the three groups of patients were compared, and the results obtained were similar to those obtained using a single HKG, namely PPIA. After Bonferroni correction (10 comparisons), the expression levels of ACTB and GAPDH were still significantly different between the groups (corrected p-values of 0.011 and 0.006, respectively). Even with the most conservative Bonferroni correction, i.e. correction for 19 comparisons, the results were still significant (adjusted p-values of 0.021 and 0.011). However, since the NF calculated from the expression levels of six genes and that from a single gene were highly correlated, with an r2 of 0.89, the test that used PPIA as a HKG and the test that used six genes as HKGs were not independent. Therefore, using the Bonferroni correction was very conservative.
Co-regulation of studied HKGs
When determining HKG stability using a pairwise comparison approach, such as geNorm or BestKeeper, co-regulation among the studied genes may influence the results since these algorithms select any co-regulated genes. In order to examine potential co-regulation among the studied genes, network analysis was performed using Ingenuity Pathways Analysis (Ingenuity Systems, Inc., Redwood City, CA, USA) 15. Based on known relationships from published articles, this web-based application permits the discovery, visualisation and exploration of interaction networks.
The present analysis showed that, except for two genes, namely RPLP0 and GNB2L1, there was no correlation between the assessed genes. A more-in-depth analysis revealed that an indirect link between certain genes occurred in the presence of activation of a tissue by the inflammatory mediator tumour necrosis factor, or, in the context of cancer, the oncogene myelocytomatosis viral oncogene homologue (MYC). However, the promoter regions of these genes were found not to share any specific binding sites, suggesting that, other than during stimulation with tumour necrosis factor or MYC, the expression of these genes is largely independent.
DISCUSSION
An ideal HKG should maintain a stable RNA transcription level in all subjects regardless of disease status. Hence the purpose of the present study was to evaluate the variation in expression among 12 potential HKGs in AECs from normal, atopic and atopic asthmatic children. A literature search showed that no single gene has been consistently used as a reference gene in studies of airway epithelium 16–20. Moreover, the HKGs used as normalisers were not systematically evaluated as in the present study.
The present study was characterised by: 1) the simultaneous investigation of a panel of 12 common HKGs; 2) the use of TaqMan probe assays for gene expression quantification (for all but the RNR1 assay, the probes spanned an intron of the gene in question); 3) the use of three different applets for data analysis; and 4) AECs being the major component (96.6%) of the total cells, as determined by immunostaining with various cellular markers 2, 9. These features are important for data reliability and meaningful interpretation of the results.
All HKGs except GNB2L1 were chosen from the TaqMan Human Endogenous Control panel (Applied Biosystems). The HKGs investigated can generally be classified into eight different groups: glycolysis-related genes (PGK1 and GAPDH), transcription-related genes (TBP), translation-related genes (RNR1), structure/cytoskeleton-related genes (ACTB), genes involved in protein synthesis (RPLP0), genes encoding lysosomal enzymes (GUSB), nucleotide-metabolism related genes (HPRT1), and, finally, genes that cannot be clearly categorised into one of these groupings, including PPIA, B2M, TFRC and GNB2L1 (table 2⇑). Studying HKGs that show a diversity of function enables successful selection of reference genes for different cells, tissues and disease status.
The use of TaqMan assays provides greater specificity, accuracy and reproducibility than do other real-time detection methods (such as SYBR Green) 21. In addition, the design of probes spanning an intron avoids errors arising from contaminating genomic DNA, an important factor influencing gene expression quantification.
The HKG stability orders determined by the three different VBA applets were not exactly the same, which could be explained by the different principles employed by each of these applets. Both geNorm and BestKeeper use a pairwise comparison approach 4, 13. geNorm chooses the appropriate reference genes based on geometric mean expression levels. The principle is that the expression ratio of two ideal HKGs is identical in all samples, regardless of experimental condition and disease status. Variation in the expression ratio of two tested HKGs may be due to variable expression of one or both of the genes; therefore, variation in the ratio increases as expression stability decreases 4. The design of the geNorm method was not suitable for the identification of a single best HKG, but, rather, combinations of at least two genes that best represented the geometric mean 4. BestKeeper also selects the least variable gene using the geometric mean, but uses raw Ct data instead of data converted to relative expression level, as used in geNorm 13. BestKeeper also identifies the most stable gene of all HKGs evaluated 13. The pairwise comparison approach has the problem that it tends to select genes with similar expression profiles. The NormFinder uses a model-based approach 14. This approach analyses subgroups separately, estimates both the intra- and intergroup expression variation, and calculates a candidate gene stability value 14. The best HKG exhibits minimal combined inter- and intragroup expression variation. Compared with pairwise comparison approaches, this method has the advantages of considering systematic differences between sample subgroups and is less affected by candidate HKG co-regulation 14. Theoretically, this model-based approach is more suitable for the current study design. In the present study, PPIA was identified as the most stable gene by the three programs, based on either the pairwise comparison approach or the model-based approach. RPLP0 and GNB2L1, which were identified as being potentially correlated by Ingenuity Pathways Analysis, were in the top three most stable genes on geNorm analysis although they were still positioned after PPIA. It is concluded that, even if potential co-regulation exists among some of the HKGs, this was not apparent in the present study. A similar result was obtained by Bionaz and Loor 22. Furthermore, several individual studies have used geNorm, BestKeeper and NormFinder programs to identify the most stable HKG and given variable results, being consistent for all three programs in some but not in others 14, 23–25. In those studies in which inconsistent results were identified, the NormFinder program was identified to be superior to the other programs 14. Hence the present authors recommend using the NormFinder program to select HKGs in studies with an experimental design similar to the present one.
PPIA encodes a member of the immunophilin class of proteins, which all possess peptidylprolyl cis/trans isomerase activity and are, therefore, believed to be involved in protein folding and/or intracellular protein transport 26. PPIA is used as a HKG because of its remarkable evolutionary conservation and broad cellular and tissular distribution 27. In a recent report, PPIA was used as a HKG in an expression study of AECs because it was not significantly affected by allergen challenge 19. In the present study, PPIA was ranked among the most stable genes by all three methods. In addition, the six most stable genes and four least stable genes were the same by all three methods; the utilisation of PPIA and all six top-ranked genes as reference genes produced very similar results. Collectively, the present results identify PPIA as the HKG gene of choice for gene expression studies in AECs from asthmatics.
It is worth mentioning that variations always exist for any HKG, and normalisation of gene expression with a single HKG can bias results. Therefore, it has been suggested that multiple HKGs should be used 4. The results of the present study suggest that it would be more robust to use three (PPIA, PGK1 and RPLP0) to six HKGs (PPIA, PGK1, RPLP0 GNB2L1, GUSB and B2M) if the experimental resources are available.
The present study also demonstrated that there were significant differences in the expression levels of ACTB and GAPDH between normal, atopic and atopic asthmatic children, with the highest expression being found in asthmatics and the lowest in normal children. The differences remain significant after correcting for multiple comparisons. This result indicates that both ACTB and GAPDH, the two most commonly used HKGs, cannot be used as HKGs in gene expression studies in the AECs of asthmatics. Similar results have previously been reported by Glare et al. 7. However, in the study of Glare et al. 7, asthmatic subjects not using inhaled corticosteroids exhibited levels of GAPDH and β-actin mRNA that were significantly lower than those of both normal controls and asthmatic subjects using inhaled corticosteroids. This may be explained by the fact that the cell types in the two studies were different. In the current study, AECs were the dominant (>96.6%) cell type, whereas, in the study of Glare et al. 7, epithelial cells were a minority (<1.4%), and macrophage and lymphocytes were the majority (>92.5%). In addition, in the present study, the research subjects were children, whereas Glare et al. 7 studied adults. The differences observed between these two studies serve only to further highlight the importance of researchers validating HKGs for each experimental model utilised.
In conclusion, the cyclophilin A gene was identified as the most suitable normaliser in gene expression studies involving human airway epithelial cells derived from normal, atopic and asthmatic children. Moreover, the present findings question the suitability of the genes encoding both β-actin and glyceraldehyde-3-phosphate dehydrogenase as housekeeping genes for such studies due to their significantly higher expression levels in asthmatic epithelial cells.
Support statement
This study was supported by the National Health and Medical Research Council of Australia (Canberra; 303145 and 458513), the Child Health Research Foundation (Perth), the Asthma Foundation of Western Australia (Perth), AllerGen (Hamilton, ON, Canada), a Canadian National Centre of Excellence Network, and the British Columbia Lung Association (Vancouver, BC, Canada). J-Q. He is the recipient of a Michael Smith Foundation for Health Research (Vancouver) Fellowship and Izaak Walton Killam Memorial Scholarship (Halifax, NS, Canada).
Statement of interest
A statement of interest for P.D. Paré can be found at www.erj.ersjournals.com/misc/statements.shtml
- Received October 1, 2007.
- Accepted April 2, 2008.
- © ERS Journals Ltd
References


