


Abstract
The aim of this study was to examine the relationship between the structural changes in large and small airways in asymptomatic asthmatics quantified by high-resolution computed tomography (HRCT) and airflow obstruction.
The bronchial wall thickness at the trunk of the apical bronchus (B1) of the right upper lobe was used for assessment of the large airways. Air trapping, evaluated by the ratio of the average CT‐determined values for the bilateral upper and lower lung segments at full expiration to that at full inspiration (E/I ratio), was used for assessment of the small airways. Measurements were obtained with a helical HRCT in 24 asymptomatic asthmatics followed by optimal treatment with inhaled and/or oral corticosteroids for >6 months. Prior (20–30 min) to the HRCT examination, all patients were given an inhaled bronchodilator.
The ratio of airway wall thickness to outer diameter (T/D) and the percentage wall area (WA%) at the B1 bronchus and the E/I ratio were significantly greater for the 14 asthmatics with deficient reversible airflow obstruction (forced expiratory volume in one second (FEV1) <80% prediced or FEV1/forced vital capacity <70% after bronchodilator inhalation) than for the 10 asthmatics with normal spirometry and seven normal subjects. T/D, WA%, and E/I ratio showed significant negative correlations with FEV1 % pred after bronchodilator inhalation. The E/I ratio also showed significant positive correlations with T/D, WA%, and residual volume/total lung capacity.
These findings suggest that, in spite of optimal treatment, structural changes in both large and small airways may simultaneously occur in asthmatics with deficient reversible airflow obstruction.
- air trapping
- airflow obstruction
- airway remodelling
- airway wall
- bronchial asthma
- high-resolution computed tomography
Asthma is defined as an airway disease characterised by reversible airflow obstruction, airway eosinophilic inflammation and bronchial hyperresponsiveness. In the majority ofpatients, complete reversibility of long-term abnormal spirometric findings can be achieved after treatment with bronchodilators and/or a course of corticosteroids. Some asthmatic patients, however, continue to show evidence of residual airflow obstruction, even after aggressive treatment 1, 2, which may be observed months after cessation of asthmatic symptoms 3, 4.
Asthma represents a chronic inflammatory process of the airways followed by healing that may result in an altered structure referred to as a remodelling of the airways 5. These structural changes are characterised by an increase in the thickness of the airway wall, which results from mucosal infiltration by inflammatory cells, deposition of connective tissue on the extracellular matrix, and an increase in muscle mass, mucus glands and vessel area 6. It has been demonstrated that these structural changes can occur not only inthecentral, but also in the peripheral small airways 7. Theremodelling of small airways, in particular, may be largely responsible for irreversible airflow obstruction and an increase in airway responsiveness 8, 9. The progression of these structural changes may then result in an increased resistance to airflow, and a decline in the forced expiratory volume in one second (FEV1). This irreversible component of the airflow obstruction is more prominent in patients with severe asthma and may persist even after aggressive anti-inflammatory treatment. It is therefore important to assess the structural changes in the airway when deciding on the most appropriate asthma therapy for individual asthmatics.
To determine the occurrence of airway remodelling, bronchial biopsy samples obtained with a bronchofibrescope are subjected to histological examination. However, bronchial biopsy is invasive and causes considerable pain, while assessment of the peripheral small airways and of changes in the deep submucosal tissue and airway smooth muscle in large airways is technically difficult. Noninvasive evaluation of airways by means of imaging with high-resolution computed tomography (HRCT) has therefore been tried as an alternative procedure, and was found to have the potential to evaluate airways in patients with obstructive pulmonary disease 10–12. The measurement of airway wall thickness by HRCT in patients with asthma has been demonstrated to correlate with the severity of asthma 10.
The purpose of the study presented here was to indirectly examine the structural changes in the large airways and air trapping by means of HRCT, and their relationship with pulmonary function in patients with stable and asymptomatic asthma. For assessment of the large airways, wall thickness was measured at the trunk of the apical bronchus of the rightupper lobe, i.e. the right B1 bronchus, because it usuallyappears as a cross-section and is easily identified on CT scans. In order to determine the presence of air trapping, the averaged CT-detemined values were obtained for the bilateral lung segments at the levels of the upper and lower lobes both at full inspiration and at full expiration. The ratioof these values (the E/I ratio) has been demonstrated to reflect air trapping and the presence of diseased small airways in patients with emphysema and pulmonary infection by Mycobacterium avium-intracellulare as described previously 13, 14. By using the same method, the presence of air trapping in asthma has also been demonstrated on inspiratory and expiratory CT scans 15, 16. Wall thickness of the right B1 bronchus and the E/I ratio in stable and asymptomatic patients with asthma were measured. The patients were divided into two groups. One group showed normal FEV1 of ≥80% predicted and an FEV1/forced vital capacity (FVC) of ≥70% after bronchodilator inhalation. The other group showed persistent abnormal FEV1 (<80% pred) or FEV1/FVC (<70%) after bronchodilator inhalation. These variables were compared in the two groups, and the relationship between the variables and pulmonary function test examined.
Methods
Subjects
Asymptomatic patients (n=24) with bronchial asthma and without a smoking history were recruited from the outpatient clinic. All patients had a clinical history of intermittent wheezing with previously documented evidence of airway hyperresponsiveness to methacholine and reversible airflow obstruction. These two variables were defined as an increase in FEV1 of 15% and ≥200 mL following the inhalation of 20 µg procaterol hydrocloride administered with a metered-dose inhaler or after treatment for asthma exacerbation. The patients were enrolled in this study if their asthma symptoms had disappeared according to their symptom diaries and peak flow monitoring showed no morning dip and no daily variability of >20% for >2 months following treatment for asthma, including inhaled corticosteroids with or without oral corticosteroids, for ≥6 months. Twelve patients were male, and 12 were female, and their age ranged from 26–78 yrs, with a mean of 56 yrs. Sixteen of the patients had atopic and eightnonatopic type asthma (atopic type was defined as an increase in total immunoglobulin (Ig)E (>400 IU) or a positive reaction to one or more inhalant forms of 26 typical allergens in a radioallergosorbent or skin-prick test). None of the patients had ever smoked. All patients were using inhalant fluticazone propionate (18 used a dose of 400 µg·day−1 and six used a dose of 800 µg·day−1), five used oral prednisolone (5–15 mg·day−1), 21 oral theophylline and/or β2‐agonist, 10 oral prunlukast and four oral thromboxane A2‐receptor antagonist (serotorodast). All patients had been without airway infection for 2 months prior to the study. The mean duration of their illness was 12.3 yrs (0.5–30 yrs). Seven normal healthy volunteers (four males and three females) ranging in age from 40–67 yrs with a mean age of 55 yrs were also recruited. All were nonsmokers, nonatopic, and showed no abnormalities in response to a pulmonary function test. All subjects had given their informed consent for the study, which had the approval of the hospital's ethics committee.
Protocol
Prior to the HRCT examination, all patients were given a pulmonary function test followed by inhalation of β2‐agonist (20 µg procaterol hydrocloride). Fifteen minutes after inhalation of the β2‐agonist, FEV1 was measured again, followed by HRCT examination within 20–30 min of the inhalation.
Pulmonary function tests
FVC and FEV1 were measured in triplicate with a spirometer (Chest Graph HI‐701; Chest Co. Ltd, Tokyo, Japan) before and 15 min after the inhalation of β2‐agonist (20 µg procaterol hydrocloride). Vital capacity (VC), functional residual capacity (FRC), and diffusing capacity of the lung for carbon monoxide (DL,CO) were measured with a pulmonary function testing system (Chestac‐55V; Chest Co. Ltd). Plethysmography was used to measure FRC with the aid of a Body Box (Medgraphic, Ann Arbor, MI, USA), after which the subjects immediately inspired to total lung capacity (TLC) and maximally expired to residual volume (RV), thus allowing for calculation of lung volumes and of RV/TLC. VCand FEV1 were also expressed as a percentage of the predicted values, which had been calculated with the formulas developed by Baldwin et al. 17 and Berglund et al. 18, respectively. DL,CO was measured with the single-breath method and the per cent predicted values for DL,CO were determined with the method of Nishida et al. 19.
High-resolution computed tomography scanning
A helical CT scanner (Hi Speed Advantage; GE Medical Systems, Milwaukee, WI, USA) was used for conventional 10‐mm thick contiguous scanning for screening of chest abnormalities, followed by six thin-section HRCT scannings at full inspiration (at TLC level) with 1‐mm collimation of thetrunk of the apical bronchus of the right upper lobe, i.e. the right B1 bronchus, to quantify airway wall thickness (120 kVp, 200 mA, pitch 1.0). The trunk of the right B1 bronchus was usually observed as a cross-section and easily identified on CT scans. The HRCT images were photographed with a window setting appropriate for evaluating airway walls (window level −450 Hounsfield units (HU), window width 1,500 HU). Only the bronchi that were seen as end-on slices were selected, while those at an angle were excluded from analysis if the longest diameter exceeded the shortest diameter by a factor of >1.2. With the bronchus identified, the following parameters were measured with electrical calipers: the shortest and longest luminal diameter (LD), the shortest and longest outside diameter of the bronchus (D), the luminal areas (Ai), and the outside area of the bronchus (Ao). Airway wall thickness was calculated with the formula:  where T is wall thickness. The wall area (WA) was calculated with the formula:
  Two previously reported indices were used to compare airwaydimensions: the ratio of airway wall thickness to total diameter (the T/D ratio), and the percentage wall area (WA%) equal to (WA/Ao)×100 10, 20.
For the E/I ratio 13, 14, scanning with 1‐mm collimation (120 kVp, 200 mA, pitch 1.0, scan time of 1 s) was performed and HRCT images were reconstructed with bone algorithms. Each four 1‐mm slices at two anatomical levels, i.e. at the level of the carina (the level of the upper lung field) and of the orifice of the inferior pulmonary veins (the level of the lower lung field) were obtained at both full inspiration and full expiration. However, since these mediastinal landmarks shift during exhalation from TLC to RV, these mediastinal landmarks were used as general standards. The anatomical matching of the upper and lower lung slices was performed by using parenchymal anatomic landmarks of well-visualised blood vessels. The breath-holding technique at full inspiration (TLC) and expiration (RV) was thoroughly rehearsed with each patient practicing using the spirometer just prior to the HRCT scanning in order to minimise differences, and it was confirmed that the differences in VC were minor. Also, a technician standing by the patient encouraged them to make a maximum effort and confirmed this by using a spirometer during CT imaging. HRCT images were photographed with a window setting appropriate for the lungs (window level −700 HU, width 1,000 HU). The averaged CT‐determined values for each lung segment were calculated at full inspiration (TLClevel) and expiration (RV level). After the average CT‐determined value had been calculated automatically, areas showing an attenuation of ≤−3,000 HU and ≥−500 HU were excluded from the calculation in order to eliminate the chest wall, mediastinum, bronchial and vascular areas. The maximum threshold of CT‐determined values was set at −500 HU in order to exclude the effect of fat tissue of the chestwall and mediastinum. Usually, the CT‐determined value of fat is −100 HU. However, partial volume artefact affects the measurement of fat on CT. Therefore, the maximum threshold was set at −500 HU after due consideration of the partial volume artefact. The minimum threshold of CT‐determined values was assumed to be −3,000 HU because the same result is obtained if the minimum threshold is below −1,000 HU, which is the CT‐determined value of air. The E/I ratio was obtained by dividing the averaged CT‐determined values for both the upper and lower lung segments at the RV level by those at the TLC level.
Statistics
The data are presented as mean±sem. The comparisons among control subjects, and the two asthmatic groups were performed with one-way analysis of variance, followed by multiple comparisons using the unpaired t‐test or Mann-Whitney U‐test when appropriate. The level of significance was adjusted by using the Bonferroni correction. The correlation between variables was examined by calculating the Pearson's product correlation coefficient. A value of p<0.05 was considered significant.
Results
In 14 patients, the per cent predicted values for FEV1 or FEV1/FVC did not reach normal values (FEV1/FVC <70% in11 patients and FEV1 <80% pred in 12 patients) even after the inhalation of β2‐agonist. These 14 patients, who all had one of the components of irreversible airflow obstruction, were classified as group B. The remaining 10 patients, who showed normal spirometric values (FEV1/FVC ≥70% and FEV1 ≥80% pred) after the inhalation of β2‐agonist and had no irreversible airflow obstruction were classified as group A. The characteristics of the patients in both groups are shown intable 1⇓. There were no significant differences in sex, atopy rate, peripheral eosinophils, or IgE levels between the two groups. Although the asthmatic patients in group B tended to be older and the length of their illness longer, there were no significant differences. Conversely, the FEV1/FVC and FEV1 (% pred) before and after β2‐agonist inhalation and VC (%) were significantly lower, and the RV/TLC was significantly higher in group B. The results of the measurements on CT scan are shown in table 2⇓. The T, LD, and D, which are the means of the shortest and longest diameters, were normalised by using the body surface area (BSA)1/2 and the WA and Ai were normalised with the BSA 21. The T/D ratio and WA% were significantly higher for the asthmatics in group B compared with those for normal subjects and the asthmatics in group A. There were no differences in these variables between the asthmatics in group A and normal subjects. Although the D, D/(BSA)1/2, T, and T/(BSA)1/2 tended to be longer in group B, there were no significant differences in D, D/(BSA)1/2, T, T/(BSA)1/2, LD, LD/(BSA)1/2, Ai, and Ai/BSA among the three groups. The T/D ratio and WA% showed significant negative correlations with FEV1 % pred after the inhalation of β2‐agonist (r=0.60, p<0.01 and r=0.50, p<0.05, respectively; fig. 1⇓).

a) Relationship between the ratio of wall thickness to outer diameter (T/D ratio) and forced expiratory volume in one second (FEV1) % predicted 15 min after bronchodilator inhalation in asthmatics (r=0.60, p<0.01). b) Relationship between the percentage wall area (WA%) at the trunk of the right B1 bronchus and FEV1 % pred 15 min after bronchodilator inhalation in asthmatics (r=0.50, p<0.05).
Patient characteristics in two asthmatic groups
Comparison of computed tomography (CT) measurements and expiration/inspiration (E/I) ratio in normal subjects and two asthmatic groups
HRCT scans at full inspiration and expiration in the lowerlung field of a patient in group A, who showed normal spirometric values (FEV1 % pred 107.6%, FEV1/FVC 92.8%), and a patient in group B, who showed a remained airflow obstruction after bronchodilator inhalation (FEV1 % pred 66.2%, FEV1/FVC 76.4%), are shown in figure 2⇓. HRCT imaging revealed that the area of the lung field had decreased to a mean of 62% of the original value and the density of the lung field clearly increased at full expiration in the patient in group A as was seen in normal subjects. The area (mean 75%) and density of lung field of the patient in group B, however, did not change as much as in the other two groups, which indicated the occurrence of air trapping. The E/I ratios were significantly higher for the asthmatics in group B compared with those in the other two groups. There were no significant differences between the E/I ratios for the upper and lower lung fields in any of the three groups. The E/I ratio for asthmatics showed significantly negative correlation with FEV1 % pred after bronchodilator inhalation (r=0.55, p<0.01; fig. 3a⇓) and significant positive correlation with RV/TLC (r=0.76, p<0.01). The E/I ratio also showed significantly positive correlations with T/D ratio and WA% (r=0.61, p<0.01 and r=0.51, p<0.05, respectively; fig. 3b⇓).
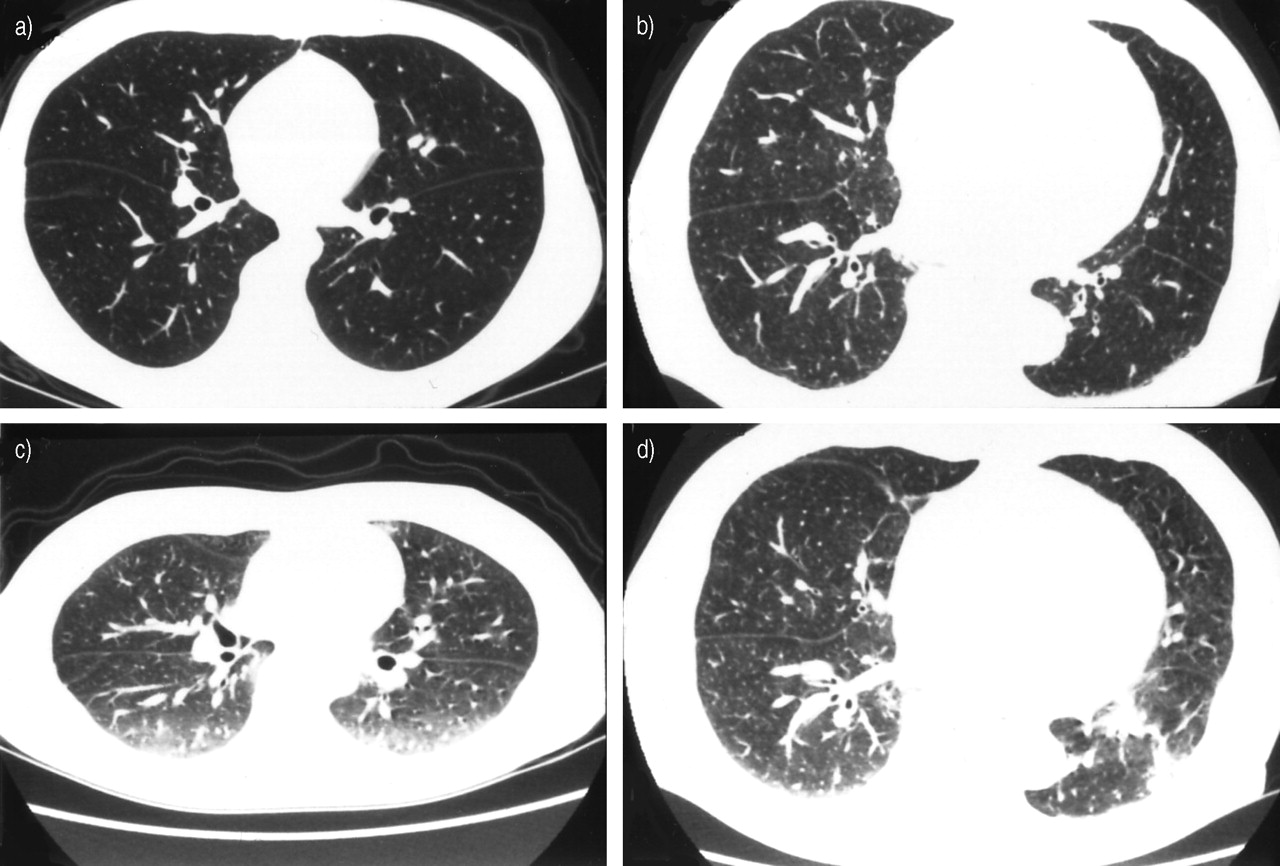
Chest high-resolution computed tomography scans at a) full inspiration and c) full expiration of a patient with asthma in group A who showed normal forced expiratory volume in one second (FEV1) and FEV1/forced vital capacity after bronchodilator inhalation, and at b) full inspiration and d) full expiration of the lower lung fields of a patient with asthma in group B who showed persistent airflow obstruction.

Relationship between the ratio of the average computed tomography-determined values for the bilateral upper and lower lung segments at full expiration to that at full inspiration (E/I ratio) and a) forced expiratory volume in one second (FEV1) % predicted, 15 min after bronchodilator inhalation, and b) the ratio of wall thickness to outer diameter (T/D ratio) at the trunk of the right B1 bronchus in asthmatic patients.
Discussion
Awadh et al. 10 demonstrated that the T/D ratios and WA% at the segmental and subsegmental bronchi, as assessed by HRCT scanning, for asthmatics are higher than those for normal subjects. They also found that more severe asthma patients showed greater airway wall thickening than those with mild asthma. It has further been reported that asthmatics with incomplete reversibility of airflow obstruction showed anincreased airway wall thickness on HRCT compared with asthmatics with complete reversibility of airflow obstruction 2, 21. In the present study, airway wall thickness evaluated in terms of the T/D ratio, and WA% at the trunk of the apicalbronchus of the right upper lobe, had significantly increased in 14 asymptomatic asthmatics compared with the corresponding values for the asthmatics who did not have anirreversible component of airflow obstruction and with normal subjects. In the asymptomatic patients, FEV1 or FEV1/FVC remained abnormal after bronchodilator inhalation following long-term therapy for asthma, including inhaled corticosteroids. However, there was no significant difference in airway wall thickness between normal subjects and the asthmatics with normal spirometry after bronchodilator inhalation. Furthermore, both the T/D ratio and WA% also showed significant negative correlations with FEV1 % pred after bronchodilator inhalation. Wall thickness of the large airway was determined at the trunk of the apical bronchus of the right upper lobe because it has been reported to be large enough to be accurately measured and anatomically reproducible between subjects 22. The cross-section of a bronchus with a luminal diameter of >2 mm was easily obtained at the right B1 bronchus, and the ratio of the longest to the shortest diameter was from 1.0–1.2 with a mean of 1.15.
The pathological features of bronchial wall thickening mayreflect not only irreversible airway remodeling such as hypertrophy of mucus-secreting glands, subepithelial fibrosis, marked thickening of basement membrane, hyperplasia and hypertrophy of airway smooth muscle, but also reversible components such as oedema, infiltration by inflammatory cells and bronchoconstriction. To achieve the purpose of thisstudy, i.e. to examine irreversible structural changes of airways with the aid of HRCT scanning, stable and asymptomatic asthmatics who showed no morning dip and no daily variability of peak flow of >20% were selected. The reversible components were then eliminated as much as possible by optimal treatment including corticosteroids and bronchodilator inhalation. The 6‐month treatment of inhaled and/or oral corticosteroids may not always be sufficient tocompletely suppress airway inflammation, and not all instances of increased airway wall thickness may represent irreversible structural changes, i.e. airway remodelling. Nevertheless, the increased wall thickness is highly likely to represent structural changes resistive to the 6‐month treatment. These procedural aspects may have contributed to the significant correlation between the wall thickness and airflow obstruction as well as the absence of any significant differences between normal subjects and the asymptomatic asthmatics without airflow obstruction.
Airway structural changes have been demonstrated to occur not only in large, but also in small airways in post mortem histological studies 23, 24. In this study, the E/I ratiowas used to indirectly identify the occurrence of narrowing of small airways as a result of air trapping. This ratio was calculated from the averaged CT‐determined values for lung segments obtained at full inspiration and at full expiration. The areas of reduced density due to air trapping are more conspicuous on CT scans obtained during expiration from patients with diseases of the small airways 25, 26. Generally, the per cent of lung below, for example, −856, −910, or −950 HU, has been used for the detection of low attenuation area (LAA) in emphysema. In this study, however, the averaged CT number was used to assess air trapping as opposed to the per cent reduced density area. All patients with asthma in this study had no LAA at the TLC level. At full expiration, the RV level, the lung area where the air trapping occurred, showed relatively lower attenuation. The CT‐determined values of this relatively lower attenuation, which was diffusively distributed throughout the lung field, depended on the degree of air trapping. The relatively lower attenuation area was not distributed with a clear margin like the LAA observed in emphysema, which makes it difficult to determine the threshold of this lower attenuation. Therefore, it was considered better to assess air trapping in terms of changes in the averaged CT number at the TLC and RV levels.
The E/I ratio was significantly higher for the asthmatics whose FEV1 or FEV1/FVC remained abnormal after bronchodilator inhalation than for the asthmatics without irreversible airflow obstruction. There was no significant difference in the E/I ratio between normal subjects and the asthmatics without irreversible airflow obstruction. This means the presence of peripheral airway obstruction in asthmatics with an irreversible component of airflow obstruction. The E/I ratio also showed significantly negative correlation with FEV1 % pred after bronchodilator inhalation and positive correlation with RV/TLC. It has been reported that the extent of air trapping assessed by expiratory CT significantly correlates with airflow obstruction as measured by FEV1 and RV in asthma 15, 16. This finding is thus supported by that of the present study. The increased air trapping or increased RV/TLC shown in the asthmatics with an irreversible component of airflow obstruction was due to the narrowing of small airways, but not due to emphysematous destruction or loss of supporting structure, since all asthmatics were never-smokers and had never been exposed to air pollution. The evaluation on HRCT at TLC, at which volume air trapping due to closure of diseased small airways presumably does not occur, did not show any emphysematous changes. It has also been demonstrated that no emphysema cases were found among nonsmokers, including those with severe asthma or asthma of long duration 27. This suggests that the air trapping may bedue to the narrowing of small airways. The E/I ratio showed significantly positive correlation with the wall thickness of large airways. This further suggests that structural changes of the bronchial wall may occur not only in large airways, but also simultaneously in small airways. The narrowing of small airways may contribute to a more severe airflow obstruction than may result from that of large airways 8.
To conclude, the wall thickness at the trunk of the apical bronchus of the right upper lobe, assessed in terms of T/D ratio and WA%, and air trapping, assessed in terms of the E/I ratio, were significantly greater for asymptomatic asthmatics than for the asthmatics who showed normal FEV1 and FEV1/FVC and normal subjects. In the asymptomatic asthmatics, FEV1 or FEV1/FVC remained abnormal after bronchodilator inhalation following long-term optimal treatments. The degree of wall thickness and air trapping showed significant negative correlation with FEV1 % pred after bronchodilator inhalation. Air trapping also significantly and positively correlated with the wall thickness and RV/TLC.
These findings suggest that structural changes of the airwaywall may occur not only in the large airways, but also simultaneously in the small airways of asthmatics with anincomplete reversible component of airflow obstruction despite optimal treatments.
- Received September 15, 2002.
- Accepted July 22, 2003.
- © ERS Journals Ltd
References


