


Abstract
There is variability in the distribution of inflammatory cells in bronchial tissue in chronic obstructive pulmonary disease (COPD). Better strategies for biopsy sampling of the airway mucosa may improve the capacity to show a difference between study populations where variability in distribution exists.
The current authors have examined sources of biological variability in the quantification of inflammatory cells in endobronchial biopsies using immunostained samples taken from 51 subjects with COPD, with a mean forced expiratory volume in one second of 1.71 L, 55% predicted.
The distribution of variance contributed by different sources was similar for different inflammatory cell types. For CD8+ cells, a key inflammatory cell in COPD, the largest contribution to intra-subject variability (39%) was time (i.e. 10 weeks between biopsies of placebo-treated subjects), followed by airway generation (23%), biopsy (2.5%), zone (within section; 1.4%) and section (0.4%).
Power calculations demonstrated that examining one section from one biopsy, from each of two airway generations, would require a sample size of 32 subjects per group to show a difference of one doubling or halving in CD8+ cells, compared with 47 subjects per group if only one airway generation was sampled.
Therefore, biopsies from more than one airway generation should be examined in order to maximise statistical power to detect a difference between study groups.
The endobronchial biopsy studies used widely to evaluate airway inflammation in asthma 1, 2 have now been extended to the investigation of pathogenesis and treatment of chronic obstructive pulmonary disease (COPD). In contrast to the CD4+ T-cell driven inflammation of asthma, a CD8+ T-cell predominance is characteristic of bronchial biopsies, small airways and lung parenchyma of smokers with COPD 3–6. Moreover, biopsies are now being used to determine the response of the inflamed airway mucosa to anti-inflammatory therapies, such as inhaled corticosteroids 7, 8 and phosphodiesterase 4 inhibitors 9. Although stereology-based sampling methods are currently being promoted 10, the most widely used method for quantification of inflammatory cells in bronchial biopsies remains the area profile count 7, 9. With this method, the number of cut-profiles of inflammatory cells, identified by positive immunostaining, are counted within a tissue section. The number is usually normalised to the entire subepithelial area of the biopsy (less gland and muscle) or expressed, in a defined subepithelial zone, as number per length of reticular basement membrane (RBM).
When conducting endobronchial biopsy studies in COPD patients, where treatment effects are being assessed, it is important not only to plan for an adequate sample size but also to account for and, wherever possible, to reduce factors that contribute to intra-subject variation. Relatively few studies have examined the intra-subject variability of biopsy inflammatory cell counts and these have focussed mainly on healthy volunteer subjects or those with asthma 11, 12. A study by Richmond et al. 11 reported substantial intra-subject variability between anatomical sites and time. Using tests of intra-class correlation coefficient (ICC), another study by Sont et al. 12 found relatively close agreement between counts of distinct areas within a single histological section of a biopsy and between counts of different biopsies from a single airway generation. A sampling strategy, which takes into consideration within- and between-subject variability, is also required in COPD, as are data to assist in the design of parallel group biopsy studies in which statistical power to detect group differences can be maximised.
In the present study, a unified multilevel model approach was used, both to analyse the relative contributions of area profile counts to the overall variance, as well as to determine the appropriate sample size required to test differences that may exist as a result of treatment intervention. The relative contributions to biological variability of time (biopsies taken 10 weeks apart in placebo-treated subjects) and airway generation (biopsies from lobar and segmental carinii) were assessed. The variability between biopsies, between sections and between defined zones of a tissue section (i.e within a tissue section) was also evaluated. Power calculations were performed to determine the number of subjects that are required to detect a between-group difference of one doubling or halving in cell numbers in a parallel group study and a within-group comparison, where differing numbers of tissue samples are included. Based on these new data, the current authors propose a modified tissue sampling strategy that, they believe, will improve statistical power to detect between-group differences, where a treatment intervention is to be tested.
METHODS
Study design
The data used for the current report were obtained by further analyses of biopsies taken for the purposes of a previously published study 9. Patients had stable COPD with a mean forced expiratory volume in one second (FEV1) of 1.71 L, 55% predicted (Global Initiative for Chronic Obstructive Lung disease (GOLD) stage II–III) 13. Table 1⇓ shows the demographic and lung function characteristics of the data. The original study evaluated a treatment effect; therefore, post-treatment data from the active treatment group were not included in the present analysis. The effect of time in each subject was assessed using biopsies taken before and after treatment by placebo. Figure 1⇓ outlines the different hierarchical levels assessed statistically. A total of 53 patients completed the original study (28 placebo, 25 cilomilast). Of these, two patients (one from the placebo group and one from the active treatment group) had biopsies that were not suitable for analysis, and so did not contribute biopsy data. For all 51 subjects, with available data, three sections from a single biopsy per subject were analysed for CD8+, CD68+ and neutrophil elastase (NE) and one section per subject for CD4+, IL-8 and tumour necrosis factor (TNF)-α. A total of 20 subjects had biopsies analysed from two airway levels, eight subjects had three biopsies analysed and 20 subjects had analysis of the zone 100-μm deep from the epithelium. Twenty-seven placebo-treated subjects were included in the analysis of variability over time.
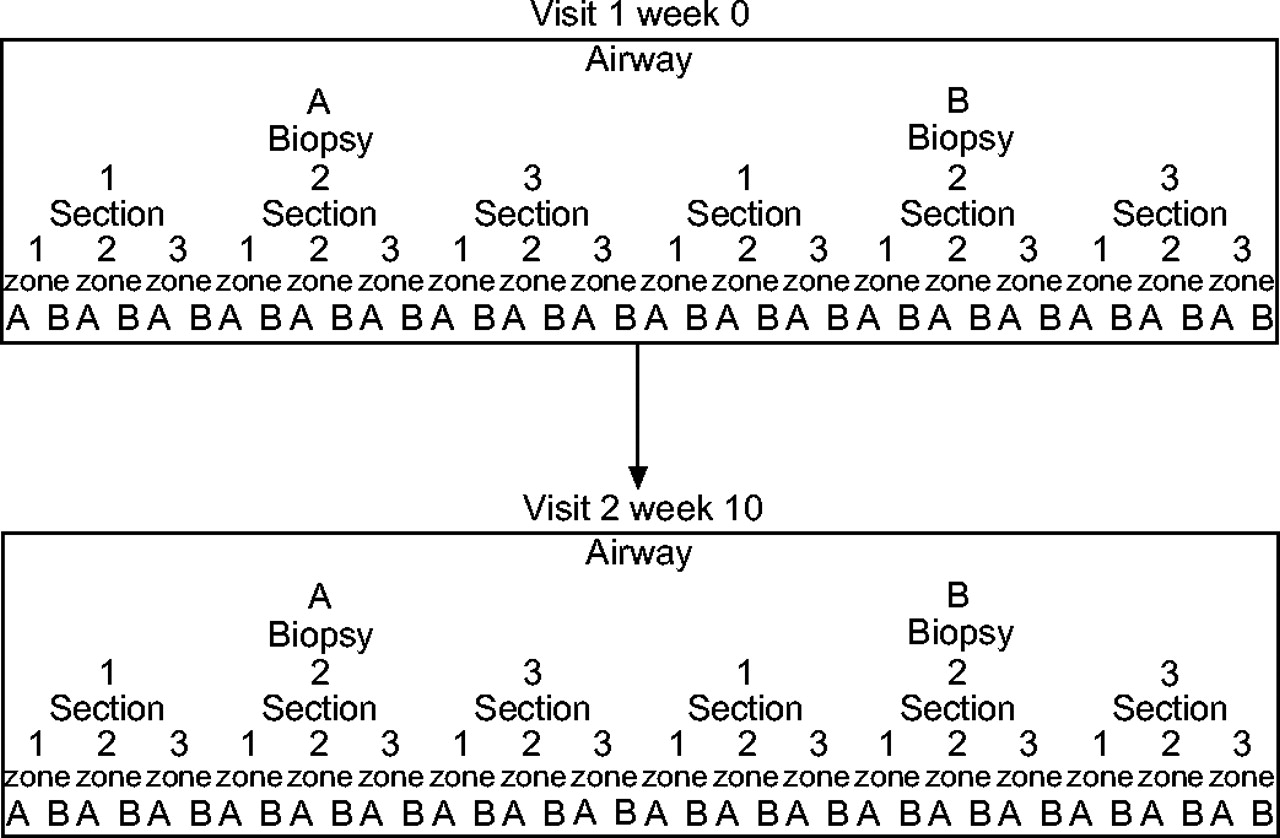
The hierarchical structure of the data.
Demographic characteristics
Bronchoscopy procedure and biopsy processing
A bronchoscopy was performed according to American Thoracic Society guidelines as previously described 3. A total of 51 patients underwent two bronchoscopies 10 weeks apart. Three endobronchial biopsies were obtained from the carinae of the right middle/lower lobar bronchus and three from the segmental airways of the right lower lobe.
Full details of biopsy processing have been published previously 9. Three-step sections from each biopsy were stained using immunohistochemistry for CD8+ T-lymphocytes, CD4+ T-lymphocytes, CD68+ monocytes/macrophages and NE. The current authors also performed in situ hybridisation to detect mRNA for TNF-α and interleukin (IL)-8. The commercially available antibodies used for the study were NE (Dako M0725; Dako, Ely, UK), CD68+ (for monocytes/macrophages, Dako M0876), CD8+ (Dako M7103) and OPD4 (primed CD4+ T-cells, Dako 0834). For in situ hybridisation, the sizes (base pairs (bp)), vectors and sources of the probes were as follows: IL-8 (246 bp: PGEM 3Z; Glaxo-Wellcome Biomedical, Geneva, Switzerland), TNF-α (500 bp: PGEM 3Z; R&D systems, Abingdon, UK). The mean subepithelial area per section was 0.69 mm2 and the mean RBM length was 3.84 mm.
Bronchial biopsy quantification
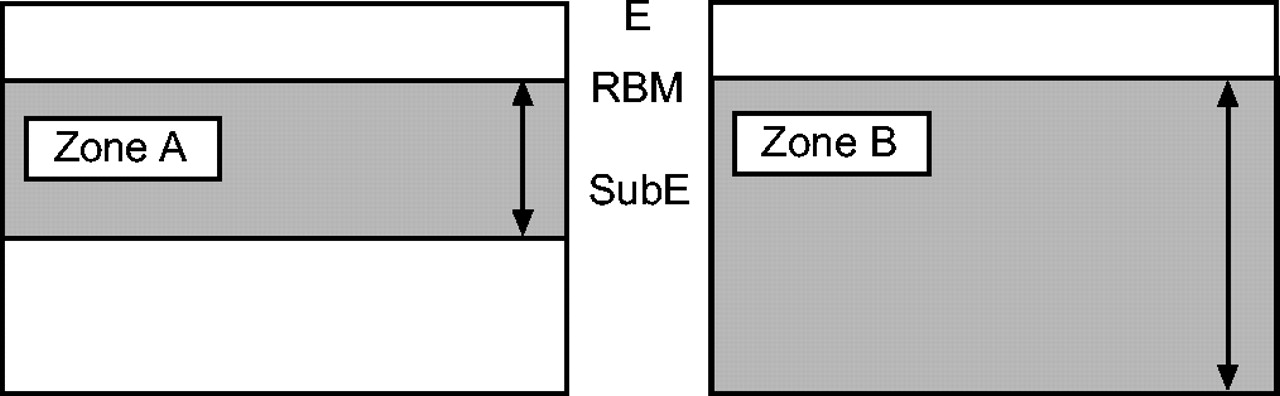
All processes and quantifications were carried out in the central laboratory (Lung Pathology, Royal Brompton Hospital, London, UK). Slides were coded to avoid observer bias. RBM length, epithelial length and areas of subepithelium, excluding muscle and gland, were assessed using a computer and an image software program. Cells immunopositive for NE, CD8+, CD4+ and CD68+ and those mRNA+ for IL-8 and TNF-α were counted using a light microscope at ×200 magnification. In order to reduce the influence of differing cell size, only immunostained cells with a visible nucleus in the plane of section were counted. The mean cell counts·mm−2 subepithelium for each marker, for the baseline biopsies, were as follows: NE 49.8; CD8+ 327.6; CD68+ 61.0; CD4+ 159.1; IL-8 41.9; and TNF-α 318.0. To test the consistency of quantification and the inherent variation of repeated counts, one section was selected and counted four times over the period of the study. The coefficient of variation for repeat counts of subepithelial NE+ cells by the same observer was 2.7%. To test the consistency of quantification between two different observers, 10% of all NE-stained sections were randomly selected and counted by two observers. The inter-observer coefficient of variation for counts of subepithelial NE+ cells was 3.2%. The within-tissue section zones were defined using a light microscope eyepiece graticule as the first 100 μm below the epithelial RBM compared with the entire subepithelium inclusive of the first 100-μm, two strategies often reported (fig. 2⇓).

Zone A illustrates the area of tissue 100-μm deep from the reticular basement membrane (RBM) and zone B illustrates all the available subepithelial tissue. E: epithelium; SubE: subepithelium.
Statistical analysis
The cell count data in the present study have been organised in a hierarchical fashion (fig. 1⇑); e.g. zone is nested within section, section within biopsy and biopsy within airway. The current authors rejected the statistical methods often used, which assume an independent data structure. Failure to take into account such a hierarchical structure in the analysis can generate misleading results 14, as cell counts may be clustered within the same airway, biopsy, section or zone. For example, Sont et al. 12, found very large intra-class correlations within-section and between-biopsy; these have important implications for the sample size calculations. Instead the current authors analysed the data from a multilevel model 14. For each cell type, the statistical analysis was carried out in three steps. 1) A natural log transformation was performed to normalise the cell count. “1” was added to the original cell counts to avoid zero counts and a unified statistical method was applied for both the decomposition of variability and the sample size calculation. 2) The current authors also established and validated the recommended multilevel statistical model and estimated its parameters 14. As the data used contained only cell counts at baseline and post-treatment from the placebo group, a simple variance component multilevel model was used, dividing the total variance into different sources (e.g. between-patient variation, variation between airway generations). This enabled the current authors to assess the relative contribution to the total variance of each source. The statistical model was estimated through a SAS PROC MIXED procedure 15. 3) Finally, based on the estimated variance component multilevel model, sample size calculations were performed. It was assumed that the minimally clinically meaningful difference in cell count is one doubling or halving in cell numbers. The sample size calculation was performed for a two-arm parallel design and a one-arm cohort design with α = 0.05 (two-sided) and β = 0.20 (power = 1–β = 0.80). The sample size calculation for a multilevel model is described elsewhere 16. The sample size formula can be expressed as:  where Zα/2 = Z0.05/2 = 1.96, Z1–β = Z1–0.20 = 0.84, δ = log(2) = 0.693, β1 stands for the treatment effect and var(β1) stands for the variance of β1 and is calculated by the following formula 16:
  where n1, n2, n3, n4, n5 and n6 are the numbers of visits, zones, sections, biopsies, airways and patients required per treatment group, varlevel1, varlevel2, varlevel3, varlevel4, varlevel5, and varlevel6 are the variance at level 1 (time or residual), level 2 (zone), level 3 (section), level 4 (biopsy), level 5 (airways) and level 6 (patients).
For a two-way parallel design, to calculate the number of subjects (n6) per group with varying number of a particular level (such as airway), the number of repetition at other levels (i.e. biopsy, section, zone and time) will be kept at 1. For a within-group design, the number of subjects is determined by setting the number of repetitions at biopsy, section and zone levels as 1 but at time level as 2. Spearman correlations and the Willcoxon signed-rank test were used to compare cell counts from the two subepithelial zones.
RESULTS
Subjects
Bronchial biopsies from 51 subjects were included in this analysis. Patients had COPD (mean FEV1 55% pred) with mean reversibility after salbutamol of 7.3%, indicating the high degree of fixed airflow obstruction that characterises this condition. A total of 59% of patients were current smokers, the remainder were ex-smokers and 82% had symptoms of chronic bronchitis. Demographic and lung function data are shown in table 1⇑.
Table 2⇓ displays the variance component estimate for counts of six immunophenotypes of inflammatory cell at different hierarchical levels. For example, for CD8+ cells, the variance was 0.49 (34%) for between-patient variation, 0.33 (23%) for between-airway within-patient variation, 0.04 (2%) for between-biopsy within-airway variation, 0.01 (0.4%) for between-section within-biopsy variation, 0.02 (1.4%) for between-zone within-section variation and 0.55 (39%) for variation over time. Figure 3⇓ illustrates the components of intra-subject variability for CD8+ T-cells. The percentages indicate the proportion of the overall variation contributed by each factor. The distribution of variance, contributed by different sources, was similar for different types of cells.

The components of intra-subject variability for CD8+ T-cells. □: patient; ░: airway; ▒: biopsy; ▪: section; ░: zone;  : time.
Variance components for various cell counts at different levels
The largest source of variance for CD8+, CD68+, NE+, IL8+ and TNF-α cell counts was time (i.e. the 10 weeks between biopsy occasions for the placebo group), followed by the between-patient variance. For CD4+ cells only, between-patient variance was slightly greater than variance with time. The next largest contribution to cell count variation was that which occurred between generations of airway. Variance between biopsies, sections and zones within a section contribute relatively little to the overall total.
Tables 3⇓, 4⇓ and 5⇓ provide the sample sizes required for a two-way parallel design and one-arm cohort design for various cell types, for different numbers of airways, biopsies and sections, respectively. In the case of a study of parallel design, the sample size indicated is the number of subjects required per treatment arm to show a doubling or halving difference in cell numbers between groups. The results for the effects on sample size afforded by sampling biopsies from two distinct airway generations (table 3⇓) indicate that there are substantial differences for each inflammatory cell type depending on whether one or two airway generations are sampled. Taking CD8+ as an example, if two airway generations are sampled, 32 subjects per treatment group would be required in a study of parallel design and 14 subjects for a within-group design. In contrast, 47 and 19 subjects, respectively, would be needed if only one airway generation is sampled. Differences in the required sample sizes on the basis of sampling one or two airway generations are also shown for other cell types. Tables 4⇓ and 5⇓ also show differences in the sample size for different numbers of biopsies and sections, but the differences for these hierarchical levels are less marked when compared with those between different airway generations. The data shown in tables 3⇓, 4⇓ and 5⇓ reveal that the sampling strategy that best reduces the sample size, required for both parallel study design and within-group study design, is to increase the number of airway generations sampled. This result holds true for counts of each of the six cell types included in the present analysis.
Sample size for various cell counts by different number of airways#
Sample size for various cell counts by different number of biopsies#
Sample size for various cell counts by different number of sections#
Geometric mean cell counts and correlation coefficients together with their relevant inferential statistics from the comparison between zones within a section are shown in table 6⇓. The mean area of tissue examined for a single marker was 0.80 mm2 for the “entire” section method and 0.35 mm2 for the method in which subepithelial tissue to a depth of 100 μm was sampled. The cell count per unit area was consistently and significantly higher for the 100-μm depth method (p<0.05). Although the absolute cell counts differed between the two methods, as anticipated, they were correlated strongly (all the p-values for zero correction test were <0.001).
Geometric mean cell counts and correlation coefficients together with their relevant inferential statistics from the comparison between zones within a section
DISCUSSION
The current authors have shown that there is substantial variability in area profile counts of endobronchial biopsy inflammatory cells, between and within subjects with COPD and with time. The data indicate that for “hypothesis testing” using such counts, the data obtained from one biopsy taken from each of two airway generations, from each subject, should be examined in order to maximise statistical power to detect difference(s) between study groups.
The finding of substantial variation in cell counts between subjects with the same disease is to be expected as COPD is recognised as a heterogeneous condition where numerous intrinsic and external factors (e.g. tobacco smoke, current smoking status, environmental pollutants, differences in treatment) are likely to influence infiltration of the bronchial mucosa by inflammatory cells 17. In the present study, it appeared that time was the largest contributor to intra-subject variability followed by airway generation. The variability due to time is consistent with the findings of Richmond et al. 11, who have shown a large intra-subject variation with time in subjects with asthma using biopsies performed 4 weeks apart. However, the current study included post-treatment subjects from the placebo arm of a randomised controlled trial 9, and it is possible that a placebo effect for this group contributed to the apparently large contribution of time to the variance. Yet the current authors found no significant differences between the values for inflammatory cells pre- and post-placebo treatment 9. The variability described with airway generation may be influenced by differences in deposition patterns of inhaled pollutants in airways of differing calibre. Despite the magnitude of the variability and the previously described trend towards greater numbers of neutrophils in the more proximal (lobar) airways, no statistically significant differences in counts of inflammatory cells between lobar and subsegmental airways were found 3. Moreover, in asthmatics (n = 10), the study by Richmond et al. 11 found no systematic or statistically significant differences in respect of counts of T-lymphocytes, T-lymphocyte subsets and eosinophils made between upper and lower lung lobes.
The current authors' previously reported study of CD8+ lymphocyte numbers located around the internal perimeter of intact airways in smokers with COPD indicated that subepithelial tissue associated with a minimum of 5 mm of RBM should be evaluated in order to obtain an adequate sample to estimate their number reliably 18. Similarly, Sullivan et al. 19 recommended the examination of a zone of tissue beneath at least 5–10 mm of RBM for inflammatory cell counts in both COPD and asthma subjects. This recommendation was in contrast to ten Hacken et al. 20, who found that submucosa 1.0×0.1mm in size was sufficient to obtain relatively constant cell numbers.
The data reported herein for COPD demonstrate that there is improvement in the power to detect a between-group difference (of a halving or doubling in cell numbers) by sampling biopsies taken from more than one airway generation. Moreover, there is little further to be gained by analysing more than one biopsy from the same airway generation or from counting more than one tissue section from each biopsy. For biopsies of the overall average size used in the present study, one biopsy from each of two airway levels (lobar and subsegmental) would include subepithelial tissue associated with 7.7 mm RBM, or a subepithelial area of 1.4 mm2. It was notable that the number of subjects required per group to show a difference in neutrophils or IL-8 mRNA+ cells was much larger than for other cells. These cells had the highest variability, a consideration when planning future studies in which neutrophils are an endpoint. The present study used a multilevel analysis in order to take account of the hierarchical nature of the data and to assess the contribution of several sources of variance. However, testing for differences in summary measures, cell counts weighted by area, between groups or time points remains a simple and valid analysis for future biopsy studies where hierarchical analysis is not required.
The current authors also noted a marked tendency for inflammatory cells to accumulate in a subepithelial zone immediately adjacent to the epithelial RBM, confirmed by the consistently higher cell density for this zone by comparison with the entire subepithelium. This might be predicted, as the former samples a zone with a constant border determined by the investigator as the first 100 μm below the RBM, whereas the latter samples an area that is highly variable and dependent on biopsy size and sample adequacy. The subepithelial area is the denominator for the calculation of cell density and its varying size will markedly affect the final calculated figure. The current authors' findings and conclusions for the cell types have been analysed in bronchi and for the relatively superficial sample of airway mucosa obtained by endobronchial biopsy, which may not apply for small airways, where the completeness of the resected airways allows examination of the entire airway wall. In these, accumulations of lymphocytes, in the form of bronchus-associated lymphoid tissue (BALT) have been recently described deeper in the airway wall 5. The current authors have also shown, in resected bronchi, that there is increased and preferential accumulation of plasma cells associated with IL-4 positive cells in and around the submucosal mucus-secreting glands of smokers with bronchitis as compared with asymptomatic smokers 21, 22. These studies emphasise the selected compartmentalisation of inflammatory cells that exists within the airway wall. Such nonrandom distribution and compartmentalisation of airway wall inflammatory cells will probably depend on a variety of factors, including the local production of chemoattractants and pro-inflammatory mediators such as CXCL5 and CXCL8 (i.e. epithelial-derived activator-78 and IL-8) and TNF-α, shown to be increased in smokers with COPD 23, 24.
In conclusion, the current data of area profile counts entirely support the recommendations and paradigm of Gunderson and Osterby 25, to “do more less well”, though the current authors would prefer to use the phrase “sample more in less detail” in order to avoid the idea that this strategy necessarily requires more work, which it does not, or that anything is performed to a lower standard of quality. Other methods of quantification, such as stereological and automated methods 26, need to be similarly validated, as each method offers its own advantages and disadvantages to the investigator. The current study's findings indicate that to improve the informative value of the data in order to either increase statistical power or reduce the required number of subjects without loss of statistical power to detect a given difference, the highest order of priority is to obtain biopsies from more than one airway generation. The requirement to study several biopsies from a single airway generation, or to count, for any particular parameter, several sections from each biopsy is of considerably lower priority, albeit in the case of cells of very low frequency or cell clusters, such as may occur in asthma with eosinophils, where more than one section or biopsy may well be required. In all cases, validated techniques of counting should be applied in which the errors of repeated measurement by single and between-observers should also be reported.
The current authors hope that the present evaluation of intra-subject variability and predicted optimised sampling, with respect to area profile counts, will help to improve, for researchers, study design, statistical power, interpretation and the ultimate usefulness of their bronchial biopsy inflammatory cell data in the future.
Footnotes
-
For editorial comments see page 248.
- Received March 9, 2005.
- Accepted October 21, 2005.
- © ERS Journals Ltd
References


