Increasing antituberculosis drug resistance in the United Kingdom: analysis of national surveillance data
BMJ 2008; 336 doi: https://doi.org/10.1136/bmj.39546.573067.25 (Published 29 May 2008) Cite this as: BMJ 2008;336:1231
- Michelle E Kruijshaar, senior scientist1,
- John M Watson, director1,
- Francis Drobniewski, director and consultant medical microbiologist2,
- Charlotte Anderson, scientist1,
- Timothy J Brown, clinical scientist2,
- John G Magee, director3,
- E Grace Smith, director4,
- Alistair Story, tuberculosis nurse specialist1,
- Ibrahim Abubakar, consultant epidemiologist and head of tuberculosis section15
- 1Respiratory Diseases Department, Centre for Infections, Health Protection Agency, London NW9 5EQ
- 2Mycobacterium Reference Unit, Barts and the London, Queen Mary’s School of Medicine and Dentistry, London E1 2AT
- 3Regional Centre for Mycobacteriology, Health Protection Agency North East, Newcastle General Hospital, Newcastle upon Tyne NE4 6BE
- 4Regional Centre for Mycobacteriology, Health Protection Agency, Heart of England NHS Foundation Trust, Birmingham B9 5SS
- 5School of Medicine, Health Policy and Practice, University of East Anglia, Norwich NR4 7TJ
- Correspondence to: M E Kruijshaar michelle.kruijshaar{at}hpa.org.uk
- Accepted 26 March 2008
Abstract
Objective To identify recent trends in, and factors associated with, resistance to antituberculosis drugs in England, Wales, and Northern Ireland.
Design Cohort of tuberculosis cases reported to the enhanced tuberculosis surveillance system matched to data on drug susceptibility and national strain typing data.
Setting England, Wales, and Northern Ireland 1998-2005.
Main outcome measures Unadjusted and adjusted odds ratios for drug resistance and associated factors. Proportion of multidrug resistant tuberculosis cases clustered.
Results 28 620 culture confirmed cases were available for analysis. The proportion of cases resistant to isoniazid increased from 5% to 7%. Rifampicin resistance increased from 1.0% to 1.2% and multidrug resistance from 0.8% to 0.9%. Ethambutol and pyrazinamide resistance remained stable at around 0.4% and 0.6%, respectively. Regression analyses showed a significant increase in isoniazid resistance outside London (odds ratio 1.04, 95% confidence interval 1.01 to 1.07, a year, associated with changes in age (0.98, 0.98 to 0.99, a year), place of birth (1.49, 1.16 to 1.92), and ethnicity (P<0.05). In London, the rise (1.05, 1.02 to 1.08, a year) was related mainly to an ongoing outbreak. Increases in rifampicin resistance (1.06, 1.01 to 1.11, a year) and multidrug resistance (1.06, 1.00 to 1.12, a year) were small. A fifth of patients with multidrug resistant tuberculosis in 2004-5 had indistinguishable strain types, and one case was identified as extensively drug resistant.
Conclusions The rise in isoniazid resistance reflects increasing numbers of patients from sub-Saharan Africa and the Indian subcontinent, who might have acquired resistance abroad, and inadequate control of transmission in London. The observed increases highlight the need for early case detection, rapid testing of susceptibility to drugs, and improved treatment completion.
Introduction
Since 1987 the incidence of tuberculosis in England, Wales, and Northern Ireland has increased significantly, with more than 8000 cases reported in 2006.1 Resistance to antituberculosis drugs is increasing globally,2 and transmission of drug resistant tuberculosis has been shown among marginalised groups in urban areas, such as London.3 These factors may contribute to the prevalence and transmission of drug resistant strains in the United Kingdom and potentially hamper tuberculosis control.
Data on drug susceptibility have been routinely collected in the UK since 1993. Drug resistance, including multidrug resistance, remained stable from 1993 to 1999.4 5 We examined recent trends in resistance to antituberculosis drugs among cases reported in England, Wales, and Northern Ireland from 1998 to 2005 and investigated factors associated with resistance.
Methods
Data on drug susceptibility for initial isolates were available from the UK Mycobacterial Surveillance Network (MycobNet), which collates information from all UK mycobacterial reference laboratories on first isolates identified as Mycobacterium tuberculosis complex within a 12 month period. Drug susceptibility testing was performed with the resistance ratio or the proportion method.6 Reports resulting from laboratory cross contamination are removed from the database. To improve the demographic and clinical information available, we matched MycobNet records to the national enhanced tuberculosis surveillance database.1 This database provides information on tuberculosis cases reported in England and Wales since 1998 and in Northern Ireland since 2000 but does not include data from Scotland. Detailed information on data collection methods since 1999, the 1998 national tuberculosis survey, and MycobNet, has been reported previously.4 7 8 9
Tuberculosis cases were either confirmed by culture to be caused by M tuberculosis complex or met the following criteria: a clinician’s judgment that the patient’s clinical or radiological signs are compatible with tuberculosis and clinician’s decision to treat the patient with a full course of antituberculosis treatment. In the UK first line antituberculosis drugs are isoniazid, rifampicin, pyrazinamide, and ethambutol (or more rarely streptomycin).10 Multidrug resistant tuberculosis is defined as resistance to at least isoniazid and rifampicin and extensively drug resistant tuberculosis as resistance to at least rifampicin, isoniazid, a fluoroquinolone, and one of three injectable second line drugs (amikacin, kanamycin, capreomycin).11 All analyses were performed among M tuberculosis complex isolates that were matched to the surveillance database and had results on drug susceptibility for at least isoniazid and rifampicin. As most M bovis isolates are resistant to pyrazinamide, we excluded these from analyses of pyrazinamide resistance.
We inspected trends in resistance to first line drugs from 1998 to 2005 and tested significance of odds ratios for a linear trend using univariable and multivariable logistic regression modelling (SPSS version 14.0). Multivariable models adjusted for age, sex, place of birth (born in the UK or elsewhere), ethnic group (white, black Caribbean, black African, black other, Indian/Pakistani/Bangladeshi, Chinese, other including mixed), region (London versus outside London), and previous diagnosis, factors previously reported to be associated with resistance.12 13 14 We also included site of disease (pulmonary with or without extrapulmonary versus extrapulmonary disease only) to explore potential effects on transmission. As we were aware of an outbreak of isoniazid monoresistance in London, with limited evidence of transmission outside London, we stratified analyses for isoniazid resistance by region.2 Interactions between previous diagnosis, region, place of birth, and ethnic group were investigated and multiple interactions of P<0.01 supported stratification of the analyses for isoniazid resistance by region of reporting.
To identify trends in second line drug resistance and cases of extensively drug resistant tuberculosis, we undertook a review of second line drugs for cases of multidrug resistant tuberculosis for 2002-5. Strain typing information based on 15 loci variable number tandem repeats (MIRU-VNTR), performed as described previously,15 16 was collated for multidrug resistant cases reported in 2004-5, entered into BioNumerics version 4.5 (Applied Maths, St-Martin-Latem, Belgium),17 and analysed by use of the categorical coefficient to assess recent transmission. The proportion clustered was calculated with the n−1 method.18
Results
From 1998 to 2005, 34 555 initial isolates were identified as M tuberculosis complex and 53 602 cases of tuberculosis were reported to the national surveillance system. Matching of the two databases resulted in 28 620 culture confirmed cases (82.8% of initial isolates; 53.4% of case reports). Results of drug susceptibility testing for isoniazid and rifampicin were available for 28 485 cases (99.5% of culture confirmed cases), and we included these in our analyses.
Table 1⇓ shows the characteristics of culture confirmed cases with results on drug susceptibility compared with non-culture confirmed cases. The median age of these patients was 35 (interquartile range 26-54); 57% were male (16 164); 69% (17 522) were born outside the UK, 24% of whom entered less than two years before diagnosis; 8% (1889) had had a previous diagnosis of tuberculosis; and 42% (11 851) of cases were reported from London. Similar proportions were seen among non-culture confirmed cases. Patients with culture confirmed tuberculosis more often had pulmonary disease (67% v 50% of all other cases) and more often had positive results on sputum smear tests (61% v 26%). The proportion of patients who were culture confirmed remained stable at about 55% over the study period.
Characteristics of patients with culture confirmed tuberculosis with results on drug susceptibility for isoniazid and rifampicin and all other reported tuberculosis patients. Figures are numbers* (percentages) of patients, unless stated otherwise
Trends in first line drug resistance
Figure 1⇓ and table 2⇓ show the proportion of cases resistant to each first line drug, any first line drug, and those with multidrug resistant tuberculosis by year. From 1998 to 2005 the percentage of cases resistant to any first line drug increased from 5.6% to 7.5% (with a peak of 7.9% in 2004). Isoniazid resistance increased from 5.0% to 7.2% in 2003 and remained stable thereafter. Multidrug resistance and rifampicin resistance increased from 0.8% to 0.9% and 1.0% to 1.2%, respectively. Resistance to pyrazinamide and ethambutol was low and no increases were noted. No further analysis was undertaken for these two drugs.

Fig 1 Proportion of tuberculosis cases confirmed by culture (with test results for both isoniazid and rifampicin) resistant to first line drugs, multidrug resistant, and resistant to any first line drug by year, and significance of trend over time
Number (percentage) of culture confirmed tuberculosis cases with first line drug resistance, multidrug resistance, and any first line drug resistance by year, 1998-2005
There was a significant linear trend of increasing isoniazid resistance apparent in univariable analyses, inside and outside London (1.05, 95% confidence interval 1.02 to 1.08, and 1.04, 1.01 to 1.07, respectively, table 3)⇓. Levels of multidrug resistance and rifampicin resistance also showed a significant linear trend over the period (1.06, 1.00 to 1.12, and 1.06, 1.01 to 1.11, respectively, table 4)⇓.
Odds ratios (95% confidence interval) for isoniazid resistant tuberculosis in England, Wales, and Northern Ireland, 1998-2005, stratified by region of reporting
Odds ratios (95% confidence interval) for rifampicin and multidrug resistant tuberculosis in England, Wales, and Northern Ireland, 1998-2005
Factors associated with trend
On multivariable analysis, the increase in isoniazid resistance outside London and the increases in rifampicin resistance and multidrug resistance were no longer significant. In London, the rise in isoniazid resistance remained significant (1.04, 1.0 to 1.1). Specifically, adjustment for ethnicity, place of birth, or age each resulted in the rise in isoniazid resistance outside London no longer being significant (P for year=0.19, 0.15, and 0.11, respectively). For multidrug resistance adjustment for previous diagnosis also had this effect (P for year=0.14). Figure 2⇓ shows the levels of drug resistance by year after adjustment for these four variables and shows that nationally the increase in isoniazid resistance remained significant, while the increases in rifampicin resistance and multidrug resistance were no longer significant.
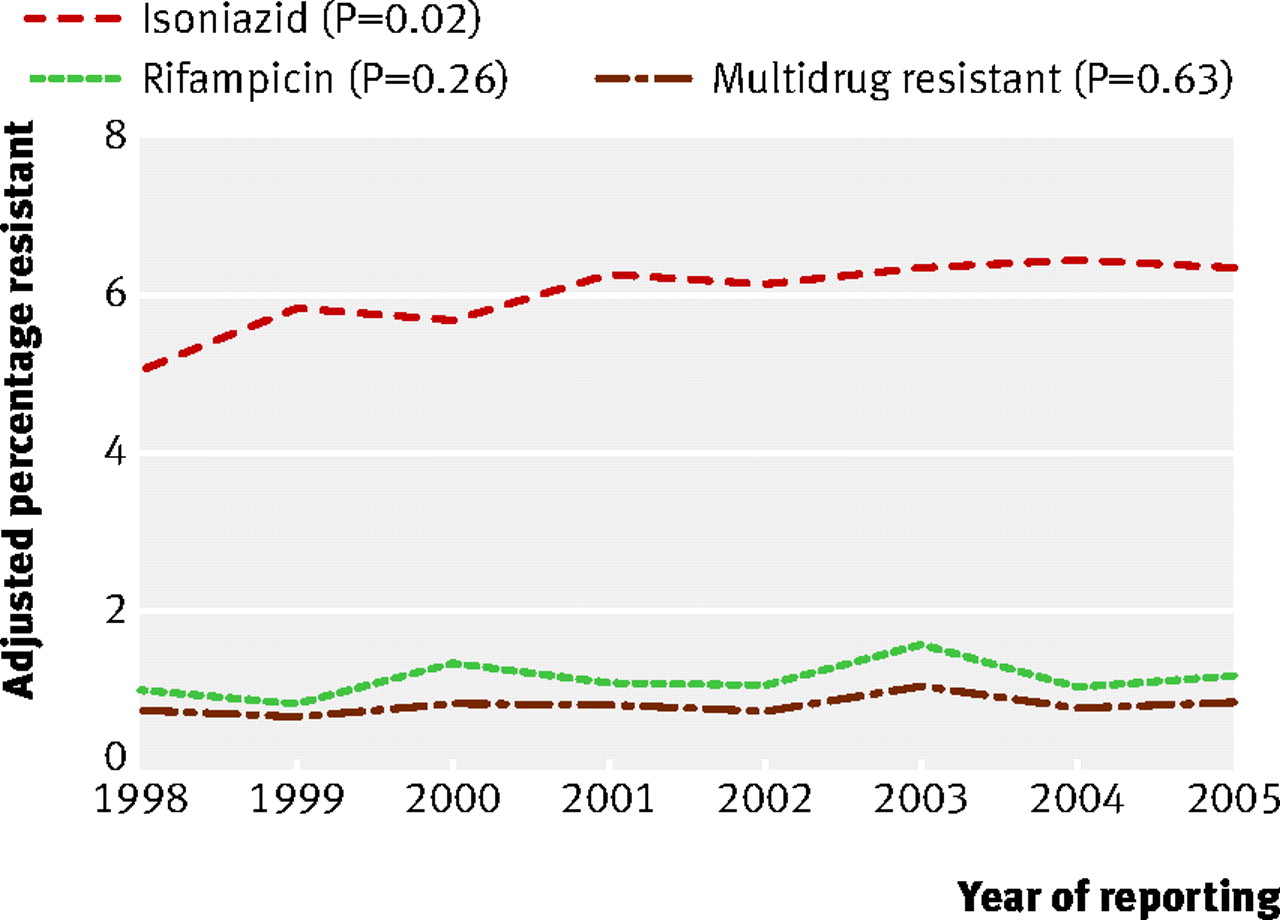
Fig 2 Proportions of isoniazid, rifampicin, and multidrug resistance adjusted for age, place of birth, ethnic group, and previous diagnosis by year and significance of trend over time
In all models, younger age was significantly associated with resistance, while sex was not (tables 3 and 4).⇑ ⇑ Patients born outside the UK had a higher risk of drug resistance, including isoniazid resistance outside London, but a lower risk of isoniazid resistance in London. Compared with the white ethnic group, the risk of isoniazid resistance was significantly higher in black Caribbean patients in London (2.9, 2.1 to 4.1). Outside London, and for rifampicin resistance and multidrug resistance, the risk was higher in the black African, black other, Indian-Pakistani-Bangladeshi, and the Chinese ethnic groups (tables 3 and 4).⇑ ⇑
Patients with a previous diagnosis of tuberculosis were significantly more likely to be resistant in all models (tables 3 and 4).⇑ ⇑ Those with pulmonary disease were significantly more likely to be rifampicin resistant.
Resistance to second and third line drugs among cases of multidrug resistant tuberculosis
Information on susceptibility to second and third line drugs was available for 99% of multidrug resistant cases reported in 2002-5. Because of the small numbers, it is difficult to assess trends in second line drug resistance. Resistance to second and third line drugs was low, with the exception of resistance to para-aminosalicylic acid (14%) and ethionamide (9%) (data available from authors). In 2003 one patient with no history of tuberculosis was found to have extensively drug resistant tuberculosis.
Molecular clusters of multidrug resistant tuberculosis
We had information on strain typing for 82% (66/81) of multidrug resistant cases reported in 2004-5. Six clusters of indistinguishable MIRU-VNTR patterns were identified. The proportion clustered, calculated with the n−1 method, was 19.7%. A cluster of six patients (Beijing strain), five of whom lived in the same area/city, was known to be an outbreak. All were from ethnic minority groups but included people born within and outside the UK. Four MDR-TB cases (LAM10 CAM) were part of the outbreak of isoniazid mono-resistance originating in north London2 but might have acquired rifampicin resistance additionally as a result of poor compliance.19 Another cluster of three or four cases (CAS1 Delhi) was less likely to be caused by transmission within the UK, with two patients having arrived in the UK from Asia in the previous five years, and with no known epidemiological link within the UK. The remaining three clusters were of two cases each, one likely to be caused by household transmission (LAM9).
Discussion
The proportion of cases of tuberculosis resistant to isoniazid has increased during 1998-2005 in England, Wales, and Northern Ireland. This rise reflects the increasing proportion of patients with tuberculosis who are not born in the UK and who are from certain ethnic minority groups, as well as inadequate control of transmission in London. Levels of multidrug resistance and rifampicin resistance also showed a small increase. Levels of multidrug resistance in the UK are similar to those in other Western European countries.20
Strengths and limitations
In London, the prevalence of tuberculosis is high among homeless people and problem drug users, who are often infectious, difficult to treat, and have drug resistant disease.21 Such cases might be disproportionately under-represented in surveillance data, which might lead to an underestimate of the proportion of, and increase in, drug resistance in London. Another limitation of this study is the inability to adjust for the effects of some risk factors, such as coinfection with HIV or deprivation, on the observed trends in drug resistance. As in other observational studies, we cannot exclude the effect of residual confounding related to factors in the model. Although the numbers of resistant cases were not large, potentially obscuring significant effects, the consistency of the results strengthens the conclusions. Stratification of the analysis for isoniazid resistance also affects statistical power but was deemed necessary because of a priori knowledge of the isoniazid resistant outbreak in north London.2
We needed to match two databases to combine data on drug susceptibility with demographic and clinical data. As the variables used for record linkage might be incomplete or incorrect in either database, we cannot exclude some inaccurate matches. As we used the same matching algorithm over the time period studied, however, it is unlikely that such errors would affect the trends observed. Data on drug resistance were not available for 46% of reported cases (most of these cases were not culture confirmed), allowing scope for bias. Nevertheless, this is attenuated by the fact that this proportion remained stable over the study period and that excluded patients were similar in terms of age, place of birth, and ethnic group, which were associated with both drug resistance and year of reporting.
Explanations for increases in drug resistance
The increase in isoniazid resistance outside London was related to increasing numbers of patients born outside the UK and also to changes in ethnic group and age. We found a strong association between drug resistance and the Chinese ethnic group. Antituberculosis drug resistance is particularly high and increasing in some provinces of China and in countries of the former Soviet Union.22 23 Additional analyses, however, showed that few patients with drug resistant tuberculosis came from these regions (1.3% and 0.5% with any first line drug resistance, respectively) nor from the Eastern European countries that have recently joined the European Union (0.4%). The increase in isoniazid resistance is probably related to increasing numbers of patients with drug resistant tuberculosis from sub-Saharan Africa and the Indian subcontinent. The increase in cases from these parts of the world reflects, at least in part, a general change in the UK population resulting from ongoing migration.
In London, the trend cannot be explained by changing demographic characteristics of patients and is probably related to a major outbreak of isoniazid monoresistant tuberculosis, first noted in 1999.1 2 Additional analysis of the effect of the outbreak on the trend in London confirmed this relation (including membership of the outbreak into the multivariable model resulted in a non-significant odds ratio for year of 1.01, 0.97 to 1.05). The same analysis also suggested that this outbreak, which includes mainly white and black Caribbean people born in the UK, accounts for the higher risk of isoniazid resistance in patients born in the UK and living in London. The outbreak is associated with imprisonment and drug misuse. More than 300 cases have been identified to date as part of this outbreak, mainly in north London. The outbreak is still continuing, suggesting that control measures are insufficient. Clinicians within London, including general practitioners, should be more aware in UK born people presenting with symptoms consistent with tuberculosis and refer them promptly. When appropriate, clinical services should also provide additional support to ensure that patients complete treatment.
Rifampicin resistance and multidrug resistance also increased as a result of changes in demographic characteristics and as well as clinical characteristics of patients. Nevertheless, the overall increase was small: rifampicin resistance rose from 1.0% in 1998 to 1.2% in 2005 and multidrug resistance from 0.8% to 0.9%. Furthermore the reported level of multidrug resistance in 1993-9 was higher (1.2%).4 Although this change might not be substantial, further measures are warranted to prevent a sustained increase.
Transmission and management of multidrug resistant tuberculosis
The proportion of multidrug resistant cases resistant to second and third line drugs was also low, with only one case of extensively drug resistant tuberculosis identified. The low proportion could suggest that such patients are being managed effectively, preventing the emergence of further resistance. Because of the small numbers of cases tested, however, we could not assess whether levels have increased over time.
Most cases of multidrug resistant tuberculosis are not caused by recent transmission in the UK. Among the 66 patients with strain typing information, 19 were part of six clusters of identical MIRU-VNTR patterns. After allowance for one potential source case in each cluster, the estimated proportion of cases clustered was 20%, suggesting that transmission of multidrug resistant tuberculosis within the UK is limited. Cases that arise de novo, rather than as a result of recent transmission, suggest that failures in management of patients in the UK are contributing to the occurrence of multidrug resistance.
Conclusions
The increase in isoniazid resistance underlines the importance of using the recommended four drug course in the initial treatment phase for patients with tuberculosis10 and of implementing measures to control the isoniazid resistant outbreak in London. The small increases in multidrug resistance and rifampicin resistance suggest a potential trend, which needs to be monitored. Increased awareness, early case detection, rapid drug susceptibility testing, completion of treatment, continuous surveillance, and a contribution to control of tuberculosis in high incidence countries are needed to halt the observed trends.
What is already known on this topic
Antituberculosis drug resistance is increasing globally
Resistance to antituberculosis drugs in the UK remained stable between 1993 and 1999
Little information is available on potential transmission of multidrug resistant tuberculosis
What this study adds
From 1998 to 2005 the proportion of tuberculosis cases resistant to isoniazid increased in England
This increase was associated with increasing numbers of cases from sub-Saharan Africa and the Indian subcontinent, and inadequate control of transmission in London
Multidrug resistance increased only slightly and seems to be largely associated with problems in individual treatment, rather than transmission of infection
Footnotes
We thank all staff of the microbiology laboratories involved in culture and testing of cultures of M tuberculosis isolates for their work and all tuberculosis nurses, chest physicians, and regional coordinators who submitted data to the enhanced tuberculosis surveillance system. We also thank Pam Sonnenberg for her extensive comments on the manuscript and Nick Andrews for statistical advice.
Contributors: MEK participated in the study design, analysed the data, and wrote the manuscript. IA was extensively involved in the design of the study, interpretation of the results, and writing the manuscript and is guarantor. CA was responsible for the collation and maintenance of the data and advised on their interpretation. FD supervised the drug susceptibility testing of isolates and generation of data, was involved in study design and interpretation of results, and gave scientific and medical advice. TJB performed the review of second line drugs and cluster analysis and was involved in interpretation of the results. JGM and EGS supervised the drug susceptibility testing of isolates and generation of data and provided scientific advice. JMW initiated the study and contributed to the study design and drafting of the manuscript. AS was involved in the initiation of the study and interpretation of the results. All authors reviewed and approved the final report.
Funding: None.
Competing interest: None declared.
Ethical approval: This study was carried out with national surveillance data. The Health Protection Agency has Patient Information Advisory Group approval to hold and analyse national surveillance data for public health purposes under Section 60 of the Health and Social Care Act 2001.
Provenance and peer review: Not commissioned; externally peer reviewed.