Issues in the reporting of epidemiological studies: a survey of recent practice
BMJ 2004; 329 doi: https://doi.org/10.1136/bmj.38250.571088.55 (Published 14 October 2004) Cite this as: BMJ 2004;329:883
- Stuart J Pocock, professor (stuart.pocock{at}lshtm.ac.uk)⇑1,
- Timothy J Collier, lecturer1,
- Kimberley J Dandreo, epidemiologist2,
- Bianca L de Stavola, reader1,
- Marlene B Goldman, associate professor3,
- Leslie A Kalish, associate professor4,
- Linda E Kasten, senior biostatistician5,
- Valerie A McCormack, lecturer1
- 1 Department of Epidemiology and Population Health, London School of Hygiene and Tropical Medicine, London WC1E 7HT
- 2 New England Research Institutes, 9 Galen St, Watertown, MA 02472, USA,
- 3 Department of Obstetrics and Gynaecology, Harvard Medical School and Beth Israel Deaconess Medical Centre, Boston, MA 02215, USA
- 4 Clinical Research Program, Children's Hospital, Boston, MA 02115, USA
- 5 Prometrika LLC, Cambridge, MA 02138, USA
- Correspondence to: S Pocock
- Accepted 7 September 2004
Abstract
Objectives To review current practice in the analysis and reporting of epidemiological research and to identify limitations.
Design Examination of articles published in January 2001 that investigated associations between risk factors/exposure variables and disease events/measures in individuals.
Setting Eligible English language journals including all major epidemiological journals, all major general medical journals, and the two leading journals in cardiovascular disease and cancer.
Main outcome measure Each article was evaluated with a standard proforma.
Results We found 73 articles in observational epidemiology; most were either cohort or case-control studies. Most studies looked at cancer and cardiovascular disease, even after we excluded specialty journals. Quantitative exposure variables predominated, which were mostly analysed as ordered categories but with little consistency or explanation regarding choice of categories. Sample selection, participant refusal, and data quality received insufficient attention in many articles. Statistical analyses commonly used odds ratios (38 articles) and hazard/rate ratios (23), with some inconsistent use of terminology. Confidence intervals were reported in most studies (68), though use of P values was less common (38). Few articles explained their choice of confounding variables; many performed subgroup analyses claiming an effect modifier, though interaction tests were rare. Several investigated multiple associations between exposure and outcome, increasing the likelihood of false positive claims. There was evidence of publication bias.
Conclusions This survey raises concerns regarding inadequacies in the analysis and reporting of epidemiological publications in mainstream journals.
Introduction
Observational epidemiology generates a plethora of publications across numerous epidemiological and medical journals. Many texts tackle the quality of epidemiological studies,1–8 but few directly focus on epidemiological publications.9–14 We reviewed the quality and methodological acceptability of research epidemiology published in January 2001. We concentrated on analytical epidemiology—that is, studies that used observational data on people from the general population to quantify relations between exposures and disease.
Methods
We selected three types of English language journals: public, environmental, and occupational health journals15 with impact factor > 2, plus the International Journal of Epidemiology and the Journal of Epidemiology and Community Health to enhance international representation; general and internal medicine journals with impact factor > 2 and Circulation and the Journal of the National Cancer Institute, being the highest impact journals in cardiovascular disease and cancer. We then identified eligible articles published in January 2001. Eligible epidemiological articles analysed observational data in individuals to quantify associations between risk factors and disease outcomes. We excluded randomised controlled trials; observational studies of treatments; studies of people with disease, which do not relate to general population risk; and ecological studies, time trends, etc, that did not investigate individual associations.
For each article two authors independently completed a standard proforma, each author evaluating 25% of articles. Items were extracted using precoded boxes and open text fields (box). Minor inconsistencies were resolved by consensus, while a few disagreements were resolved via a third party.
Results
Journals and participants
We identified 73 eligible epidemiological articles in 20 journals: 54 were in epidemiology journals (table 1). North American and European populations were studied in 39 and 28 articles, respectively. Only six articles studied populations in developing countries. Authors and participants tended to be from the same country, with eight exceptions.
The 73 epidemiological publications in January 2001 by journal and country of participants
Study designs and outcomes
There were 37 cohort studies, 25 case-control studies, 10 cross sectional studies, and one case-cohort study (table 2). Twenty eight articles, mostly case-control studies, investigated cancers, and 16, mostly cohort studies, investigated cardiovascular disease. Even after we excluded the specialist cancer and cardiology journals, only 31% of articles studied other diseases. Most disease outcomes were binary: non-fatal events or deaths, or both. Seven articles investigated quantitative disease markers, and four studied multiple category outcomes (for example, disease severity).
Principal study outcomes by type of design in 73 epidemiological publications
Cohort studies varied in size from 317 to 1.5 million participants (median 5072), the largest studies using official databases. Most exceeded 10 years' follow up, though in two studies it was one year. Eight cohort studies gave no information on drop outs. Twenty four cohort study articles gave no information on refusals to participate, perhaps relying on earlier publications. Follow up entailed monitoring for disease outcomes (30 studies), planned visits (13 studies), and questionnaires (five studies). The number of principal outcome events ranged from 44 to 28 795 (median 414). Five studies had fewer than 100 events.
Case-control studies mostly used some matching of controls to cases (21 of 25 studies). Five were nested within a cohort study. Fifteen studies had more than one control per case. Cases were mostly from hospitals or clinics (11 studies) or population surveillance (eight studies). Controls were commonly from the general population (13 studies) or hospitals or clinics (seven studies). The number of cases varied from under 100 to over 8000 (median 347).
Cross sectional studies—Half of these selected random samples from the general population. Study size varied from under 100 to over 10 000 participants (median 1500).
The case-cohort study investigated alcohol consumption and bladder cancer, with 594 cases and a random subcohort of 3170 participants from a large total cohort.16
Exposure variables
Lifestyle and dietary factors received much attention (19 articles), most concerning cardiovascular outcomes (table 3). Eleven articles, mainly on cancer, looked at environmental exposures; 13 looked at biochemical and physiological markers. Nine articles looked at the influence of one disease on another (for example, diabetes and heart disease). Other variables examined were socioeconomic factors (six articles), fetal growth markers (six articles), and genetic markers (five articles).
Types of exposure variable investigated in 73 epidemiological publications
Information collected from eligible epidemiological publications
General
Country of participants
Country of authors
Type of study design
Outcomes and exposures
Main outcomes
Specialty (for example, cancer)
Type (for example, continuous, binary)
Main risk factors
Nature (for example, lifestyle, biochemical)
Type (for example, continuous, binary)
Whether categorised
Study design
Size of study
How participants were chosen
Information on refusals
Other details for cohort studies
Length of follow up
Losses to follow up
Other details for case-control studies
Case-control ratio
Whether matched
Whether nested
Types of statistical result
Estimate (for example, odds ratio, hazard ratio)
Whether confidence intervals were given
Whether P value was reported
P value for summary's first main result (if P value was not reported it was derived from the confidence interval or the data themselves)
Adjustment for potential confounders
Reported effect modifiers/subgroup analyses
Conclusions
Study's main conclusions
Study's deficiencies
Study's strengths
Fifty articles studied quantitative exposure variables. They were commonly grouped into several ordered categories (42 articles), with the number of categories and cut points justified in 22 articles. Nine articles reported one cut point—that is, two categories. Fifteen articles used linear associations to model effects of continuous exposure: only two reported checking for linearity. Some articles presented results in two ways—for example, 11 articles analysed exposures both as continuous variables and ordered categories. Binary (yes/no) exposures were reported in 34 articles, while 15 articles reported exposures naturally in several categories, 11 with evident ordering.
Confounders
In 67 articles (92%) statistical analyses were adjusted for potential confounders. The extent of adjustment varied enormously: the median number of variables was seven, and two studies adjusted for over 20 confounders. How confounders were chosen (that is, pre-declared, selected post hoc, or statistical algorithm) was mostly unclear. Eleven articles used stepwise regression to select variables for final analysis. Twenty one case-control studies matched on other factor(s), commonly matching on two or three variables. Five articles contained no control for confounders.
Statistical estimates and inferences
Odds ratios were estimated in 38 articles, including all case-control studies (table 4). Rate ratios or hazard ratios were estimated in 22 cohort studies. Methods included proportional hazard models, Poisson models, and person years analyses. Six cohort studies reported odds ratios: two were really rate ratios, two used pooled logistic regression for time updated variables,17 and two lacked event times.
Principal statistical estimates for associations between exposure and outcome in 73 epidemiological publications according to study design
All but five articles used confidence intervals; 35 articles contained no P values and only 15 gave P values for all primary results. Papers in the journal Epidemiology contained no P values, according to editorial policy at the time18 19 which has since changed.20 Two articles presented neither P values nor confidence intervals, while 10 articles gave both throughout.
The figure shows the distribution of P values for the first reported result in each article's abstract. P values were stated in 38 articles, derived from the confidence interval in 33, and calculated from the raw data in two. Ten articles had P > 0.05, and 23 articles had P < 0.0001. Twenty six articles had 0.01 < P < 0.05—that is, their first result achieved modest significance.
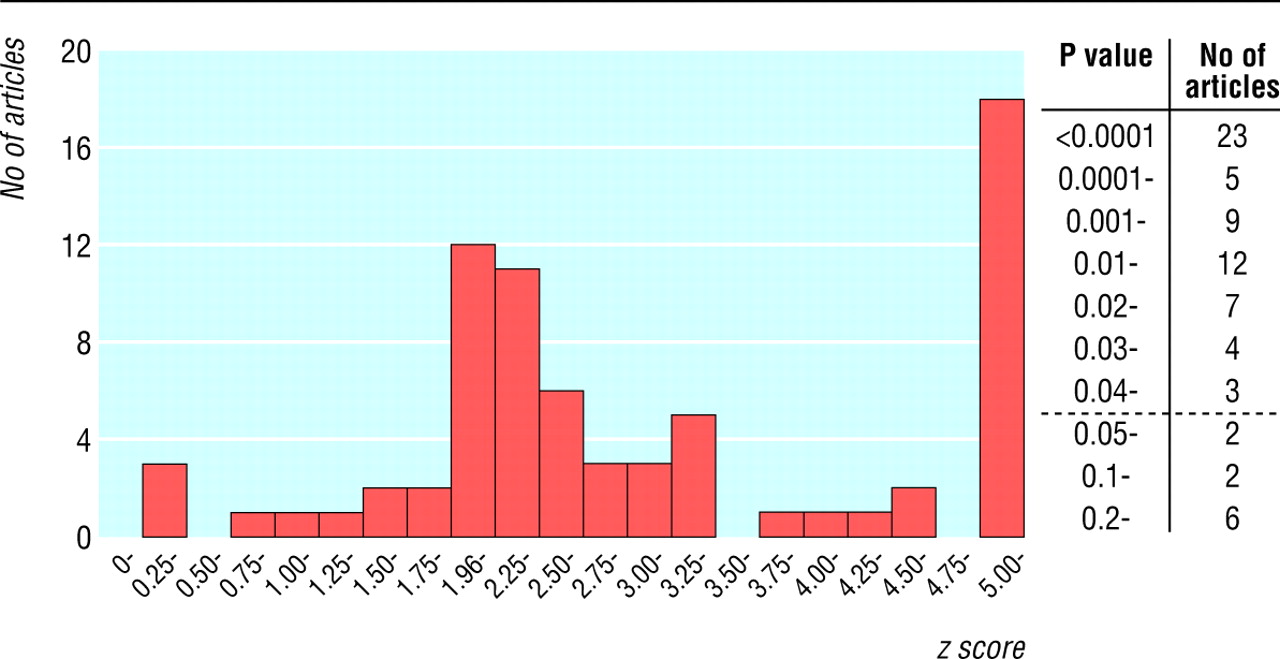
Distribution of P values for first primary result in each article and corresponding absolute values of standardised normal deviates z (two sided P=0.05, 0.01, 0.001, and 0.0001 correspond to z=1.96, 2.58, 3.29, and 3.89, respectively)
Effect modifiers
Forty three articles contained subgroup analyses, 34 of which claimed possible effect modification. Only eight articles gave statistical tests for interaction. In one paper the result of the interaction test was not significant but the authors still claimed a synergistic interaction.21
Multiple analyses
One problem is that some articles investigated many associations between exposure and outcome,22 which are often hard to interpret as few authors predefine all study hypotheses and many selectively report “interesting” associations. Ten articles each reported over 100 estimates of the effect of exposure and outcome (the highest was 264). Some articles selectively emphasised the most significant associations, inflating the risk of false positive results through multiple hypothesis testing.
Refusals
Thirty four studies (47%) gave no information on the number of participants who refused to participate.
Discussion
Our survey into the current state of epidemiological publications in high impact journals raises concerns regarding aspects of study design, analysis, and reporting that could lead to misleading results in some publications.
Our focus on high impact epidemiological and general medical journals has by design under-represented epidemiology in the many specialist medical journals. Our sample articles may be better quality as journals that publish only occasional epidemiological articles may be less discriminating.23
We focused on epidemiological studies in general populations. We excluded studies on clinical epidemiology in people with disease and studies in pharmacoepidemiology, although they raise similar issues. The quality of published randomised controlled trials24 25 and non-randomised intervention studies26 27 have been evaluated. The corresponding paucity of surveys into epidemiological studies motivated our work.
Types of study
We have confirmed that research on cancers and cardiovascular diseases dominates published epidemiology. The originality of some such efforts has been questioned,28 and epidemiological research is lacking in many other diseases. We found few articles concerned with developing countries, though they may be published in tropical medicine journals instead.
Cohort studies were common, especially regarding cardiovascular disease and all cause mortality. Major cohort studies produce many publications: our one month's survey unsurprisingly captured the nurses health study, the Framingham study, the national health and nutrition examination survey (NHANES), and the multiple risk factor intervention trial (MRFIT). Case-control studies were the appropriate chosen design for rarer outcomes—for example, cancers. Other specialties (such as mental health and diabetes) used cross sectional designs. We found only one case-cohort study.16 In such studies29 30 cases are identified from a cohort during follow up. Controls are sampled from the whole cohort, including people who become cases. The case-cohort design is logistically simpler than for case-control studies, although its analysis must handle the potential duplication of cases as controls. Their popularity may increase especially when several outcomes are investigated with large data bases.
One important question is whether a study's design is appropriate for the topic addressed. We have concentrated here on analysis and reporting, but we encourage subsequent enquiry into this key design concern.
Exposure variables
The most commonly investigated issues were lifestyle and behavioural. Genetic studies were few, though genetic epidemiology is a growing discipline.31 Most exposures were quantitative, usually grouped into ordered categories rather than analysed as continuous variables. Methodologists have emphasised the importance of appropriate selection of categories and presentational methods32–35 but few articles gave reasons for the choice of categories and analyses, raising suspicions that alternative groupings might have also been explored. Furthermore, articles generally did not discuss the quality of the data. Ad hoc categorisations and measurement errors might explain many inconsistencies in published results.14
Measures of association and inferences
Overall, authors presented appropriate estimates of their associations. Case-control studies used odds ratios, and most cohort studies used some form of rate ratio. Hazard ratios from proportional hazards models appear more often than rate ratios from Poisson models, which are appropriate only when rates stay constant over time.7 Nomenclature and methods did not always match—for example, we had to check the results and methods sections carefully to identify what authors actually meant by “relative risk” or “risk ratio”.
Confidence intervals were usually presented as appropriate expressions of statistical uncertainty, but in some papers text and tables wee made unwieldy by their excessive use. Hypothesis testing appeared in about half of articles, indicating rehabilitation of P values in observational studies.20 36 37 None the less, conclusions should not rely on arbitrary cut offs such as P < 0.05.
The distribution of P values in the figure has a peak around 0.01 < P < 0.05, suggesting that publication bias affects epidemiology, as such significant findings are presumably more publishable.38 Randomised clinical trials and observational epidemiology have different research philosophies, which may affect publication bias. Trials are more decision oriented, often studying a single primary hypothesis with a (hopefully) unbiased design. As authors of epidemiological studies have more options on what to publish, publication bias is more complex and of potentially greater concern.
Adjustment for confounders
Most authors adjusted for potential confounders, though the extent varied greatly. Though techniques for such adjustment are established, their implementation seems inconsistent. For some topics—for example, coronary heart disease—past experience aids the choice of variables, but how confounding is tackled depends on the authors' disposition and the extent of data. Few explained how and why they chose variables for adjustment. A few were overenthusiastic and included too many variables in small studies. Some used stepwise regression to reduce the set of adjustment variables, a practice not without problems.39 40 Such procedures do not consider whether a variable's inclusion in the model affects the estimated effect of the exposure—that is, whether the variable is a confounder.
Some reported both unadjusted analyses and analyses adjusted for covariates, which appropriately informs readers of the role confounders had.
Effect modifiers
Subgroup analyses were common, and half of the articles claimed some effect modification. In clinical trials41 42 and epidemiology22 overinterpretation of subgroup analyses presents three problems: increased risk of false claims of effect modification when several subgroup analyses are explored; insufficient use of statistical tests of interaction, which more directly assess the evidence for an effect modifier, compared with misleading uses of subgroup P values or confidence intervals; and the need to exercise restraint, viewing subgroup findings as exploratory and hypothesis generating rather than definitive.
Multiplicity
Some studies explore many associations without considering the consequent increased risk of false positive findings.10 22 Such “data dredging”14 biases publications towards exaggerated claims. Investigators often focus on the most significant associations. This is accentuated in cohort studies with multiple publications, where what gets published can be highly selective. Particularly in small studies, apparently strong associations may be spurious and not supported by subsequent studies.
Study size
Few studies gave any power calculation to justify their size. One proposal is that cohort studies, specifically in coronary heart disease, require over 400 events to achieve sufficiently precise estimation.43 This is around the median number of events in our cohort studies, suggesting that many are underpowered, unless the associations with risk are pronounced. For instance, a cohort study relating bone mass to risk of colon cancer had only 44 incident cases.44 With authors seeking positive findings, small studies need inflated associations between exposure and outcome to achieve significance and get published. Selective timing of publication may also increase the risk of false positives.
The methods of power calculation for case-control studies are well established.45 As they have fewer controls per case compared with the ratio of subjects without and with events in cohort studies, the desired number of cases needs to be just as large, except for detecting strong associations. Our case-control studies had a median of 347 cases, suggesting that many could detect only large effects. For instance, one study with 90 cases and controls needed to observe a steep gradient of risk of breast cancer with birth weight to reach significance.46
Sample selection
A study's representativeness depends on the source of participants and the proportion participating.47 Information on refusals and drop outs is often lacking. Authors should document the sample selection process and participation rate.
Conclusions and key findings
We have identified issues of concern surrounding the design, analysis, and reporting of epidemiological research. We think primary responsibility for improvement rests with authors, though journals and peer reviewers need to be vigilant to enhance the quality of articles.
The following limitations merit particular attention:
The participant selection process—for example, information on exclusions and refusals—often lacks details
The quality of data collected, and any problems therein, are often insufficiently described
Some studies are too small and may be prone to exaggerated claims, while few give power calculations to justify their size
Quantitative exposure variables are commonly grouped into ordered categories, but few state the rationale for choice of grouping and analyses
The terminology for estimates of association—for example, the term “relative risk”—is used inconsistently
Confidence intervals are appropriately in widespread use but were presented excessively in some articles
P values are used more sparingly, but there is a tendency to overinterpret arbitrary cut offs such as P < 0.05
The selection of and adjustment for potential confounders needs greater clarity, consistency, and explanation
Subgroup analyses to identify effect modifiers mostly lack appropriate methods—for example, interaction tests—and are often overinterpreted
Studies exploring many associations tend not to consider the increased risk of false positive findings
The epidemiological literature seems prone to publication bias
There are insufficient epidemiological publications in diseases other than cancer and cardiovascular diseases and in developing countries
Overall, there is a serious risk that some epidemiological publications reach misleading conclusions.
What is already known on this topic
Papers in observational epidemiology vary greatly in quality, content, and style
There are no generally accepted reporting guidelines for epidemiological studies
What this study adds
This study presents a survey of recent epidemiological publications.
Critical evaluation concerns: types of study design, study size, sample selection, disease outcomes investigated, types of exposure variable, handling of confounders, methods of statistical inference, claims of effect modification, the multiplicity of outcome-exposure associations explored and publication bias.
There is a serious risk that some epidemiological publications reach misleading conclusions
We are grateful to Nicole Leong for her valuable contributions to getting the study underway. We thank Diana Elbourne, Stephen Evans, and John McKinlay for helpful comments on the draft manuscript.
Footnotes
Contributors All authors jointly conceived the project, undertook the survey, and contributed to writing and revising the manuscript. SJP drafted and coordinated the article's content, TJC coordinated the survey's conduct and BLdeS substantially revised the article. SJP is guarantor.
Funding None.
Competing interests None declared.
Ethical approval Not required.