Article Text

Abstract
AIM To estimate trends in growth for 5 to 11 year old ethnic minority and inner city children and comparative representative samples from 1983 to 1994.
DESIGN Mixed longitudinal.
SUBJECTS At each of six surveys, more than 2000 inner city white, 1500 Urdu or Punjabi speaking, 5000 English representative white, 3000 Scottish representative white, and around 1000 Afro-Caribbean, 500 falling to 300 Gujarati speaking, and 260 increasing to 300 other Indian children.
MAIN OUTCOME MEASUREMENTS Height, weight for height, and triceps skinfold thickness.
RESULTS Height increased in all inner city groups by ∼ 1.5 cm, but group differences were maintained. Trends in triceps skinfold varied, but increased by 4–12% in Indian subcontinent girls. Weight for height increased generally. Inner city white children showed conflicting trends in weight for height and fatness.
CONCLUSIONS Afro-Caribbean children are maintaining their tall, slim build, but other groups emphasise the diversity of obesity patterns in a multi-ethnic society, with a predominant trend towards greater obesity. Monitoring of these groups should continue.
- ethnic minority
- stature
- weight for height index
- triceps skinfold thickness
Statistics from Altmetric.com
Eveleth and Tanner argued that a child’s growth reflects state of health and nutrition better than any other single index, and concluded that a growth study is a powerful tool for monitoring the health of the population, or for pinpointing groups whose share in socioeconomic benefits is less than it might be.1 This theory has been embraced by most researchers in the field.2 3 Floud, in particular, assessed the relations among height, health, and well being over the period 1750 to 1980 and provided support for the theory.2 We demonstrated an increase in height in English and Scottish primary school children from 1972 to 1994.4 This showed that child well being might have improved in Britain over this period. However, the study included a tiny proportion of children from ethnic minorities, and inner city areas were underrepresented. Cross sectional differences of height among ethnic groups in Britain have been reported,5Afro-Caribbean children being the tallest and Gujarati speaking children among the shortest, but it is unknown whether children from ethnic minorities living in inner city areas are becoming taller for a given age as demonstrated for the representative samples. Information on these trends would provide some indication as to whether these groups, which are known to be socially deprived, are gaining or falling further behind in health and nutrition than more advantaged groups.
There has been widespread concern over the increase in overweight and obesity in adults and children in Britain and elsewhere over the past 20 years.4 6-8 Children are growing taller, but at the same time they are getting fatter. The reported trends were an appropriate representation of trends in the white community in Britain,4 but there are no published data to provide evidence of similar increases in the ethnic minorities. Cross sectional differences in weight for height and fatness between ethnic groups are not consistent, with Indian subcontinent groups being lighter but not necessarily thinner than other groups, and Afro-Caribbean children being of comparable weight for height to the white population but substantially thinner.9 10
We collected information on height, weight, and triceps skinfold thickness in primary school children from 20 English inner city areas, including ethnic minority groups, over the period 1983 to 1993. We report the trends in height, weight for height, and triceps skinfold thickness in white and Afro-Caribbean children, and in children originating from the Indian subcontinent, and compare the trends with those of the English and Scottish representative samples.
Subjects and methods
The selection of primary schools in the inner city areas has been described elsewhere.5 Areas were surveyed in alternate years from 1983 to 1993. The children surveyed in the inner city areas were divided into five groups defined by origin as assessed by the field worker and language spoken at home. Language was used to define two Indian subcontinent origin groups, one speaking either Urdu or Punjabi, the other speaking Gujarati. An “other Indian” group comprised children speaking another Indian subcontinent language, mainly Bengali, or assessed as “Indian” by the field worker. Two groups, “inner city white” and “Afro-Caribbean” were defined by the field worker’s assessment, except that language took precedence, and children speaking a language precluding any of the above groups were excluded. Many children were surveyed four times between the ages of 5 and 11 years, but those changing school had fewer measurements. The first valid assessment of ethnic group was used. Data from two quasi representative samples, one English and one Scottish, were used for comparison. Trends for these samples were reported for 1972 to 1994,4 but in this paper the data are restricted to between 1983 and 1994. In England, 22 areas were surveyed in alternate even years from 1984 onwards. In Scotland, areas were surveyed in two year cycles. The few non-white children in these samples were excluded from the analysis. A cohort was defined by year of birth, so the cohorts for the inner city sample were children born between 1972 and 1988. The English and Scottish representative samples included children born between 1973 and 1989, and 1972 and 1989, respectively. The nominal age of a cohort at a given survey was defined as year of survey minus year of birth. The few data with nominal age outside the range 5–11 years were excluded.
All children in a school were measured and weighed unless the child’s parents refused. Height was measured on a Holtain stadiometer, using the method described by Tanner and colleagues.11Height was recorded to the last 0.1 cm and 0.05 cm was added to correct the bias. Children were weighed in underpants, with weight recorded to the last complete 100 g; no correction was made for the resulting negligible bias. Mechanical balances were used in 1983 and 1984 but from 1985 electronic digital scales were introduced. The adjustment for height was made for consistency with previous papers, as height was recorded to the last 0.5 cm from 1972 to 1976.
Triceps skinfold was measured as recommended by Tanner and Whitehouse except that the midpoint between the tip of the acromion and olecranon was marked with the arm hanging straight instead of bent.12
Social and family characteristics were obtained from a questionnaire self administered by the child’s parent, usually the mother, or guardian.
STATISTICAL ANALYSIS
Transformations were used for weight, weight for height, and triceps skinfold thickness. Weight was transformed using log10 (weight−9). This was shown previously to normalise weight and stabilise variance.10 Triceps skinfold thickness was logarithmically transformed. The index log10((weight−9)/height3.7) was used as the measure of weight for height.10
Because children could contribute data to as many as four surveys, but some contributed to only one survey, the data were mixed longitudinal in structure. In order to estimate linear trends over time with appropriate standard errors, a method used previously and described in detail elsewhere was adopted.13 A cubic polynomial was used to describe growth with age. Details are given in the . Heterogeneity between estimates of trend from different groups was tested using meta-analysis methods.14
Trends in log10 (triceps skinfold) and confidence intervals were multiplied by 10 and back transformed to give the estimated percentage change for the period. Mean height and weight for height index were plotted against mean age for the seven cohorts with data in the 1993–94 surveys. Standard deviation (SD) scores were calculated for the 1993–94 data using the England 1994 representative sample as the reference group.
Results
The response to measurement varied from 92.1% in 1993 to 97.9% in 1988, odd years including the inner city sample having a slightly lower response rate than the even years. The numbers of measurements obtained and analysed for each ethnic group in the 1983 and 1984 surveys, and in 1993 and 1994 are shown in table 1. Weight was obtained for most children whose height was measured. Although slightly fewer triceps skinfold measurements were obtained, this was offset by the detection of errors for height and weight. The ethnic composition of the inner city sample changed to include more Afro-Caribbean and other Indian children.
Minimum number of measurements of weight and height or triceps skinfold thickness
The linear trends for each cohort in height, weight, weight for height, and triceps skinfold thickness are shown in table 2. These are averaged over all age groups, and given as trends for each cohort to be comparable with trends published previously from the national study of health and growth (NSHG). The increase over the period 1983–84 to 1993–94 can be estimated by multiplying the given figures by 10.
Estimates of linear secular trends per annual cohort in height, weight, weight for height, and triceps skinfold thickness
HEIGHT
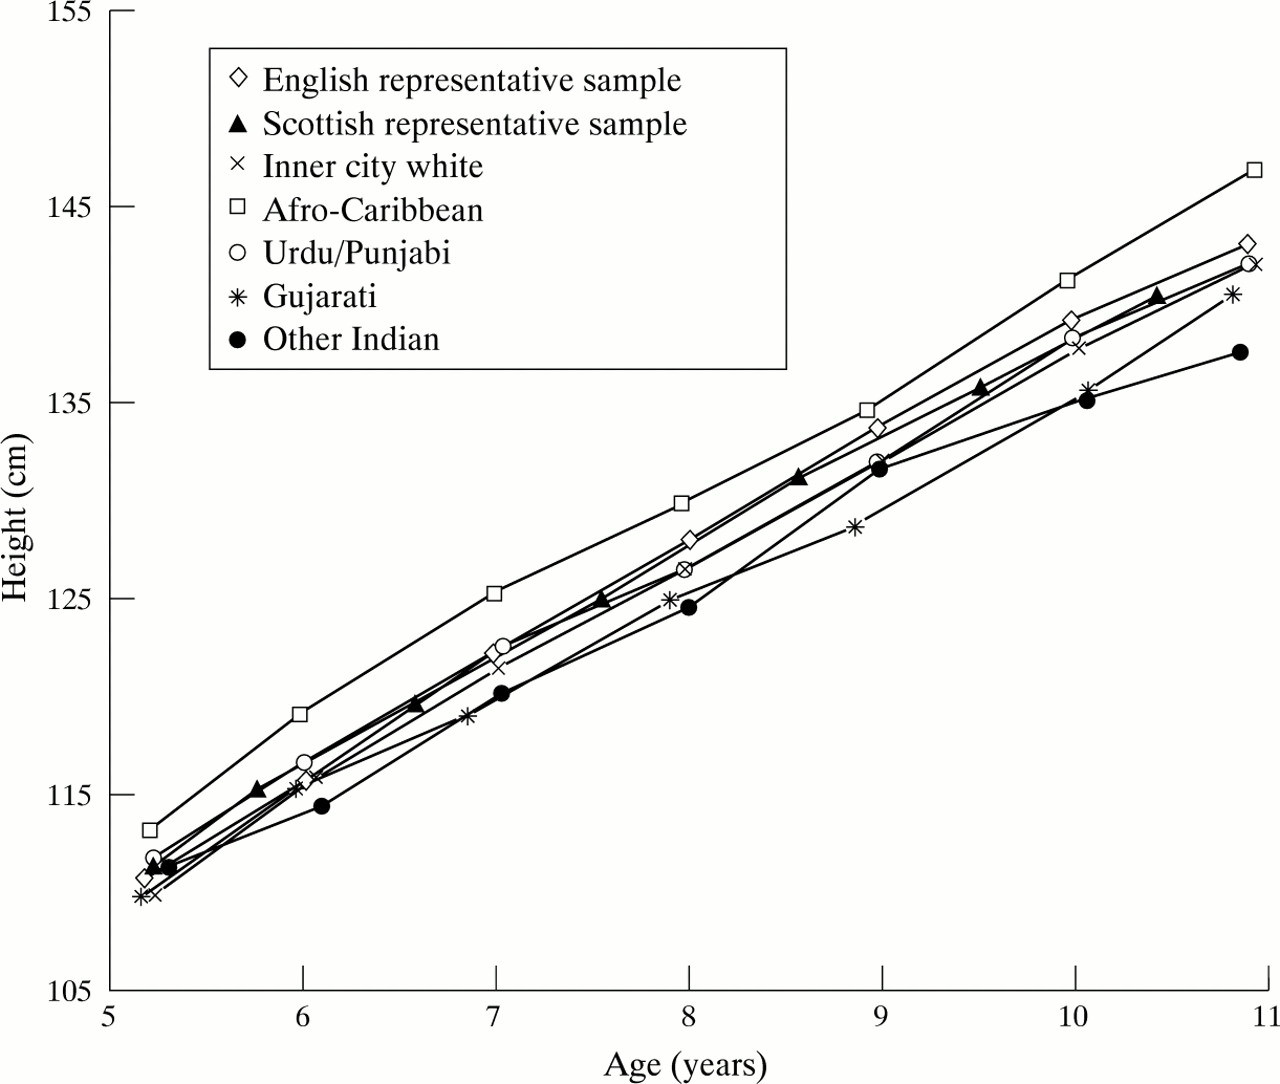
Height increased significantly (the trend was more than twice its standard error) for all groups of children except other Indian boys. In general, the trends for the inner city children were greater than those for the representative samples, and in particular for the ethnic minorities. Afro-Caribbean children remained the tallest at all ages, as shown for boys in fig 1, and despite some catching up, the Gujarati children remained the shortest at most ages. There was heterogeneity in the estimates for girls (p = 0.004), the smallest trend being for Afro-Caribbean girls and the greatest being for Gujarati girls and the other Indian group girls. For boys, the combined estimate of trend was 0.125 cm/cohort (95% confidence interval (CI), 0.097–0.153).

Mean height plotted against mean age for boys in the eligible cohorts in the 1993–94 surveys.
WEIGHT AND WEIGHT FOR HEIGHT
Weight increased significantly in all groups except other Indian boys. However, heterogeneity between groups of boys was not detected (combined estimate 1.82, 95% CI, 1.47–2.18, units as in table 2), but it was detected for girls (p = 0.05). The groups showing the greatest increases in height had the biggest increases in weight, resulting in a significant increase in weight for height over the period in the inner city sample for Gujarati and white girls. All the representative sample groups showed a significant increase. The estimates of trend for the Indian subcontinent groups were large, and greater than the trends for the representative samples, but standard errors were larger owing to the smaller sample sizes. The Afro-Caribbean children had the smallest trends in weight for height, excluding the inner city white boys. Neither set of estimates showed heterogeneity; the combined estimates were 0.36 (95% CI, 0.06–0.65) for boys and 1.03 (95% CI, 0.78–1.30) for girls. Figure 2 shows that ethnic group differences were maintained for boys, with the representative and inner city white and Afro-Caribbean children having similar weight for height, greater than that of the Indian subcontinent groups. The differences were more noticeable at the younger ages.

Mean weight for height index plotted against mean age for boys in the eligible cohorts in the 1993–94 surveys.
TRICEPS SKINFOLD THICKNESS
There were significant increases in all three groups of Indian subcontinent girls, and in boys and girls in the English representative sample, with the biggest increase, for Gujarati speaking girls, amounting to over 11% over the decade (table 3). Heterogeneity was detected in the estimates for both boys and girls (p < 0.001). There were decreasing trends for white inner city children. However, confidence intervals for the percentage change over the period were wide for the inner city groups. The inner city groups were all thinner on average at the end of the study than the English and Scottish representative groups, the Afro-Caribbean group being the slimmest, as shown by the SD scores in relation to the English representative sample.
Percentage change in geometric triceps skinfold thickness from 1983–84 to 1993–94, and mean triceps skinfold standard deviation scores (SDS) at the end of the study
Discussion
This is the first time that trends in growth by ethnic group have been quantified in England. Despite the relative deprivation of the ethnic minority groups in inner city areas, their mean trends in height were greater than those of the representative white sample, and comparable to those of the inner city white children. However, ethnic group differences in attained height have been maintained over the period. Thus catch-up growth of ethnic groups who had lower mean height has been insufficient to eradicate height differences between groups.
It is reassuring that all groups in inner city areas, regardless of ethnicity, are increasing in mean height. With the exception of Gujarati girls and the heterogeneous other Indian girls, the increase in height over the past 10 years in these groups was similar to that observed in the first half of the century in surveys carried out by the London County Council (∼ 1.2 cm each decade),15 and was well above the growth increase seen in the English representative sample in the NSHG in the past 23 years.4 This increase over a 10 year period could indicate that the environment in its broader context has continued to enhance growth of children living in areas of social deprivation. The trend of growth in this study compares favourably with the trends of height in children of low income status in the USA, which were stable in children under 5 years, with the exception of refugees from Asia, and in 7 to 9 year olds in whom the height increase was less than 0.2 SD (∼ 1.2 cm) for a period of 13 years.16 This small increase was similar to the growth of 5 to 9 year olds in the Bogolusa study.17 This indicates that there is little reason for concern that children in inner city areas in Britain have not been growing well up to 1994. However, some groups of children originating from the Indian subcontinent, especially Gujarati children, continue to have an attained height well below most groups in Britain.
The combined trends in weight for height were positive, with confidence intervals for both boys and girls that excluded zero, and the greater increase for girls than boys is in line with the findings from the larger representative sample. These positive trends are confirmed by the triceps skinfold thickness increases, although these displayed heterogeneity. The increases in triceps skinfold were significant in girls from all three Indian subcontinent groups. The increase in weight for height in inner city white girls, coupled with a decrease in triceps skinfold, is unexplained, except by changes in fat distribution. Although heterogeneity was not detected in weight for height, this is likely to be a result of its relative insensitivity as a measure of obesity compared to triceps skinfold.4
That results for triceps skinfold thickness did not completely parallel those for weight for height is illustrated further by the Scottish representative sample. This lack of concordance was found in the representative samples over the period 1972–94 and in an earlier analysis for the period 1972–80.4 13 This has also been reported by others.7 18 This discrepancy could be related to the process of growth and maturation in childhood and adolescence in which body proportions and the ratio of body lean to fat change continuously and unsystematically. Measurement error related to triceps skinfold assessment has been claimed as another explanation for the disagreement,17 but it is unlikely as an explanation unless measurement errors were systematic and positively related to time of assessment in several USA studies and in the NSHG. A more recent assessment of the trend of body mass index (BMI) in the national health and nutrition survey (NHANES) has shown an increase in BMI in the age range 6–17 years for the period 1963–91.19 Based on our findings and the findings in the USA, it is possible to postulate both that skinfold thickness changes may precede weight for height changes and that triceps skinfold thickness is a more sensitive measurement for monitoring trends of obesity. Thus, it is unwise to rely solely on weights and heights for monitoring obesity in children.
The speculation in our previous paper,4 that the increase in triceps skinfold in Scottish children may have ceased, is confirmed by the estimates presented here.
The finding that Afro-Caribbean children have not followed the general trend of increasing levels of obesity was unexpected. In the USA, obesity in black children has increased in the Bogalusa heart study, the National Heart, Lung, and Blood Institute growth and health study, and NHANES.17 19 20 In NHANES, there was evidence that the increase of obesity was even greater in Afro-Caribbean girls than in white girls. This might be a genuine difference in obesity between Afro-Caribbean children in Britain and elsewhere. However, fat distribution between ethnic groups varies and Afro-Caribbean children tend to accumulate more subcutaneous tissue on the trunk than the limbs.21 This was not investigated in our study.
Monitoring obesity in children and adolescents has become necessary because of the worrying increases of BMI in adults and the trends already documented for the wider population of children.4 6 The Bogalusa study showed that obese children tend to change their lipoprotein profile and blood pressure values unfavourably over time, and these changes are more related to changes in adiposity than baseline adiposity.8 Moreover, a report has shown that overweight in adolescence is associated with increased risk of mortality for all causes in both sexes and increased morbidity independent of overweight status in adulthood.22
Until 1994, the NSHG was successful in collecting measurements with a high participation rate, using the same measurement techniques over time, and careful quality control of measurements. This demonstrated clear increases in height in ethnic minorities and inner city children from 1983 to 1993, and increases in fatness for children originating in the Indian subcontinent, but not for Afro-Caribbean and white inner city children. Although it is possible that some of the groups in inner city areas do not share the worrying trends in obesity for the larger population,4 it is more likely that changes in adiposity over time do not coincide in time precisely in all groups in society. Monitoring of these groups should continue.
Acknowledgments
The authors thank colleagues in the team and all parents, children, and helpers in the study areas. The study was funded by the Department of Health and Scottish Home and Health Department.
Appendix
For the English representative samples, the mean height was estimated for cohort j at nominal age i(i = 5,..,11; j = 1973,...,1989), subject to the restrictions 1984 ⩽ (i+j) ⩽ 1994 and (i+j) even, a total of 42 means. Corresponding data were available for the other three outcome measures of weight, weight for height, and triceps skinfold thickness as defined above.
For the English inner city sample, nominal agei (i = 5,..,11) and cohort j(j = 1972,...,1988) were subject to 1983 ⩽ (i+j) ⩽ 1993 and (i+j)odd, again 42 means. For the Scottish sample, because data were collected over two year cycles, there were 48 means defined byi = 5, 5.5, 6.5, ... ,10.5, 11 andj = 1972, ...,1989, with 1983 ⩽ (I+j) ⩽ 1994 and (i+j) restricted to 1983.5, 1985.5, 1987.5, ... ,1993.5, except fori = 5 (i+j) even or 11 (i+j) odd. Data for nominal ages 5 and 11 years were collected at only the second or first survey, respectively, of the two year cycle.
The variances and covariances of the ȳ
ijwere then calculated as follows, where, for cohort j, ςij
2 was the variance of the individual data at age i, ρik.j the correlation between data at agesi and k, nij the number of children at age i, andn
ik.j the number of children present at agesi and k:
The model fitted was: