
Analysis of thin-section CT in patients with coronavirus disease (COVID-19) after hospital discharge
Abstract
PURPOSE:
To analyze clinical and thin-section computed tomographic (CT) data from the patients with coronavirus disease (COVID-19) to predict the development of pulmonary fibrosis after hospital discharge.
MATERIALS AND METHODS:
Fifty-nine patients (31 males and 28 females ranging from 25 to 70 years old) with confirmed COVID-19 infection performed follow-up thin-section thorax CT. After 31.5±7.9 days (range, 24 to 39 days) of hospital admission, the results of CT were analyzed for parenchymal abnormality (ground-glass opacification, interstitial thickening, and consolidation) and evidence of fibrosis (parenchymal band, traction bronchiectasis, and irregular interfaces). Patients were analyzed based on the evidence of fibrosis and divided into two groups namely, groups A and B (with and without CT evidence of fibrosis), respectively. Patient demographics, length of stay (LOS), rate of intensive care unit (ICU) admission, peak C-reactive protein level, and CT score were compared between the two groups.
RESULTS:
Among the 59 patients, 89.8% (53/59) had a typical transition from early phase to advanced phase and advanced phase to dissipating phase. Also, 39% (23/59) patients developed fibrosis (group A), whereas 61% (36/59) patients did not show definite fibrosis (group B). Patients in group A were older (mean age, 45.4±16.9 vs. 33.8±10.2 years) (P = 0.001), with longer LOS (19.1±5.2 vs. 15.0±2.5 days) (P = 0.001), higher rate of ICU admission (21.7% (5/23) vs. 5.6% (2/36)) (P = 0.061), higher peak C-reactive protein level (30.7±26.4 vs. 18.1±17.9 mg/L) (P = 0.041), and higher maximal CT score (5.2±4.3 vs. 4.0±2.2) (P = 0.06) than those in group B.
CONCLUSIONS:
Pulmonary fibrosis may develop early in patients with COVID-19 after hospital discharge. Older patients with severe illness during treatment were more prone to develop fibrosis according to thin-section CT results.
1Introduction
Coronavirus disease (COVID-19) refers to pneumonia caused by novel coronavirus infection [1]. In December 2019, some hospitals in Wuhan City, Hubei Province had successively detected multiple cases of unexplained pneumonia with a history of exposure to South China seafood market, currently confirmed as an acute respiratory infectious disease caused by 2019-nCoV infection [2, 3]. On February 11, 2020, the World Health Organization (WHO) announced that the 2019-nCoV infection of pneumonia was named COVID-19. As of March 1st, 2020, a total of 79,971 cases were diagnosed and 2,873 deaths were reported with COVID-19 and the number is still rising.
Medical imaging is important in the diagnosis and treatment of COVID-19 [4, 5]. Typical imaging manifestations commonly occurring in the peripheral lung include pure ground-glass opacity (pGGO) or mixed ground-glass opacity (mGGO) or consolidation in both lungs [6–8]. However, the progress of the disease after the treatment and discharge of the patient was rarely reported, and it is unclear whether there is a residual focus or fibrosis. The purpose of this study are analyzing thin-section CT findings to predict development of pulmonary fibrosis.
2Materials and methods
This retrospective study was approved by the research ethics committee and exempted from informed consent.
2.1Patients and CT imaging
In this multi-center study, a total of 208 patients diagnosed and treated with COVID-19 infected pneumonia, discharged between January 18th, 2020 to March 1th, 2020, from four hospitals in China were enrolled. Out of 208 patients, 59 received CT follow-up within one month after discharge and were included for this study. The other patients had been scheduled to undergo thin-section CT, but it had not yet been performed before the end of March, 2020. Patient selection was consecutive in each of the four institutions. Of the 59 patients, 31 were male and 28 were female, mean age 41 years (range, 25 to 70 years). COVID-19 diagnosis and discharge criteria were in accordance with the diagnostic criteria of COVID-19 pneumonia by the National Health Commission of the People’s Republic of China [9, 10]. The average CT follow-up time is 31.5 days (range, 24 to 39 days) after the initial hospital admission and 16.3 days after discharge (range, 7 to 25 days).
Scanning was performed using GE Optima 660 (GE Medical Systems; Milwaukee, WI), Philips Brilliance CT (Philips, Amsterdam, Netherlands) or Siemens Emotion 16 scanner (Siemens Healthiness, Erlangen, Germany). The patients were in supine and head-first position and received scanning with breath held. Parameters: 120 kV; 100–250 mAs; layer thickness 1–2.5 mm; pitch, 1–1.5; matrix, 512×512. No contrast was administered. All images were transmitted to the post-processing workstation and reconstructed using high-resolution and conventional algorithms.
2.2Review of CT images
All CT images were reviewed by two radiologists with 15 and 14 years of clincal experience in chest imaging, respectively, and final decisions were established by consensus. In order to evaluate the scope and extent of involvement of the two lungs, the CT scoring criteria used were as follows: five lobes together in both sides, each lung lobe scaling from 0–4 points, add up to the total score of 0–20 points [11] (Table 1). If the patient had multiple CT examinations during hospitalization, the first CT and the most severe CT examination during the disease progression were scored separately. Ground-glass opacity (GGO) showed a slight increase in density, but the bronchial vascular bundles could still be displayed. Consolidation was defined as opacification in which the underlying vasculature was obscured. Fibrosis was defined as parenchymal bands, irregular interfaces (bronchovascular, pleural, or mediastinal), and traction bronchiectasis [12].
Table 1
System for CT scoring (ground-glass opacification, interstitial thickening, and consolidation) on thin-section CT scans
| Score | Definition |
| 0 | None involvement |
| 1 | <25% involvement of lobe |
| 2 | 26% –49% involvement of lobe |
| 3 | 50% –75% involvement of lobe |
| 4 | >75% involvement of lobe |
2.3Clinical comparison and data analysis
Patients with evident fibrosis were assigned to group A and those without evident fibrosis was classified as group B. Based on the recorded clincal data, patient demographic information (i.e., sex and age), length of stay (LOS) in the hospitalization, admission to the ICU, peak C-reactive protein (CRP) level, and CT score were compared between these two groups. CT score includes the first CT during the hospital stay and the CT on peak opacification.
2.4Statistical analysis
SPSS17.0 software (Chicago, IL) was used for statistical analysis. Quantitative data are shown as the mean±standard divisions (SD), and compared through the analysis of variances or independent sample t-tests. Qualitative data were compared using a chi-square test. P < 0.05 was considered statistically significant.
3Results
3.1Progression of CT results
Among the 59 patients, 89.8% (53/59) patients had a typical transition from early phase to advanced phase, and then from advanced phase to dissipating phase [9, 10]. Six other patients had milder lesions, and the image transition was direct from the early manifestations to the dissipating phase. The early-stage manifestations were single or multiple GGO in both lungs, distributed along the bronchial tract or the periphery of the lung. The lesions in advanced stages increased in size and number, with higher density and consolidation. GGO and consolidation were absorbed during the dissipating phase, and the lesions evolved to fibrosis. Twenty-three (39 %) follow-up patients showed residual fibrosis and were classified as Group A whereas, 36 cases (61%) who didn’t show definite fibrosis, were classified as Group B. Patients in group B showed incomplete absorption of GGO and thickening of the interlobular septum while three cases showed complete absorption (Figs. 1, 2).
Fig. 1
Example of CT image slices of a male COVID-19 patient of 32 years old. (a) CT scan performed 5 days after admission. Images show a focal ground-glass opacity in the lower lobe of the left lung. (b) Follow-up CT taken after discharge (or obtained on day 27 after admission to hospital). The lesion was basically absorbed, leaving a little GGO. This patient was enrolled in group B.
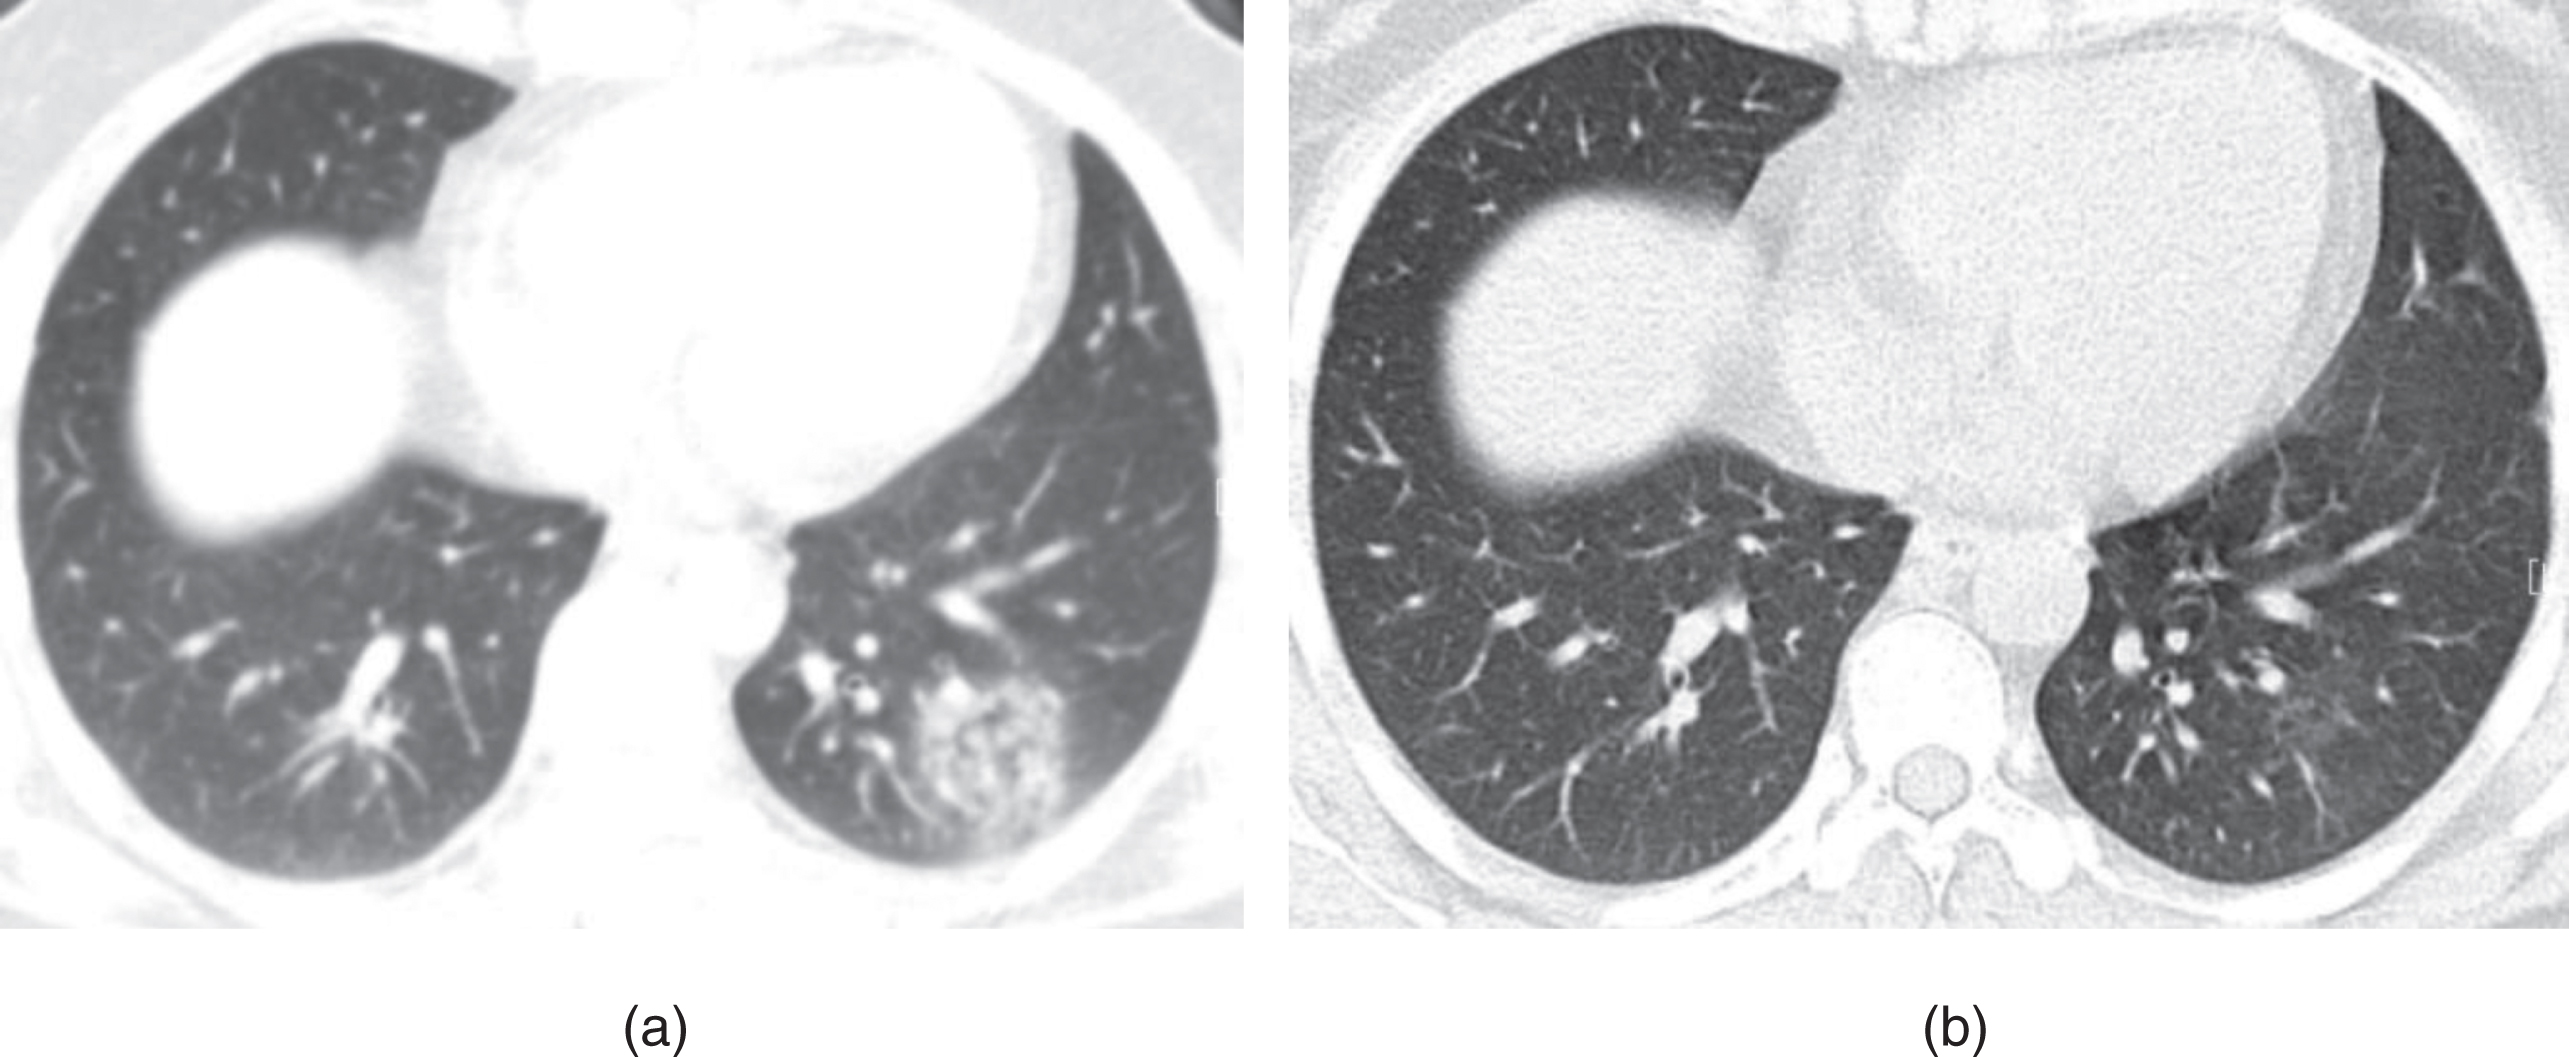
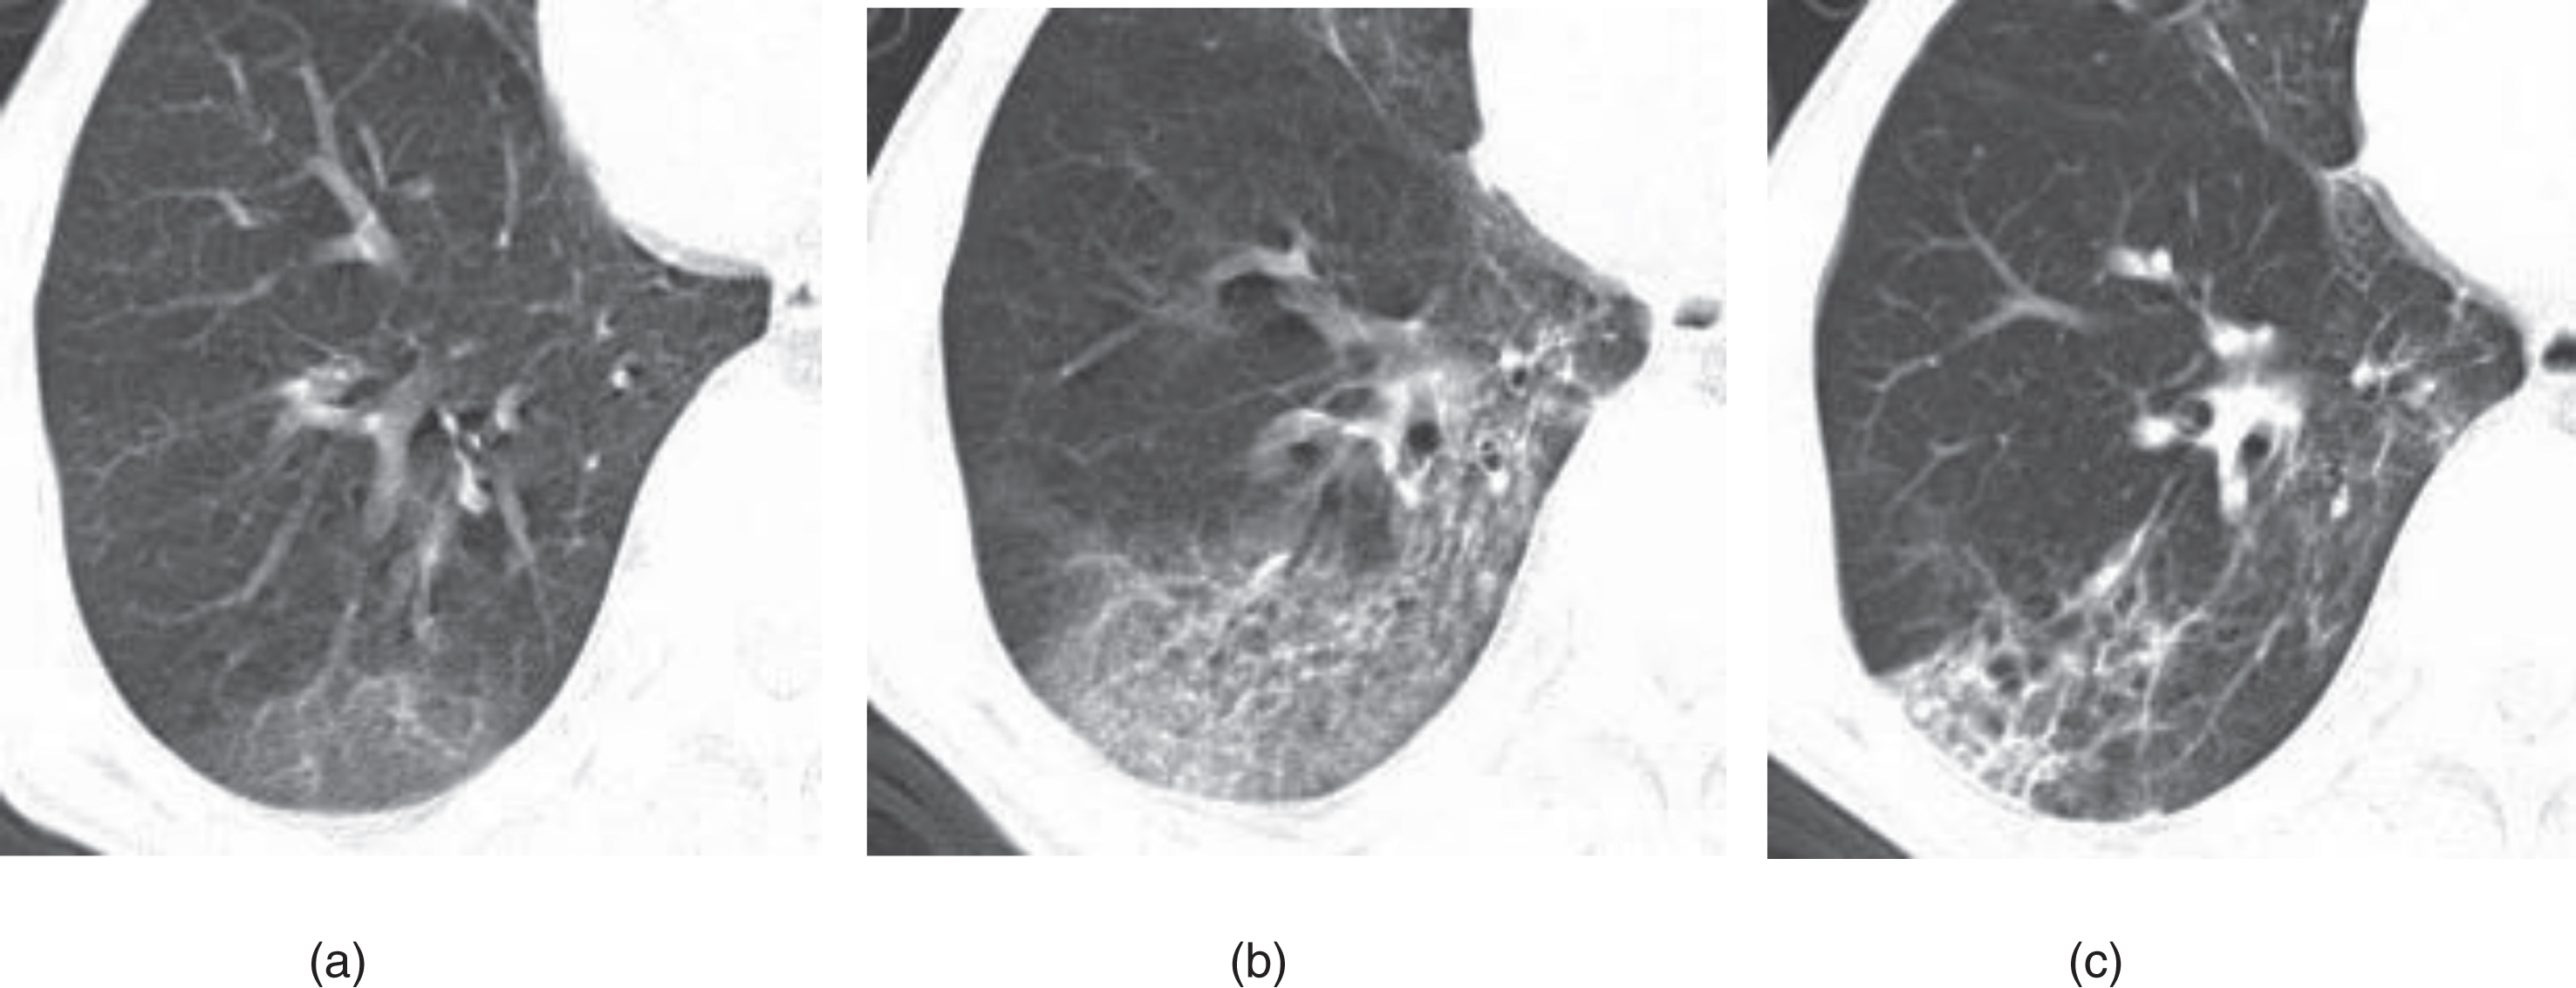
Fig. 2
Example of CT image slices of a male COVID-19 patient of 65 years old. (a) CT scan performed 2 days after admission. Images show ground-glass opacity (GGO) in the posterior basal segment of the right lower lobe, with the lesion located subpleural region. (b) CT images obtained 10 days after admission. Lesions Increased with higher density and thickening of the interlobular septum. (c) Follow-up CT scan (obtained at day 36 after admission and 18 days after discharge) shows visible parenchymal bands, irregular interface, and traction bronchiectasis, which indicates fibrosis. The patient was enrolled in group A.
3.2Comparison of different groups
Patients in group A were older than those in group B (mean age, 45.4±16.9 vs 33.8±10.2 years) (P = 0.001). The LOS of patients in group A was longer than that of patients in group B (19.1±5.2 vs 15.0±2.5 days) (P = 0.001). Percentage of patients in ICU in group A was higher than Group B (21.7% vs 5.6%) (P = 0.061). The peak C-reactive protein level was higher in patients of group A than that in patients of group B (30.7±26.4 vs 18.1±17.9 mg/L) (P = 0.041). The normal range of C-reactive protein level is between 0–5 mg/L.
The first pulmonary CT scan was obtained 2±2 days (range: 0–5) after the onset of symptoms. The first CT score of group A and group B were 2.0±1.1, 1.9±1.1, respectively (P = 0.90). The peak CT was obtained 8±4 days (range: 5–14) after the onset of symptoms. The peak CT score of group A and group B were 5.2±4.3, 4.0±2.2, respectively (P = 0.06) (Table 2).
Table 2
Comparison between COVID-19 patients with and without evidence of fibrosis
| Characteristic | Group A (n = 23) | Group B (n = 36) | P value | |
| Gender | ||||
| Male | 12 | 19 | ||
| Female | 11 | 17 | x2 = 0.002 | 0.964 |
| Mean age (y) | 45.4±16.9 | 33.8±10.2 | t = –3.655 | 0.001 |
| Average length of hospital stay (d) | 19.1±5.2 | 15.0±2.5 | t = –3.423 | 0.001 |
| Intensive care unit admission (%) | 21.7% (5/23) | 5.6% (2/36) | x2 = 3.515 | 0.061 |
| Peak C-reactive protein value (mg/L) | 30.7±26.4 | 18.1±17.9 | t = 2.923 | 0.041 |
| Initial CT score | 2.0±1.1 | 1.9±1.1 | t = 0.127 | 0.900 |
| Peak CT score | 5.2±4.3 | 4.0±2.2 | t = 2.151 | 0.060 |
4Discussion
The COVID-19 exploded around the globe. The WHO announced that the COVID-19 epidemic was a public health emergency of international concern [3, 13, 14]. Chinese medical staff worked hard to combat the epidemic. As of March 1st, 2020, 41,684 patients were cured and discharged. We were particularly interested in determining if thin-section CT demonstrates any residual parenchymal abnormalities or scarring in the early postdischarge period, as this may have implications for future treatment. This study retrospectively analyzed the data of four medical institutions in different regions of China. Out of 208 patients discharged, 59 patients who thin-section CT had already been performed were included in this study. Patient follow-up has only just begun. Our study population of 59 of these 208 patients represented those patients in whom thin-section CT had already been performed.
The results of this study showed that 89.8% (53/59) of the cases had a typical progression from early phase to advanced phase and advanced phase to dissipating phase [9, 10]. The other six patients had milder lesions, and the imaging manifestations directly entered the dissipating phase from the early phase, and three patients had complete lesion absorption. Follow-up after discharge showed that 39% of patients had residual fibrosis, 61% had no clear fibrosis. According to Antonio GE [12], in severe acute respiratory syndrome (SARS), the early lung fibrosis rate reaches as high as 62%. COVID-19 has a lower rate of fibrosis than SARS. In addition, SARS causes severe lung parenchymal damage, with a high probability of causing “white lung” and mediastinal emphysema [15], while COVID-19 is relatively mild in symptoms, with no mediastinal emphysema seen in this group of cases.
This group of cases shows that elderly patients have a higher chance of developing fibrosis. The patients in the fibrosis group have a higher CT score, longer LOS, and a higher proportion of ICU admissions, suggesting that patients with multiple lesions or severe conditions are more prone to fibrosis. In addition, the patients in the fibrosis group have a high level of C-reactive protein. The C-reactive protein rises sharply in the plasma when the body is infected or tissues are damaged, it activates the complement system and strengthens the phagocytosis of phagocytes, and removes pathogenic microorganisms that invade the body [16, 17]. It plays an important protective role in the body’s natural immune process, which may accelerate fibrosis formation during this process.
Some limitations of the current study have to be acknowledged. First, small sample size and short follow-up time. Therefore, studies in the large samples are needed to confirm it. Second, fibrosis was not been confirmed by histology even though the imaging manifestations were typical. The follow-up time for these patients is relatively short, and it is unknown whether irregular interface and parenchymal band features will permanently remain. Last, all patients in the study were discharged from rehabilitation. Their course of the disease was relatively light, and severe cases and deaths were not included in the study.
In summary, the vast majority of cases in this group A and B have a typical progression from the early phase, advanced phase to the dissipating phase. Fibrosis was developed in 39% of patients, which is more likely to occur in the elderly and people with a large range of lesions and severe conditions. This study is only preliminary experience, which requires long-term, large sample follow-up to reveal the evolution of COVID-19 and the significance of fibrosis.
Conflicts of interest and source of funding
All authors declare that they have no conflict of interest.
References
[1] | Zhu N. , Zhang D. , Wang W. , et al. A novel coronavirus from patients with pneumonia in China, 2019, N Engl J Med 382: (8) ((2020) ), 727–733. |
[2] | Li Q. , Guan X. , Wu P. , et al. Early transmission dynamics inWuhan, China, of novel coronavirus-infected pneumonia, N Engl J Med (2020), DOI: 10.1056/NEJMoa2001316. |
[3] | Lu R. , Zhao X. , Li J. , et al. Genomic characterisation and epidemiology of 2019 novel coronavirus: implications for virus origins and receptor binding, Lancet (2020), DOI:10.1016/S0140-6736(20)30251-8. |
[4] | Pan Y. , Guan H. , Zhou S. , et al. Initial CT findings and temporal changes in patients with the novel coronavirus pneumonia (2019-nCoV): a study of 63 patients in Wuhan, China, Eur Radiol (2020), DOI: 10.1007/s00330-020-06731-x. |
[5] | Pan Y. and Guan H. , Imaging changes in patients with 2019-nCov, Eur Radiol (2020), DOI: 10.1007/s00330-020-06713-z. |
[6] | Lin X. , Gong Z. , Xiao Z. , et al. Novel coronavirus pneumonia outbreak in 2019: computed tomographic findings in two cases, Korean J Radiol (2020), DOI:10.3348/kjr.2020.0078 |
[7] | Yoon SH , Lee KH , Kim JY , et al., Chest radiographic and CT findings of the 2019 novel coronavirus disease (COVID-19): analysis of nine patients treated in Korea, Korean J Radiol (2020), DOI: 10.3348/kjr.2020.0132 |
[8] | Wei J. , Xu H. , Xiong J. , et al. 2019 Novel coronavirus (COVID-19) pneumonia: serial computed tomography findings, Korean J Radiol (2020), DOI: 10.3348/kjr.2020.0112 |
[9] | Pan F. , Ye T. , Sun P. , et al. Time course of lung changes on chest CT during recovery from 2019 novel coronavirus (COVID-19) pneumonia, Radiology (2020), 200370. DOI: 10.1148/radiol.2020200370. |
[10] | Zu ZY , Jiang MD , Xu P , et al., Coronavirus disease 2019 (COVID-19): a perspective from China, Radiology (2020), DOI: 10.1148/radiol.2020200490. |
[11] | Bernheim A. , Mei X. , Huang M. , et al. Chest CT findings in coronavirus disease-19 (COVID-19): relationship to duration of infection, Radiology (2020), DOI: 10.1148/radiol.2020200463. |
[12] | Antonio GE , Wong KT , Hui DS , et al., Thin-section CT in patients with severe acute respiratory syndrome following hospital discharge: preliminary experience, Radiology 228: (3) ((2003) ), 810–815. |
[13] | Wu J.T. , K. Leung K. and Leung G.M. , Nowcasting and forecasting the potential domestic and international spread of the 2019-nCoV outbreak originating in Wuhan, China: a modelling study, Lancet (2020), DOI: 10.1016/S0140-6736(20)30260-9. |
[14] | Cabrini L. , Landoni G. and Zangrillo A. , Minimise nosocomial spread of 2019-nCoV when treating acute respiratory failure, Lancet (2020), DOI: 10.1016/S0140-6736(20)30359-7. |
[15] | DSC H. and Zumla A. , Severe acute respiratory syndrome: historical, epidemiologic, and clinical features, Infect Dis Clin North Am 33: (4) ((2019) ), 869–889. |
[16] | Giuliani AL , Berchan M. , Sanz JM , et al., The P2X7 receptor is shed into circulation: correlation with C-reactive protein levels, Front Immunol 10: ((2019) ), 793. |
[17] | Li F. , Zhang W. , Hu H. , et al. Diagnostic value of procalcitonin, C-reactive protein and lactate dehydrogenase in paediatric malignant solid tumour concurrent with infection and tumour progression, Sci Rep 9: (1) ((2019) ), 5903. |

