


Abstract
Celiac disease is a permanent intolerance to dietary gluten. Its well known features are abdominal symptoms, malabsorption of nutrients, and small-bowel mucosal inflammation with villous atrophy, which recover on a gluten-free diet. Diagnosis is challenging in that patients often suffer from subtle, if any, symptoms. The risk of clinically silent celiac disease is increased in various autoimmune conditions. The endocrinologist, especially, should maintain high suspicion and alertness to celiac disease, which is to be found in 2–5% of patients with insulin-dependent diabetes mellitus or autoimmune thyroid disease. Patients with multiple endocrine disorders, Addison’s disease, alopecia, or hypophysitis may also have concomitant celiac disease. Similar heredity and proneness to autoimmune conditions are considered to be explanations for these associations. A gluten-free diet is essential to prevent celiac complications such as anemia, osteoporosis, and infertility. The diet may also be beneficial in the treatment of the underlying endocrinological disease; prolonged gluten exposure may even contribute to the development of autoimmune diseases. The diagnosis of celiac disease requires endoscopic biopsy, but serological screening with antiendomysial and antitissue transglutaminase antibody assays is an easy method for preliminary case finding. Celiac disease will be increasingly detected provided the close association with autoimmune endocrinological diseases is recognized.
- I.
Introduction
- A.
Celiac disease
- B.
Why should endocrinologists recognize celiac disease?
- A.
- II.
Diagnosis and Serological Screening of Celiac Disease
- III.
Common Manifestations of Celiac Disease
- A.
Typical symptoms
- B.
Extraintestinal and atypical symptoms
- A.
- IV.
Endocrinological Conditions Associated with Celiac Disease
- A.
Autoimmune insulin-dependent diabetes mellitus (AIDDM)
- B.
Thyroid disorders
- C.
Miscellaneous endocrinological conditions
- D.
Infertility
- A.
- V.
Pathogenetic Aspects of the Association Between Celiac Disease and Endocrinological Disorders
- A.
Genetic features
- B.
Immunological features
- C.
Environmental factors
- A.
- VI.
Can the Treatment of Celiac Disease Prevent the Development of Autoimmune Endocrinological Disorders?
- VII.
Bone and Celiac Disease
- VIII.
Discussion
- A.
Time to change clinical practice
- B.
Future aspects
- C.
Conclusions
- A.
I. Introduction
A. Celiac disease
CELIAC DISEASE, OR gluten-sensitive enteropathy, is an autoimmune disorder characterized by inflammation, villous atrophy, and crypt hyperplasia of the small-bowel mucosa. The mucosal lesion develops in genetically susceptible individuals after ingestion of dietary gluten and recovers when gluten-containing cereals, wheat, rye, and barley, are withdrawn from the diet (1). Population-based screening studies have shown that at least 0.5% of adults in Western countries suffer from the disease (2). Patients may present with only subtle, if any, symptoms (3), which is the main reason why the disease is highly underdiagnosed in the United States and elsewhere (4, 5). This notwithstanding, the disease should be detected as early as possible, because untreated celiac disease is associated with many, even severe, complications such as intestinal lymphoma or cancer (6) and osteoporosis (7).
B. Why should endocrinologists recognize celiac disease?
The disease is generally considered to affect mainly the gastrointestinal tract. Recent evidence has shown, however, that the condition may also involve a number of extraintestinal manifestations, and patients may thus be referred initially to specialists other than gastroenterologists. Circulating antibodies against gliadin, endomysium, and tissue transglutaminase are typical for the condition, and the development of sensitive and specific antibody assays (8) makes it easy to screen for celiac disease, especially in cases where typical gastrointestinal symptoms are not obvious.
Endocrinologists should consider celiac disease in different autoimmune conditions where the prevalence of the condition is distinctly higher than in the general population. Symptoms suggestive of celiac disease should be recognized and should signal the need for further examinations. This article summarizes what is currently known about the association between various endocrinological diseases and celiac disease.
II. Diagnosis and Serological Screening of Celiac Disease
In untreated celiac disease the characteristic abnormalities in the small-bowel mucosa are villous atrophy, crypt hyperplasia, and an increased density of inflammatory cells in the epithelium and lamina propria (Fig. 1). This type of lesion is nowadays uncommon in other conditions (9). The mucosal lesion recovers with a gluten-free diet and deteriorates further if the patient resumes a gluten-containing diet (1). At the present time, a small intestinal biopsy is almost invariably taken with biopsy forceps by upper gastrointestinal endoscopy, but devices are also available by which to obtain biopsies in fluoroscopy.
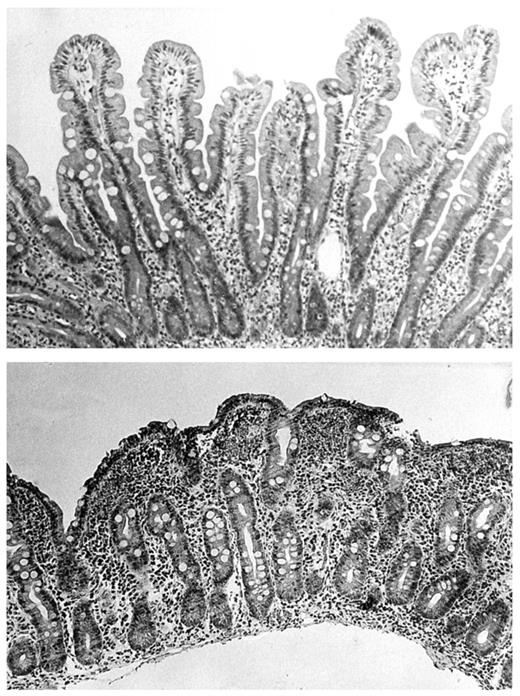
Top, Normal small-bowel biopsy with finger-like villi. Bottom, Small-bowel biopsy from a patient with celiac disease showing villous atrophy and hypertrophy of crypts.
The current diagnostic criteria comprise the finding of typical mucosal lesion, and the introduction of a gluten-free diet should result in clinical or histological recovery. The occurrence of further mucosal deterioration upon gluten challenge was earlier recommended to distinguish the condition from other diseases causing villous blunting (10); this is no longer necessary except in cases where the diagnosis has remained inconclusive (11).
The occurrence of circulating antibodies against gliadin or intestinal matrix further supports a diagnosis of celiac disease. Various antibody assays have been developed to select patients for diagnostic small-bowel biopsy. Antireticulin (10) and antigliadin (12) antibodies were the first tests to be employed in screening, the latter still being widely in use. In the context of celiac screening in asymptomatic patients and in various risk groups, however, the benefits of the more recent IgA class antiendomysial antibody test (13, 14) and the latest antitissue-transglutaminase test (15, 16) would now seem obvious (Table 1).
The sensitivity and specificity of serological tests in the diagnosis of celiac disease
| Sensitivity (%) | Specificity (%) | |||
|---|---|---|---|---|
| Median | Range | Median | Range | |
| IgA gliadin antibodies | 87 | 31–100 | 85 | 82–100 |
| IgA antiendomysial antibodies | 93 | 85–100 | 100 | 95–100 |
| IgA antitissue transglutaminase antibodies | 95 | 92–98 | 95 | 94–99 |
| Sensitivity (%) | Specificity (%) | |||
|---|---|---|---|---|
| Median | Range | Median | Range | |
| IgA gliadin antibodies | 87 | 31–100 | 85 | 82–100 |
| IgA antiendomysial antibodies | 93 | 85–100 | 100 | 95–100 |
| IgA antitissue transglutaminase antibodies | 95 | 92–98 | 95 | 94–99 |
First, the specificity of these tests is close to 100%, and the sensitivity is high enough for screening purposes. Antiendomysial antibody is a somewhat observer-dependent immunofluorescence test, whereas the antitissue transglutaminase antibody test is based on ELISA and is obviously easier to interpret and more suitable for large screening programs than the antiendomysial antibody. Both tests can well be applied in screening for celiac disease in patients with various endocrinological disorders, and the two can also be combined. A positive test result should always be confirmed by small-intestinal biopsy. However, 2–3% of patients with celiac disease have selective IgA deficiency (22, 23) and hence remain negative for IgA class gliadin and antiendomysial and antitissue transglutaminase antibodies; IgG class gliadin antibodies or serum total IgA can be applied in screening of these cases (23).
The small-bowel lesion develops gradually from mucosal inflammation to crypt hyperplasia and villous atrophy (24). A body of evidence shows that sometimes in cases where the first biopsy is normal or nondiagnostic, celiac disease can sometimes be observed subsequently when patients have continued on a gluten-containing diet (25–28). Thus, a normal small-bowel biopsy does not necessarily exclude celiac disease for life. Especially antiendomysial antibody-positive patients without villous atrophy, and relatives of celiac disease patients, seem to harbor this latent form of the condition (29, 30).
III. Common Manifestations of Celiac Disease
A. Typical symptoms
The classical features of celiac disease are well recognized. In small children, abnormal stools, steatorrhea, and abdominal distention may occur. Poor growth and failure to thrive are the most typical symptoms, and growth curves may reveal the condition early. In children aged 2 yr or more, symptoms appear to be milder and resemble those observed in adults (31). Subclinical isolated nutrient deficiencies may occur, and bone mineral density (BMD) may be impaired even in childhood (32). In adults, celiac disease typically produces diarrhea or steatorrhea, malaise, and weight loss. Abdominal distension after meals is a common, albeit unspecific symptom; only rarely do patients notice a relationship between the abdominal complaints and the ingestion of cereals (9). Symptoms that suggest the diagnosis of celiac disease are bloating flatulence, chronic diarrhea, and lactose malabsorption. A great variety of malabsorption may exist, including anemia due to deficiency of iron or folic acid, and less commonly of cobalamin; serum calcium and fat-soluble vitamins D (7, 33), and less often K (34), may be low. Weight loss and fatigue may occur; however, even constipation, overweight, or obesity do not exclude celiac disease (9).
These common modes of presentation have remained, by and large, the same since 1960, but overall there has occurred, both in children and adults, a shift toward milder symptoms (35). Steatorrhea and profuse diarrhea are relatively rare, whereas patients often suffer only from occasional loose stools. Malabsorption may be subclinical, and severe forms are infrequent. Some celiac patients may experience abdominal discomfort mimicking irritable bowel syndrome (36).
Symptoms usually disappear on a gluten-free diet within a few weeks, whereas the recovery of the small-bowel mucosa may take much longer, 1 yr or even more. Apparently, a gluten-free diet often alleviates abdominal symptoms even in nonceliac patients (37). Hence, all approaches to detect celiac disease by dietary interventions are to be strongly discouraged: subsequently, the diagnosis may be difficult to establish, because possible mucosal lesions may have recovered as a result of gluten withdrawal.
Since the development of serological screening tests for celiac disease, it has become evident that the symptoms described above constitute only a minor component in the concept of celiac disease (29, 38). In many, perhaps in the majority of cases, celiac disease remains clinically silent, or symptoms emerge outside the gastrointestinal tract.
B. Extraintestinal and atypical symptoms
The recognition of atypical and clinically silent celiac disease has resulted in a marked increase in the incidence of the condition. Consequently, the overall prevalence of celiac disease in the population seems to be 0.5–1.0%—not less than 0.1% as was thought 20 yr ago (2). In first-degree relatives of celiac patients the risk is at least 10-fold (39, 40). The best known extraintestinal manifestation is dermatitis herpetiformis, an itching papulovesicular skin disease appearing predominantly at the knees, elbows, and buttock. Granular IgA deposition in the papillary dermis of the uninvolved skin is diagnostic for the condition (41). All untreated patients also evince at least some degree of small-bowel mucosal inflammation or atrophy, and both the skin symptoms and the mucosal lesion resolve on a gluten-free diet (42). The occurrence of autoimmune disorders in dermatitis herpetiformis is similar, by and large, to that in celiac enteropathy (43). Dermatitis herpetiformis is today considered one form of the celiac trait rather than an associated disease.
Recurrent oral aphthous ulcerations and enamel defects in the permanent teeth may be the only presenting manifestations of celiac disease (44). Neurological symptoms include peripheral neuropathy, memory loss, and ataxia (45). Sjögren’s syndrome, nonspecific arthritis, and arthralgia have been described in connection with celiac disease (44).
Osteoporosis and infertility can be considered complications of celiac disease, because they are at least partially reversible on a gluten-free diet. In addition, a number of endocrinological autoimmune diseases, as reviewed below, belong to the category of celiac disease associations.
IV. Endocrinological Conditions Associated with Celiac Disease
A. Autoimmune insulin-dependent diabetes mellitus (AIDDM)
More than 30 yr ago, the association between celiac disease and AIDDM was recognized, especially by pediatricians. It was estimated that 1.0–1.5% of diabetic children suffered from celiac disease (46, 47). In these early reports, patients usually presented with classical symptoms such as steatorrhea, malabsorption syndrome, diarrhea, and failure to thrive. The metabolic control of diabetes mellitus was generally poor, and episodes of hypoglycemia were frequent (48). Diarrhea may easily have been misinterpreted as due to autonomic diabetic neuropathy or exocrine pancreatic insufficiency, and the diagnosis of celiac disease was therefore sometimes delayed. There also may have been confusion as to the etiology of villous atrophy, which might have been thought to be a direct complication of AIDDM instead of untreated celiac disease. In the absence of serological screening tests, celiac disease was invariably suspected only on the basis of overt symptoms, this obviously leading to underestimation of the frequency of the disease.
As to celiac disease, the frequency of AIDDM has been 1.4–3.5% (49–51), and in the latest studies somewhat higher, 5.4–7.4% (38, 52, 53).
After the introduction of serological antibody tests, a number of studies have been carried out to assess the frequency of celiac disease in patients with AIDDM. Virtually all have shown an increased frequency of the disorder compared with that (0.5–1.0%) in the population in general (Table 2). The prevalence figures shown here are based on biopsy-proven cases, and there are always some subjects with positive serological tests who will refuse the diagnostic small-bowel biopsy. There may be, on the other hand, some publication bias in favor of an increased frequency of celiac disease. Nevertheless, we can assume that approximately 4% of patients with AIDDM have concomitant celiac disease. Almost without exception, AIDDM has developed before the verification of celiac disease. However, the delay in the diagnosis of celiac disease is usually many years (94), which makes it difficult to specify the order in which the diseases appear.
Serological screening studies on the prevalence of celiac disease in patients with AIDDM
| Authors (Ref.) | Country | n | Screening method | Clinical celiac disease detected before screening (n) | Celiac disease detected by screening (n) | Overall prevalence of celiac disease n (%) |
|---|---|---|---|---|---|---|
| Boudraa et al., 1996 (54) | Algeria | 116 children | AGA,a EmAb | 3 | 16 | 19 (16.4) |
| Gadd et al., 1992 (55) | Australia | 180 children | AGA | 0 | 4 | 4 (2.2) |
| Verge et al., 1994 (56) | Australia | 273 children | AGA, EmA | 0 | 5 | 5 (1.8) |
| Schober and Granditsch, 1994 (57) | Austria | 164 children | AGA | 0 | 0 | 0 (0.0) |
| Schober et al., 2000 (58) | Austria | 403 children | AGA, EmA | 0 | 6 | 6 (1.5) |
| De Block et al., 2001 (59) | Belgium | 399 children and adults | EmA | 0 | 3 | 3 (0.8) |
| Fraser-Reynolds et al., 1998 (60) | Canada | 236 children | EmA | 0 | 12 | 12 (5.0) |
| Gillett et al., 2001 (61) | Canada | 233 children | EmA, tTg-abc | 4 | 14 | 18 (7.7) |
| Sumnik et al., 2000 (62) | Czech | 345 children | EmA | 0 | 14 | 14 (4.1) |
| Hansen et al., 2001 (63) | Denmark | 106 children | AGA, EmA, tTg-ab | 2 | 9 | 11 (10.4) |
| Mäki et al., 1984 (64) | Finland | 215 children | ARA | 0 | 4 | 4 (2.3) |
| Savilahti et al., 1986 (65) | Finland | 201 children | AGA, ARAd | 0 | 7 | 7 (3.5) |
| Collin et al., 1989 (66) | Finland | 195 adults | AGA, ARA | 0 | 8 | 8 (4.1) |
| Kontiainen et al., 1990 (67) | Finland | 141 children | AGA, ARA | 0 | 3 | 3 (2.0) |
| Saukkonen et al., 1996 (68) | Finland | 776 children | AGA, ARA | 1 | 18 | 19 (2.4) |
| Koletzko et al., 1988 (69) | Germany and Switzerland | 1032 children | AGA | 8 | 2 | 10 (1.0) |
| Kordonouri et al., 2000 (70) | Germany | 520 children | AGA, EmA, tTg-ab | 0 | 9 | 9 (1.7) |
| Seissler et al., 1999 (71) | Germany | 305 children and adults | tTg-ab | 0 | 5 | 5 (1.6) |
| Cronin et al., 1997 (72) | Ireland | 101 adults | EmA | 0 | 5 | 5 (4.9) |
| Cacciari et al., 1987 (73) | Italy | 146 children | AGA | 0 | 5 | 5 (3.4) |
| Barera et al., 1991 (74) | Italy | 498 children | AGA | 0 | 16 | 16 (3.2) |
| Sategna-Guidetti et al., 1994 (75) | Italy | 383 adults | EmA | 0 | 10 | 10 (2.6) |
| Pocecco and Ventura, 1995 (76) | Italy | 4154 children | AGA | 14 | 108 | 122 (2.7) |
| Nosari et al., 1996 (77) | Italy | 138 children | AGA, EmA | 4 | 2 | 6 (4.4) |
| Lorini et al., 1996 (78) | Italy | 172 children | AGA, ARA, EmA | 0 | 6 | 6 (3.5) |
| De Vitis et al., 1996 (79) | Italy | 639 adults | AGA, EmA | 0 | 63 | 63 (7.0) |
| Not et al., 2001 (80) | Italy | 491 children and adults | EmA | 0 | 28 | 28 (5.7) |
| Calero et al., 1996 (81) | Spain | 141 children | AGA | 0 | 4 | 4 (2.9) |
| Roldan et al., 1998 (82) | Spain | 177 children | AGA, EmA | 4 | 3 | 7 (3.9) |
| Vitoria et al., 1998 (83) | Spain | 93 children | AGA, EmA | 0 | 6 | 6 (6.5) |
| Sigurs et al., 1993 (84) | Sweden | 459 children | AGA, ARA | 6 | 15 | 21 (4.6) |
| Stenhammar et al., 1993 (85) | Sweden | 207 children | AGA | 3 | 4 | 7 (3.4) |
| Sjöberg et al., 1998 (86) | Sweden | 848 adults | AGA, EmA | 8 | 14 | 22 (2.6) |
| Carlsson et al., 1999 (87) | Sweden | 115 children | AGA, EmA | 2 | 5 | 7 (6.2) |
| Page et al., 1994 (88) | UK | 767 adults | AGA | 0 | 14 | 14 (2.0) |
| Acerini et al., 1998 (89) | UK | 167 children | AGA, EmA | 0 | 8 | 8 (4.8) |
| Rossi et al., 1993 (90) | USA | 211 children | EmA | 0 | 3 | 3 (1.4) |
| Rensch et al., 1996 (91) | USA | 47 adults | EmA | 0 | 3 | 3 (6.0) |
| Talal et al., 1997 (92) | USA | 185 adults | EmA | 0 | 4 | 4 (3.8) |
| Aktay et al., 2001 (93) | USA | 218 children | EmA | 0 | 10 | 10 (4.6) |
| Median prevalence in 40 screening surveys (range) | 4.1% (0–16.4) |
Gliadin antibodies.
Antiendomysial antibodies.
Antitissue transglutaminase antibodies.
Antireticulin antibodies.
These screening surveys (Table 2) have also taught us that many individuals with both AIDDM and celiac disease have suffered only from subtle, if any, gastrointestinal symptoms. Severe malabsorption is unusual, iron or folic acid deficiency with or without anemia being the most common laboratory abnormalities. Short stature has been reported in about one third of children with celiac disease (74, 76, 78), but in some series this has not been a prominent feature (60, 90, 95).
The impact of a gluten-free diet on the metabolic control of diabetes may depend on the symptoms of celiac disease in patients with both conditions. In severely malnourished subjects with AIDDM, the treatment of newly detected celiac disease has without doubt had an unequivocal positive effect: intestinal symptoms are rapidly alleviated and a significant weight gain is evident. In addition, the metabolic control of AIDDM has improved in general, and in particular the number of severe hypoglycemic episodes declined (46, 48).
This positive effect of a gluten-free diet is, at present, not as straightforward as it was previously, because today’s celiac patients are at the time of diagnosis in good condition and do not suffer from malabsorption. As shown in Table 3, the impact of dieting on metabolic control in patients with AIDDM and celiac disease cannot be considered unanimously positive.
Metabolic control in patients with AIDDM and celiac disease: effect of gluten-free diet
| Authors (Ref.) | n | Study design | Effect of gluten-free diet on metabolic control of AIDDM |
|---|---|---|---|
| Shanahan et al., 1982 (48) | 3 children, 11 adults | Cross-sectional uncontrolled | Fewer hypoglycemic events |
| Sategna-Guidetti et al., 1994 (75) | 6 adults | Prospective uncontrolled | HbA1c increased in 4, no change in 2 |
| Page et al., 1994 (88) | 14 adults | Prospective uncontrolled | No change in serum fructosamine level |
| Lorini et al., 1996 (78) | 5 children | Prospective uncontrolled | HbA1c increased in 3, decreased in 1, no change in 1 |
| Cronin et al., 1997 (72) | 5 adults | Prospective uncontrolled | No significant changes in HbA1c |
| Acerini et al., 1998 (89) | 7 adults | Prospective uncontrolled | No significant changes in HbA1c |
| Iafusco et al., 1998 (96) | 11 children | Prospective uncontrolled | Fewer hypoglycemic events |
| Kaukinen et al., 1999 (97) | 28 + 22 adults | Retrospective and prospective controlled | No effect on HbA1c |
| No effect on hypoglycemic events | |||
| Westman et al., 1999 (95) | 20 children | Cross-sectional controlled | HbA1c not different from patients with AIDDM only |
| Mohn et al., 2001 (98) | 18 children | Retrospective and controlled | Fewer hypoglycemic events; no effect on HbA1c |
We have investigated the influence of a strict gluten-free diet on the metabolic control of diabetes in a prospective and controlled 1-yr study, involving 22 adults with both AIDDM and celiac disease; 22 nonceliac patients matched for age, sex, and duration of AIDDM served as controls (97). Even though a definite improvement in the adherence to the gluten-free diet in the celiac group was achieved, this had no effect on the metabolic control of diabetes. Furthermore, the metabolic control in the celiac group was similar to that in nonceliac controls throughout the study. On the other hand, concomitant diabetic and celiac diets are not always easy to maintain, and glycemic control may theoretically even deteriorate after adopting a gluten-free diet. It was therefore significant that a strict celiac diet was observed to have no detrimental effect on the metabolic control of diabetes, which means that it is quite possible to treat both conditions appropriately at the same time.
An unanswered question is whether untreated celiac disease worsens the rate and progression of diabetic complications. In any case, neurological complications commonly occur in celiac disease (45), and it has not been excluded that untreated celiac disease may predispose diabetic patients to neuropathy.
When serological screening is used, most celiac cases will be detected within 1 yr of the onset of AIDDM (68). On the other hand, there are reports in which AIDDM patients who are initially celiac antibody negative have undergone seroconversion and contracted celiac disease during follow-up (68, 99–102). In general, positive antiendomysial (or antireticulin) antibodies especially seem to predict the eventual development of intestinal villous atrophy and celiac disease (103). Antiendomysial-positive individuals should therefore be kept under surveillance, and a new biopsy is recommended after 2–5 yr, or even earlier, in case symptoms emerge suggestive of celiac disease. It has been advocated further that serological screening for celiac disease in AIDDM should be carried out every fifth year due to the possibility of latent celiac disease, but prospective studies are lacking to substantiate this policy (68).
In contrast to what has been shown in AIDDM, there is no evidence that the risk of celiac disease in type 2 diabetes mellitus is increased compared with the population at large (86, 88).
B. Thyroid disorders
Recent evidence suggests that the association between autoimmune thyroid diseases and celiac disease is quite similar to that between AIDDM and celiac disease. In earlier series, approximately 5% of patients with celiac disease have been found to suffer from hyper- or hypothyroidism, even though the percentages are highly variable (Table 4). No clear difference in the occurrence of hypothyroidism vs. hyperthyroidism was seen. Again, it should be noted that clinically silent celiac cases probably remained mostly undetected. Moreover, thyroid disorders had not been rigorously sought in patients with celiac disease; hence subclinical cases were not found.
Occurrence of thyroid abnormalities in adult celiac disease
| Authors (Ref.) | n | Hyperthyroidism (%) | Hypothyroidism (%) |
|---|---|---|---|
| Lancaster-Smith et al., 1974 (50) | 57 | 5.2 | 0 |
| Cooper et al., 1978 (49) | 314 | 1.0 | 2.2 |
| Midhagen et al., 1988 (104) | 139 | 5.0 | 5.8 |
| Snook et al., 1989 (51) | 148 | 1.4 | 2.7 |
| Collin et al., 1994 (52) | 335 | 2.1 | 3.3 |
| Reunala and Collin, 1997 (43) | 383 | 2.3 | 3.7 |
| 305a | 1.0 | 3.3 | |
| Bottaro et al., 1999 (38) | 1026 | 0.1 | 0.1 |
Patients with dermatitis herpetiformis.
Previous to the wide application of serological screening tests, only few studies reported the prevalence of celiac disease in patients with autoimmune thyroid diseases. Siurala et al. (105) reported small-intestine mucosal biopsy findings in 32 patients with hyperthyroidism, but none showed villous atrophy. The same group (106) found six patients with concomitant spontaneous hypothyroidism or autoimmune thyroiditis and small-intestinal villous atrophy. However, the diagnosis of celiac disease remained inconclusive, as there was no definite response to a gluten-free diet. A few years later, Kuitunen et al. (107) performed small-bowel biopsies on 32 children with autoimmune thyroid disease; two (6%) of them were found to have small-bowel villous atrophy compatible with celiac disease.
An accurate perception as to the presence or the lack of association can be obtained by screening all patients with autoimmune thyroid conditions for celiac disease, and vice versa, by rigorously searching for even subclinical autoimmune thyroid conditions in celiac disease. Such studies should preferably be controlled. Over the past few years a number of prospective studies attempting to clarify the association between thyroid and celiac diseases have been published.
Table 5 constitutes a summary of prospective or cross-sectional studies on the risk of clinical and subclinical thyroid disorder in those suffering from celiac disease. Accepted criteria for autoimmune thyroid diseases (120, 121) were applied in this table. Even though the study settings and results are to some extent varied, thyroid involvement would seem evident in as many as 10–15% of all celiac cases, and clearly more frequently than in controls. Table 5 further shows that subclinical hypothyroidism is an especially frequent finding in celiac disease. Thyroid gland volume as measured by ultrasound, in general, has been smaller in patients with celiac disease than in controls. Equally, the atrophic variant of autoimmune thyroiditis has been more common than the goitrous form (115, 118).
Autoimmune thyroid diseases (AITD) in adult patients with celiac disease: studies in which subclinical thyroid diseases had been actively sought
| Authors (Ref.) | Year | No. of celiac patients | Overall AITDa (%) | Clinical hyperthyroidism (%) | Clinical hypothyroidism (%) | Subclinical or euthyroid AITD (%) | AITD in controls (%) |
|---|---|---|---|---|---|---|---|
| Cunningham and Zone (108) | 1985 | 50b | 34 | 2 | 10 | 22 | No data |
| Weetman et al. (109) | 1988 | 115b | 48 | 0 | 5 | 43 | 16 |
| Gaspari et al. (110) | 1990 | 56 | 32 | 7 | 7 | 18 | 4 |
| Counsell et al. (111) | 1994 | 107 | 40 | 4 | 10 | 26 | 9c |
| Freeman (112) | 1995 | 96 | 17 | 4 | 12 | 1 | No data |
| Sategna-Guidetti et al. (113) | 1998 | 185 | 20 | 3 | 4 | 13 | 11 |
| Velluzzi et al. (114) | 1998 | 47 | 30 | 0 | 4 | 26 | 10 |
| Zettinig et al. (115) | 2000 | 41 | 24 | 0 | 0 | 24 | 0 |
| Toscano et al. (116) | 2000 | 44 | 20 | 0 | 2 | 18 | 9 |
| Sategna-Guidetti et al. (117) | 2001 | 241 | 21 | 1 | 4 | 16 | 9 |
| Hakanen et al. (118) | 2001 | 79 | 24 | 4 | 10 | 10 | 5 |
Compatible with American Thyroid Association guidelines: clinical or subclinical hyper- or hypothyroidism, or positive antithyroid antibodies in euthyroid (119).
Patients with dermatitis herpetiformis.
Based on national data.
Similarly, the prevalence of celiac disease has invariably been higher in patients with autoimmune thyroid diseases than in controls. In serological screening studies with modern antibody assays, a celiac prevalence of approximately 2–4% has been obtained (Table 6). Again, some publication bias cannot be ruled out, and in some studies no increase in the prevalence of celiac disease has been obtained. A recent study indicated that as many as 43% of patients with Hashimoto’s thyroiditis showed an increased density of γδ+ T cell receptor bearing intraepithelial lymphocytes and signs of mucosal T cell activation, both typical for celiac disease (131).
Screening studies on the prevalence of adult celiac disease in autoimmune thyroid disorders
| Authors (Ref.) | Thyroid disorders (n) | Criteria for thyroid disease | Controls (n) | Celiac disease in thyroid disorder (%) | Celiac disease in controls (%) | Symptoms of celiac disease in the study group | Screening testa |
|---|---|---|---|---|---|---|---|
| Collin et al., 1994 (122) | 83 | Clinical disease | 249 blood donors | 4.8 | 0.4 | 1 detected clinically; 3 silent | ARA, AGA, EmA |
| 25 thyroid nodule | 4 | ||||||
| Sategna-Guidetti et al., 1998 (113) | 152 | ATAb | 170 | 3.3 | ND | All silent | EmA |
| Cuoco et al., 1999 (123) | 92 | ATA | 236 blood donors | 4.3 | 0.4 | All silent | AGA, EmA |
| 90 goiter, thyroid nodule cancer | 1.1 | (4/4 iron deficiency) | |||||
| Carroccio et al., 1999 (124) | 48 | Clinical disease | Uncontrolled | 0 | AGA | ||
| EmA | |||||||
| Valentino et al., 1999 (125) | 150 | ATA | Uncontrolled | 3.3 | All silent | EmA | |
| Seissler et al., 1999 (71) | 100 | Not specified | 100 | 0 | 0.5 | tTg-ab | |
| Berti et al., 2000 (126) | 172 | Not specified | 396 disease controls; 4000 blood donors | 3.4 | 0.75 | 2 abdominal symptoms; 4 silent | EmA |
| 0.25 | |||||||
| Kumar et al., 2001 (127) | 132 | Not specified | 71 thyroid nodule or cancer | 2.0 | 0 | No data | EmA; no small- bowel biopsy |
| Meloni et al., 2001 (128) | 297 | ATA | Uncontrolled | 4.4 | All silent | EmA | |
| Volta et al., 2001 (129) | 220 | ATA | 250 blood donors | 3.2 | 0.4 | 2 malabsorption; 5 silent | EmA, tTg-ab |
| 50 thyroid nodule | 0.0 | ||||||
| Larizza et al., 2001 (130) | 90 | ATA | Uncontrolled | 7.8 | 3 symptoms | EmA | |
| 4 silent |
ARA, Antireticulin antibodies; AGA, gliadin antibodies; EmA, antiendomysial antibodies; tTg-ab, antitissue transglutaminase antibodies.
Compatible with American Thyroid Association guidelines: clinical or subclinical hyper- or hypothyroidism, or positive antithyroid antibodies in euthyroid (119).
It seems that a gluten-free diet has some, albeit limited, organ-specific effect on the thyroid gland in patients with celiac disease. There are only occasional reports of improvement in thyroid disease management after the detection and treatment of celiac disease (Table 6). The T4 dosage could be tapered (125), and a recovery of clinical or subclinical autoimmune thyroid disease has been observed (117) in some cases in which celiac patients were placed on a gluten-free diet. On the other hand, symptoms of celiac disease and thyroid malfunction may mimic each other. Treatment failures may therefore be due to inadequate management either of celiac disease or of thyroid disease, or both.
C. Miscellaneous endocrinological conditions
As early as 1984, gluten intolerance was described as occurring concomitantly with at least 65 different diseases (132), most cases turning out to be fortuitous, however, when the high prevalence of celiac diseases came to be understood. One should therefore appraise critically the following associations where large controlled studies are lacking. Nevertheless, such plausible links should be recognized. Both undetected endocrinopathy and celiac disease may cause diagnostic difficulties in conditions in which the two disorders occur simultaneously.
There are case reports on the concomitant occurrence of Addison’s and celiac disease (133–135). An association between these two conditions may indeed exist: in a recent screening survey, five (12.5%) of 41 patients with Addison’s disease of autoimmune origin were found to be suffering from celiac disease (136).
The association between primary hyperparathyroidism and celiac disease is disputable, and only case reports have been published (137); there are no series actively screening for celiac disease in these patients. Moreover, compared with other endocrinological diseases, primary hyperparathyroidism seems to be a rare finding in celiac disease, detected, for instance, in only 0.3% of 1026 patients with celiac disease in Italy (38). Evidence thus suggests that the association between the two diseases is fortuitous. Secondary hyperparathyroidism may of course occur in celiac disease as a consequence of hypocalcemia (see below). Some case reports of autoimmune hypoparathyroidism and celiac disease have been published. In celiac patients with severe hypocalcemia or tetanic seizures this rare association should be borne in mind (138, 139).
Symptoms of celiac disease may be confusingly similar to those in concomitant autoimmune hypophysitis, which again may give rise to diagnostic delay of either condition. We described three celiac patients who also were found to be suffering from hypopituitarism (140). One diabetic patient experienced recurrent hypoglycemic events, one patient had muscle weakness without apparent etiology, and one exhibited growth failure. These symptoms were initially attributed to poor celiac control, but were found to be caused by concomitant hypopituitarism. This might have been of autoimmune origin: at least none of the subjects had a pituitary mass.
Alopecia areata has been found in approximately 2% of celiac disease patients (141); gluten-free diet treatment may initiate hair growth in some patients (141–143).
In general, the risk of celiac disease seems to be increased in patients with multiple autoimmune disorders. Apart from AIDDM and autoimmune thyroid disease, the involvement of the adrenal gland (144) and ovarian failure (145) have also been shown in some cases. Similarly alopecia may occur concomitantly with AIDDM or other endocrinological diseases (144).
D. Infertility
Celiac disease has been found in 4–8% of women with unexplained infertility (146–148), but the evidence of an association is not unambiguous (149). In some case reports, successful treatment of infertility has occurred after the diagnosis and dietary treatment of celiac disease (150, 151). Menarche takes place later and menopause earlier in celiac women, i.e, the fertility period is shortened, and celiac women on a normal diet suffer from spontaneous abortions and other complications of pregnancy more often than those maintaining a gluten-free diet (152). The issue of fertility problems in celiac men is poorly understood, and there are few studies available. Basal serum FSH and LH concentrations have been higher in untreated celiac men than in male controls with Crohn’s disease (153). Plasma testosterone and free testosterone indices have been high, whereas dihydrotestosterone levels are reduced, indicating androgen resistance (154).
Problems of reproduction cannot be completely explained by malabsorption of nutrients in celiac women. It was recently reported that the children of celiac men had lower birth weight than age- and sex-matched nonceliac children (155). Genetic loci outside human leukocyte antigen (HLA) complex have been theorized to be implicated (155, 156); it also remains to be seen how substantial a role gonadal dysfunction plays in untreated celiac disease. In any case, a gluten-containing diet in women with celiac disease seems to carry an increased risk of an unfavorable outcome of pregnancy (148, 157, 158).
V. Pathogenetic Aspects of the Association Between Celiac Disease and Endocrinological Disorders
A. Genetic features
Susceptibility to celiac disease is determined to a significant extent by genetic factors. Liability to the disease runs in families, and concordance for celiac disease in first-degree relatives ranges between 10–15% (39) and reaches up to 80% in monozygotic twins (159–161). The coexistence of celiac disease and endocrinological autoimmune diseases appears to be at least partly due to a common genetic predisposition. Susceptibility to these diseases has been localized to the HLA region of chromosome 6. Approximately 90% of celiac disease patients share the HLA DR3-HLA DQ2 configuration (encoded by alleles DQA1*0501 and DQB1*0201) (162–165), and most of the remainder express the DR4-DQ8 haplotype encoded by DQA1*0301, DQB1*0302 alleles (163, 166).
The prevalence of HLA DQ2 is 20–30% in the population (162, 164), and only a minority of these will ever develop celiac disease. This implies the involvement of additional, probably non-HLA-linked genes in the pathogenesis of celiac disease. Genome-wide screening studies have resulted in a number of proposals for candidate non-HLA gene regions. In Irish celiac disease patients, five other chromosome locations have been identified: 6p23, 7q31, 11p11, 15q26, and 22cen (167). These findings could not be confirmed in the United Kingdom, because only one locus in chromosome 15 evinced a linkage to celiac disease (168). Studies elsewhere have pointed to candidate genes in chromosome 5q and 11q (169–171) as well as in the CTLA4/CD28 gene region (172). In a study by Lie et al. (173) an allele of locus D6S2223 seemed to protect against the development of celiac disease; an allele found in this locus was less frequent among HLA DR3-DQ2 homozygous celiac disease patients than in HLA DR3-DQ2 homozygous nonceliac controls. Interestingly, this allele has also been underrepresented among HLADR3-DQ2 homozygous AIDDM patients, and it was transmitted less often than expected from DR3-DQ2 homozygous parents to diabetic siblings (174). Taken together, no uniform gene or gene region has hitherto been found outside HLA DQ, and such additional genes are likely to have only a moderate effect in the pathogenesis of celiac disease (175).
The diabetic susceptibility, similarly to what has been observed in celiac disease, is associated with HLA DR3-DQ2 and DR4-DQ8. The association between the two diseases could thus be explained partially by the sharing of a common genetic factor in the HLA region (176, 177). Because first-degree relatives of patients with AIDDM also have an increased prevalence of these HLA-risk alleles, it is predictable that the prevalence of celiac disease will be increased in these subjects (178, 179). Moreover, Not et al. (80) showed that the prevalence of other autoimmune diseases was significantly higher (18.7%) in first-degree relatives of AIDDM patients found to have silent celiac disease than in relatives without celiac disease antibodies (2.6%). On the other hand, Saukkonen et al. (180) observed that the prevalence of celiac disease in siblings of patients with AIDDM did not differ from that reported from population-based screening studies.
HLA DQ2 and DQ8 show only weak association with Hashimoto’s thyroiditis; the HLA DQ2 association is less clear in Graves’ disease (181, 182). DQA1*0501 seems to confer an increased susceptibility to Graves’ disease (182, 183). Whether celiac disease and autoimmune thyroid disease share common gene expression outside the HLA region remains obscure. One candidate region might be CTLA4 on chromosome 2q33, a region that has been reported to confer susceptibility to both celiac (172) and Graves’ disease (184). In all, genetic predisposition is not likely to explain entirely the association between celiac disease and autoimmune thyroiditis.
The HLA DR3-DQ2 and DR4-DQ8 haplotypes are common in many autoimmune diseases, e.g., Addison’s disease, Sjögren’s syndrome, and autoimmune hepatitis (185). This HLA association presumably predisposes individuals to autoimmune conditions. Of note, many conditions, including celiac disease and autoimmune thyroid diseases, are more common among females.
B. Immunological features
At present, it is widely accepted that immunological mechanisms are implicated in the development of the mucosal damage in celiac disease. In untreated patients there are signs of activation of both mucosal cellular and humoral immune systems (186, 187). The major single environmental trigger is ingested gluten (gliadin). Recently, Dieterich et al. (188) established that serum antiendomysial antibody, a specific indicator of active celiac disease, recognizes enzyme tissue transglutaminase, of which activated endothelial, fibroblast, and mononuclear cells are a rich source. This enzyme seems to play a critical role in controlling cell homeostasis, regulating the cell cycle through its involvement in proliferation, differentiation, and apoptosis (189). Gliadin is an excellent substrate for tissue transglutaminase, which has now been shown to be the predominant autoantigen for celiac disease (188). Gluten-specific HLA DQ2- and DQ8-restricted T cells are present in the small-bowel mucosal lesion of celiac disease (190). Antigen-presenting cells in the lamina propria present digested gluten peptide to CD4+ T cells via their HLA DQ2 molecules. Tissue transglutaminase modifies gliadin peptides through deamidation of glutamine residues to negatively charged glutamic acid, thus facilitating the binding of gliadin peptides to the peptic groove of HLA DQ2 and DQ8 molecules. This results further in better binding affinity and increased T cell reactivity (191–193). T cells that are customarily silent, once activated, induce a local inflammatory response that may continue as long as gliadin is present. Stimulated T cells secrete Th 1 cytokines such as TNFα and γ-interferon, which can further damage the small-bowel mucosa, leading to enteropathy (187, 194). For example, TNFα triggers intestinal fibroblasts to secrete matrix metalloproteinases (MMPs), which lead to mucosal destruction by dissolution of connective tissue. In vitro the inhibition of TNFα and MMP-3 has been seen to prevent such mucosal damage (195). Accordingly, expression of MMP-1 and MMP-3 mRNA is increased in fibroblasts of celiac small-bowel mucosa in vivo (196). A simultaneous Th 2 response at the intestinal level results in the formation of autoantibodies (197, 198). Antibodies against tissue transglutaminase may even play a direct role in the pathogenesis of small-bowel mucosal damage in celiac disease. In an in vitro model, antitissue transglutaminase antibody has been seen to inhibit epithelial differentiation on the crypt-villous axis (199). Whether antitissue transglutaminase antibody contributes to celiac-type small-bowel mucosal damage in vivo remains to be seen.
How are autoimmune endocrinological diseases such as AIDDM and autoimmune thyroid disorders associated with celiac disease? The coexistence of these diseases could be explained by molecular mimicry by which gliadin or tissue transglutaminase activates T cells that are cross-reactive with various self-antigens. Such inflammatory responses may have the capacity to persist in genetically susceptible hosts and lead to chronic organ-specific autoimmune disease via epitope spreading (200). However, it is unclear whether any sequence similarities exist between gliadin or tissue transglutaminase and, for example, glutamate decarboxylase antibodies associated with diabetes (GAD), insulin, thyroid peroxidase antibodies, or 21-hydroxylase.
It is also possible that, apart from gliadin, tissue transglutaminase can modify other external or self-antigens by cross-linking or deamidation and thus generate different neoantigens (200). These antigens and antibody production can further induce various autoimmune phenomena outside the intestine. On the other hand, apart from antiendomysial antibodies, celiac patients have an increased frequency of other autoantibodies; it is not known whether they play any pathological role (50, 201, 202). Furthermore, oxidative stress and inflammation may cause aberrant activation of transglutaminases in different tissues, which leads to the formation of inappropriate proteinaceous aggregates that may be cytotoxic and contribute to a variety of diseases (203).
There is evidence that in the development of autoimmunity in AIDDM, the failure to achieve tolerance to autoantigens derives from the gut. In patients with newly diagnosed AIDDM, the islet cell antigen GAD-reactive lymphocytes express the gut-specific homing receptor α4β7 integrin (204). Furthermore, there are observations indicating that treatment of neonatal nonobese diabetic mice with monoclonal antibodies to α4 protects against insulitis (205). These findings suggest that autoreactive lymphocytes originate from the intestine and that tolerance to a self-antigen is broken in the gut-associated lymphocyte population. Interestingly, the prevalence of antitissue transglutaminase antibodies has been reported to be as high as 32% in HLA DQ2 homozygous AIDDM patients, as compared with 2% in patients without HLA DQ2 or DQ8 (206).
It has also been hypothesized that increased intestinal permeability in untreated celiac disease (207, 208) predisposes to other autoimmune disorders by facilitating further external antigens such as food proteins, bacterial products, and endotoxins to enter the intestinal lamina propria, thus leading to the activation of autoimmune phenomena (209). A role of food antigens in autoimmunity is supported by animal experiments in which hydrolyzed casein instead of nonhydrolyzed diet delayed the onset of AIDDM in BB rats, which develop AIDDM spontaneously (210). Likewise, a gluten-free diet for 320 d reduced the incidence of AIDDM from 64% to 15% in nonobese diabetic mice (211). In BB rats, increased paracellular permeability was observed even 3–4 wk before the development of insulitis and clinical diabetes (210). Zonulin, a human protein analog to the Vibrio cholerae-derived Zonula occludence toxin, is able to open small-bowel mucosal tight junctions, leading to increased molecule permeability, and in active celiac disease, zonulin expression is increased (212). Recently it was found that the increased intestinal permeability in the diabetic BB rat model is also associated with an increased concentration of intraluminal zonulin (213). On the whole, defects in the small-bowel mucosal barrier may be important in breaking oral tolerance and in mediating various autoimmune diseases.
C. Environmental factors
The principal environmental factor in celiac disease is dietary gluten, which is essential for the development of the disease. Apart from gliadin (wheat gluten), secalin (rye) and hordein (barley) are considered harmful, whereas oat protein avenin appears to lack a toxic effect in celiac disease (214). Additional environmental factors may be required for the breaking of oral tolerance in individuals genetically susceptible to celiac disease or other autoimmune conditions. Adenovirus serotype 12 has shown amino acid sequence homology with gliadin peptide (215). However, there is no evidence to suggest that celiac patients have a high prevalence of adenovirus infection (216), but virus infection may still initiate the cellular immune response (217). Sometimes celiac disease becomes manifest during the postnatal period (218). Transient postpartum thyroiditis is a well known entity and may later predispose to chronic thyroiditis (219). The postpartum period may also be a risk factor for Graves’ disease in susceptible individuals (220). The body content of selenium may be low in untreated celiac disease (221). Interestingly, selenium deficiency may also impair thyroid hormone action (222, 223). So far there are no data on the association between thyroid function and selenium deficiency in untreated celiac disease.
Some studies have shown an inverse relationship between cigarette smoking and celiac disease (224). Smoking may influence the T- or B cell response and also decrease the intestinal permeability that is a common feature in celiac disease; the role of smoking in the etiology of celiac disease is still controversial (225). On the other hand, smoking may be a risk factor for Graves’ ophthalmopathy (226).
At the moment, apart from gluten, no additional environmental factors have been found to be involved in the development of celiac disease in genetically susceptible individuals. The period between the exposure of gluten and the disease development may be relatively short. This may indicate that additional genetic alleles are more likely to increase the risk of celiac disease (227).
VI. Can the Treatment of Celiac Disease Prevent the Development of Autoimmune Endocrinological Disorders?
As stated earlier, the effect of a gluten-free diet on the course of endocrinological disorders seems, in most cases, to be only moderate, but on the other hand, symptoms of celiac disease cannot always be distinguished from those of endocrinopathy. Even though symptoms of gluten intolerance are not restricted to the intestine, common genetic factors, i.e., HLA DR3-DQ2 and DR4-DQ8, might explain the increased prevalence of autoimmune diseases in celiac disease. So far, there has been only circumstantial evidence that gluten in itself may induce other autoimmune conditions. In one study, the T4 dosage could be tapered when patients were placed on a gluten-free diet (125). Thyroid abnormalities have been found to be more common in patients with dermatitis herpetiformis than in controls with HLA B8/-DR3 (110). Furthermore, the observation that AIDDM has been detected before, and less often after, the diagnosis and treatment of celiac disease has been taken as indirect evidence that a gluten-free diet protects from autoimmune diseases in celiac patients (76).
Recently, Ventura et al. (228) examined the relationship between the prevalence of autoimmune diseases and the duration of exposure to gluten. They observed that the development of autoimmune conditions was related to the age at diagnosis of celiac disease, which again was virtually the same as the time of gluten exposure. The number of autoimmune conditions in those celiac patients in whom the gluten-free diet was adopted in early childhood (5.1%) was not significantly different from that of controls (2.8%). By contrast, in celiac patients who had started a gluten-free diet at the age of 10 yr or more, the frequency of autoimmune conditions was significantly increased (23.6%). Age at diagnosis of celiac disease was the only independent predictor for the development of autoimmune conditions. The authors suggested that an early diagnosis and treatment of celiac disease might protect against the development of autoimmune diseases.
Since this observation, there has been an ongoing discussion as to whether a gluten-containing diet is involved in the pathogenesis of autoimmune conditions in genetically susceptible, i.e., in HLA DQ2 and DQ8, individuals. A solution remains to be reached, because there are now reports for and against the hypothesis of Ventura et al. (228).
Diabetes-related GAD, islet cell antibodies, and insulin antibodies have been reported to occur in patients with celiac disease. In the study by Di-Mario et al. (229), 27% of 15 patients with untreated celiac disease had insulin antibodies, compared with 20% in 15 treated patients and in 0% of controls. Elsewhere, GAD and islet cell antibodies have also been found in 23% of 30 (230), and in 6.8% of 44 (231) celiac patients, who had been on a gluten-free diet. It is not known whether these antibodies in celiac patients are predictive of subclinical pancreatic damage and forthcoming AIDDM or whether they are simply indicators of a more general autoimmune diathesis. Toscano et al. (116) observed that thyroid peroxidase and other endocrine-related antibodies were more often and with higher titers elevated in untreated than in treated celiac disease patients: in 52.6% and 20%, respectively.
Ventura et al. (228) used an approach that would appear to strengthen their hypothesis that gluten is directly involved in the development of autoimmune conditions. They showed that diabetes-related antibodies, present in adolescents with untreated celiac disease, disappear when patients are put on a gluten-free diet (232). GAD, islet cell, and insulin antibodies were present in 11 (11.1%) of 90 newly detected celiac patients. During the gluten-free diet, all 11 became negative for these antibodies within 24 months. The glucose tolerance test was normal in all individuals having initially diabetes-related antibodies. Similarly, thyroid antibodies were present in 14.4% when on a normal diet, but in only 2.2% after gluten-free dietary treatment.
By contrast, the data presented by Sategna-Guidetti et al. (117, 233) on the prevalence of thyroid involvement in adult celiac disease did not unequivocally support the above mentioned hypothesis. They investigated thyroid function outcome in 128 patients with celiac disease, who had been placed on a gluten-free diet 1 yr earlier (117). The dietary compliance was not good, because only 57% showed a mucosal recovery. Nevertheless, thyroid function improved in three of five with subclinical autoimmune hypothyroidism; two were compliant with the diet. Of the 16 patients with euthyroid autoimmune thyroiditis, three developed subclinical hypothyroidism and one developed subclinical hyperthyroidism (three were noncompliant). On the other hand, two of 91 patients who initially had no signs of thyroiditis developed euthyroid autoimmune thyroiditis, and one developed subclinical hyperthyroidism while maintaining a gluten-free diet. Moreover, the authors observed that it was the age of patients and not the duration of gluten exposure that predicted the occurrence of autoimmune diseases in celiac patients (233). One problem seems to lie in defining the time of actual gluten exposure, which should also include periods of dietary lapses after the diagnosis of celiac disease. Furthermore, it is difficult to estimate the actual gluten exposure before the development of autoimmune diseases: these conditions may have existed subclinically for many years, which again means that the gluten exposure time needed for the manifestation of autoimmune condition will be overestimated. Extensive prospective follow-up studies are clearly indicated here. Meanwhile, in the absence of evidence to the contrary, it seems justified to detect and treat celiac disease as early as possible.
VII. Bone and Celiac Disease
It has long been recognized that osteomalacia, osteoporosis, bone pain, and fractures are complications of celiac disease (132). Even here, the clinical spectrum of celiac disease has changed. Osteomalacia and severe bone disease are relatively rare, whereas a low BMD seems to follow dermatitis herpetiformis as the most common extraintestinal manifestation of the disease. This has been ascertained in several cross-sectional and prospective studies (Table 7).
BMD in celiac disease
| Authors (Ref.) | No. of celiac disease patients | BMD in untreated celiac disease | BMD on gluten-free diet | Other remarks | |
|---|---|---|---|---|---|
| Molteni et al., 1990 (234) | 29 untreated; 23 treated | Adolescents and adults | Decreased | Similar to controls | 14 of 29 untreated patients had subclinical celiac disease |
| Bode et al., 1991 (235) | 22 treated | Adults | No data | Decreased | BMD did not correlate to symptoms or strictness of the diet |
| Mora et al., 1993 (236) | 33 untreated; 14 treated | Children | Decreased | Improvement | |
| Mazure et al., 1994 (237) | 8 untreated (asymptomatic); 20 untreated (symptomatic); 14 treated | Adults | In symptomatic decreased more than in asymptomatic | Similar to untreated asymptomatic patients | |
| Valdimarsson et al., 1994 (238) | 13 treated (villous atrophy); 17 treated (normal mucosa) | Adults | No data | Lower in patients with persistent villous atrophy | BMD correlated to adherence to diet and presence of villous atrophy; D vitamin lower in patients with villous atrophy |
| McFarlane et al., 1995 (239) | 55 treated | Adults | No data | Decreased in 20% of patients | Low BMD correlated to low body mass index and low calcium intake |
| Pistorius et al., 1995 (240) | 81 treated | Adults (female) | No data | Decreased in postmenopause | |
| Corazza et al., 1995 (7) | 17 untreated; 14 treated | Adults | Decreased | Improvement | Bone turnover increased in untreated, decreased during the diet |
| Walters, 1994 (241) | 10 untreated; 14 treated | Adults | Decreased | Decreased in some | 7 of 8 treated patients with low BMD had villous atrophy |
| McFarlane et al., 1996 (242) | 21 before and after treatment (1 yr) | Adults | Decreased | Improvement, but still low | |
| Valdimarsson et al., 1996 (33) | 63 before and after treatment (1 yr) | Adults | Decreased | Improvement, but still low | Improvement in serum vitamin D, PTH,a Afos,b and calcium levels during diet |
| Corazza et al., 1996 (243) | 14 untreated (asymptomatic); 10 untreated (symptomatic); 8 treated | Adults | In symptomatic decreased more than in asymptomatic | In asymptomatic similar to controls, in symptomatic low in some cases | |
| Mautalen et al., 1997 (244) | 14 patients before and after treatment (1 yr) | Adults | Decreased | Improvement, but still low in some cases | Bone turnover decreased during diet; calcium and vitamin D substitution did not further improve BMD |
| Ciacci et al., 1997 (245) | 41 before and after treatment (1 yr) | Adults | Decreased | Improvement, but still low in some cases | |
| Smecuol et al., 1997 (246) | 25 before and after treatment (37 months) | Adults | Decreased | Improvement, but still low in some cases | Improvement of BMD especially on strict diet |
| Scotta et al., 1997 (247) | 66 before and after treatment (1–2 yr) | Children | Decreased | Normalization with strict diet | |
| Mora et al., 1998 (248) | 44 before and after treatment (1 yr) | Children | Decreased | Normalization with a strict diet | |
| Kemppainen et al., 1999 (249) | 28 before and after treatment (1–5 yr) | Adults | Decreased | Improvement within 1 yr in most cases | PTH normalized during the diet |
| Selby et al., 1999 (250) | 35 treated | Adults | No data | Decreased | Decreased BMD related to secondary hyperparathyroidism |
| Mora et al., 1999 (251) | 30 treated | Children | No data | Similar to controls | BMD normal in children with long-term diet |
| Mustalahti et al., 1999 (252) | 19 asymptomatic before and after treatment (1 yr); 30 symptomatic | Adults | Decreased in asymptomatic and symptomatic | Improvement | |
| Sategna-Guidetti et al., 2000 (253) | 86 before and after treatment (1–2 yr) | Adults | Decreased | Improvement | Bone turnover increased in untreated cases, improved during diet |
| Valdimarsson et al., 2000 (254) | 105 before and after treatment (1–3 yr) | Adults | Decreased | Improvement, low in those with initially secondary hyperparathyroidism | Low BMD associated with secondary hyperparathyroidism |
| Mora et al., 2001 (32) | 19 before and after treatment (1–4 yr) | Children | Decreased | Improvement |
Parathyroid hormone.
Alkaline phosphatase.
In a recent study of 128 North American patients, who had been on gluten-free diet from 0 months to 46 yr (mean, 7.5 yr), osteoporosis (T score < −2.5) was present in 34% of the patients at the lumbar spine, 27% at the femoral neck, and 32% at the radius (255). Evidence shows that osteoporosis and osteopenia are alleviated on a gluten-free diet, although not always completely. Even children may carry an increased risk of osteopenia, which in this age group, however, seems to be cured completely with an appropriate diet (32, 251).
There are fewer data on the occurrence of celiac disease in patients with osteoporosis. Lindh et al. (256) found biopsy-proven celiac disease in 3.2% of patients suffering from osteoporosis. They used the IgA antigliadin antibody test, which may yield a number of false negative results. Recently, Nuti et al. (257) found IgA class antitissue transglutaminase antibodies in 9.4% of patients with osteoporosis. Unfortunately, no more than 10 of 24 antibody-positive patients underwent small-bowel biopsy, and only six (2.4%) had biopsy-proven celiac disease. Mather et al. (258) in their series of 96 patients with idiopathic low BMD found seven (7.3%) to be positive for antiendomysial antibodies at low titers, but none had small-bowel villous atrophy. In these two studies, the specificity of antitissue transglutaminase and antiendomysial antibody test, respectively, was low. In the absence of villous atrophy, it is possible that positive test results forecast the early onset of celiac disease (latent stage), and villous atrophy will appear later (258). Clearly, more studies are needed to estimate the prevalence of silent celiac disease in patients suffering from low BMD. On the other hand, it seems that the risk of low BMD is by no means reduced in adults with symptom-free celiac disease (252, 259).
A study carried out in Argentina (260) showed that patients with celiac disease seem to have an increased risk of fractures. Twenty-five per cent of 165 celiac patients had experienced one or more fractures, compared with 8% of 165 hospital controls. The risk seemed to be associated with poor adherence to a gluten-free diet and late diagnosis of celiac disease. The majority of fractures occurred before the diagnosis of celiac disease.
The mechanisms of disturbances in bone metabolism in celiac disease are poorly understood. The initial and probably main event is calcium malabsorption (261), which is primarily caused by villous atrophy (238) and secondarily by coexisting vitamin D deficiency (243, 249). Impaired intestinal calcium malabsorption leads to secondary hyperparathyroidism, which is often present and may serve to asseverate the bone disease by increasing bone turnover (7, 243, 250, 253, 254). Consequently, markers of bone formation (serum osteocalcin, bone alkaline phosphatase, carboxy-terminal propeptide of type I procollagen) and bone resorption (serum type I carboxy-terminal telopeptide, urinary N- and C-terminal telopeptides of type I collagen, pyridinolines) are often increased (7, 250, 262).
IGF is involved in the regulation of bone metabolism: circulating levels have been reported to be low in osteoporosis (263). It is uncertain whether this plays any pathogenetic role or simply constitutes a secondary phenomenon to malabsorption. As discussed earlier, there is now evidence that celiac disease is associated with infertility. In women, celiac disease can lead to amenorrhea and early menopause (264), which are associated with high risk for osteoporosis. Direct adverse immunological effects of gluten on bone are not excluded; similar mechanisms have been suggested to be involved in the development of enamel defects in the permanent teeth in untreated celiac disease (265). There are no studies to date to support this hypothesis.
VIII. Discussion
A. Time to change clinical practice
It is obvious that a number of patients with diverse endocrinological disorders suffer from celiac disease, the symptoms of the disease being sometimes, if not mostly, subtle or atypical. For this reason the majority of patients remain undetected. The diagnosis of celiac disease is based on intestinal biopsy samples usually taken by upper gastrointestinal endoscopy. Many individuals consider this investigation unpleasant and inconvenient. Fortunately, endoscopy can now be limited to subjects with a great likelihood of celiac disease and those found positive in screening surveys. For initial screening purposes, up-to-date serological tests, IgA class antiendomysial and antitissue transglutaminase antibodies, are highly specific and sensitive enough in cases in which symptoms do not clearly indicate celiac disease.
There is some evidence that the dietary treatment improves the quality of life in silent celiac disease (266), and that even asymptomatic patients with celiac disease may suffer from osteopenia or osteoporosis (252, 259). The natural course of silent celiac disease remains poorly understood. It is not yet unanimously accepted that population-based screening programs for celiac disease should be carried out. However, it is a different issue to employ screening in individuals known to run an increased risk of the disease. For several reasons, autoimmune endocrine diseases belong without doubt to such a risk group. First, it is expected that screening will yield positive results in this group more (3–5%) than in an unselected population (0.3–1.0%). Second, it is often possible to confuse symptoms of thyroid dysfunction, for instance, with those of celiac disease. Third, both patients with endocrinological disorders and those with celiac disease run an increased risk of osteopenia, which is possible to prevent and even treat by means of a gluten-free diet, provided that the proper diagnosis of gluten intolerance is made. Moreover, gluten-free dietary treatment, in some cases, will be of benefit in associated conditions, e.g., in infertility or miscarriage problems (152). Nor can the risk of lymphoma be ignored (6), although its likelihood would seem to be low in symptom-free celiac disease (267); the same applies to neurological complications.
In celiac disease, we have an effective dietary treatment that enables the patient to live a normal life. Even though large cost-benefit analyses are still lacking, there seems to be a good case for the following recommendation. All patients with AIDDM, autoimmune thyroid diseases, or Addison’s disease or those with multiple endocrinological disorders should undergo serological screening for celiac disease. Celiac disease should be considered in patients with osteoporosis (255), even when there are no signs of vitamin D deficiency or hypocalcemia.
Harewood and Murray (268) have shown that the endomysial antibody test is less expensive in screening for celiac disease in a population where the expected prevalence of the disease is approximately 5–10%; the costs of the antitissue transglutaminase test were not analyzed in this study. Whether to select IgA class antiendomysial or antitissue transglutaminase antibody as a screening assay depends on the facilities of local laboratories; the combination of these two tests increases the sensitivity of screening without incurring any significant loss of specificity. A positive antibody result should always be verified by small-bowel biopsy. Biopsy should similarly be considered whenever the clinical suspicion of celiac disease is high: celiac patients with IgA deficiency and a few other cases (Table 1) remain antibody negative. The concept of latent celiac disease is not yet fully understood. At the moment, we recommend that antiendomysial and antitissue transglutaminase antibody-positive patients without small-bowel villous atrophy should continue on a gluten-containing diet and be kept under surveillance. In patients that remain antibody positive, a repeat biopsy should be carried out, for instance within 1–3 yr depending on symptoms.
In celiac patients, on the other hand, thyroid function should be assessed at the time of diagnosis and always when there is even minor clinical suspicion of thyroid dysfunction. Hypopituitarism or Addison’s disease appear not to be as rare in celiac disease patients as in the general population; therefore, these conditions should be remembered when celiac patients have any symptoms suggestive of them.
Ideally, BMD should be investigated in all patients with celiac disease. In this way, calcium and vitamin D supplementation could be precisely targeted. The detection of osteopenia or osteoporosis would further be important when considering specific treatments of osteoporosis. Furthermore, motivation to maintain a gluten-free diet, especially in subjects with low BMD, is essential.
B. Future aspects
Cost-benefit analyses of screening for celiac disease in risk groups or in the whole population are warranted, and the importance of measuring health-related quality of life should be recognized. The impact of early diagnosis and gluten-free dietary treatment on the occurrence of autoimmune endocrinological conditions should be further investigated in prospective surveys. These should comprise individuals with silent and developing latent celiac disease. Research into common genetic involvement in endocrine conditions and celiac disease should be carried out. The finding that tissue transglutaminase is the target for celiac antibodies makes it possible to study the role of this enzyme in nonintestinal organ-specific involvements in celiac individuals. This may make possible, in the future, specific treatments of celiac complications, such as osteoporosis or infertility, and perhaps even prevent the development of autoimmune conditions. The development of curative treatment in celiac disease is still far away. It is as difficult to induce oral tolerance as it is to block the T cell response to gluten. Serious side effects prevent the use of immunosuppressive drugs in clinical practice. The development of wheat free of toxic peptides may be possible, but at the risk of losing its baking properties (227).
C. Conclusions
There is no doubt that many patients with celiac disease primarily contact specialists other than gastroenterologists. The majority of cases thus remain undetected. A close association between various autoimmune endocrinological disorders and celiac disease has been shown in numerous studies. The diagnosis of celiac disease requires a small-bowel biopsy, usually taken by endoscopy. However, sensitive and specific antibody assays, the antiendomysial and antitissue transglutaminase tests, are helpful in preliminary screening for gluten intolerance in cases where symptoms are atypical, appear outside the gastrointestinal tract, or are totally absent. The need to prevent osteoporosis advocates the early diagnosis and treatment of even asymptomatic celiac disease. The benefits of screening for celiac disease in autoimmune disease remain to be proved by prospective follow-up studies. However, there seems to be a good case for extensive screening.
This work was supported by grants from the Medical Research Fund of Tampere University Hospital, the Sigrid Juselius Foundation, the Maud Kuistila Foundation, and the Yrjö Jahnsson Foundation.
Abbreviations:
- AIDDM,
Autoimmune insulin-dependent diabetes mellitus;
- BMD,
bone mineral density;
- GAD,
glutamate decarboxylase antibodies associated with diabetes;
- HLA,
human leukocyte antigen;
- MMP,
matrix metalloproteinase.
van
