


Abstract
Amiodarone (AD) is a highly efficient antiarrhythmic drug with potentially serious side effects. Severe pulmonary toxicity is reported in patients receiving AD even at low doses and may cause interstitial pneumonia as well as lung fibrosis. Apoptosis of alveolar epithelial type II cells (AECII) has been suggested to play an important role in this disease. In the current study, we aimed to establish a murine model of AD-induced lung fibrosis and analyze surfactant homeostasis, lysosomal, and endoplasmic reticulum (ER) stress in this model. AD/vehicle was instilled intratracheally into C57BL/6 mice, which were sacrificed on days 7, 14, 21, and 28. Extent of lung fibrosis development was assessed by trichrome staining and hydroxyproline measurement. Cytotoxicity was assessed by lactate dehydrogenase assay. Phospholipids (PLs) were analyzed by mass spectrometry. Surfactant proteins (SP) and markers for apoptosis, lysosomal, and ER stress were studied by Western blotting and immunohistochemistry. AECII morphology was evaluated by electron microscopy. Extensive lung fibrosis and AECII hyperplasia were observed in AD-treated mice already at day 7. Surfactant PL and SP accumulated in AECII over time. In parallel, induction of apoptosis, lysosomal, and ER stress was encountered in AECII of mice lungs and in MLE12 cells treated with AD. In vitro, siRNA-mediated knockdown of cathepsin D did not alter the AD-induced apoptotic response. Our data suggest that mice exposed to intratracheal AD develop severe pulmonary fibrosis, exhibit extensive surfactant alterations and cellular stress, but AD-induced AECII apoptosis is not mediated primarily via cathepsin D.
Amiodarone (AD) is an iodinated benzofuran derivative and falls under the class III antiarrhythmic drugs. Although proven highly efficient in controlling cardiac arrhythmias, its clinical use is mainly limited by its adverse effects (Chang et al., 2007; Okayasu et al., 2006). Black box warnings of AD include hypo and hyper thyroidism, corneal micro deposits, dermatitis, symptomatic bradycardia, and most importantly, severe pulmonary toxicity (Chang et al., 2007). The frequency of pulmonary toxicity in patient cohorts receiving high dose of AD (≥400 mg/day) has been estimated at 10–17%, with fatalities occurring in about 10% of cases with pulmonary toxicity (Ott et al., 2003). Low dose of AD (200 mg/day) was believed to be relatively safe, but increasing evidence suggests the risk of pulmonary complications, especially lung fibrosis, even in low dosage treatment group of patients. Apart from pulmonary fibrosis, pneumonitis and acute respiratory distress syndrome (ARDS) are also well documented as potential side effects of AD (Chang et al., 2007; Charles et al., 2006). According to a statistical analysis published in 1999 (Connolly, 1999), AD accounted for 24.1% of the total antiarrhythmic prescriptions in 1998. But its usage has drastically increased in the last decade. After considering its risk factors, clinicians use AD to treat atrial fibrillation (in the absence of pre-excitation) when other agents are either contra-indicated or have failed (January et al., 2014). More recently, follow-up drugs have been developed such as dronedarone, which has been suggested to cause less lung, liver, and thyroid toxicity (Zimetbaum, 2009). Unfortunately, dronedarone not only caused over-mortality in a group of patients with depressed left ventricular function (Kober et al., 2008) but it also appeared to be less efficient in controlling atrial fibrillation in a head-to-head comparison study with AD (Le Heuzey et al., 2010). For this reason AD still represents the preferred drug.
Pathogenic and molecular events underlying AD-induced pulmonary toxicity are not clearly settled but may include direct cytotoxicity (Ashrafian and Davey, 2001), excessive intracellular phospholipid (PL) accumulation (Martin et al., 1989), alterations in the angiotensin signaling pathway (Uhal et al., 2007), generation of oxidants (Sarma et al., 1997), and inflammatory reactions (Wilson et al., 1991). In fact, AD is toxic to several types of lung cells in vitro (Bargout et al., 2000; Chiovato et al., 1994). Apart from these, it is known that AD gets enriched in lysosomes (∼500-fold as compared with serum) and causes accumulation of multilamellar bodies in the cytoplasm of various cell types (Somani et al., 1987).
A murine model for AD-induced lung fibrosis has not been described, with the exception of one recent study where an alkaloid, neferine, was reported to exert protective effects in AD-treated mice (Niu et al., 2013). However, a systematic analysis of the ongoing cellular stress mechanisms in mice in response to amiodarone treatment is missing. The purpose of this study is to establish a mouse model of AD-induced pulmonary fibrosis and systematically analyze the surfactant alterations, lysosomal, and endoplasmic reticulum (ER) stress in this model.
MATERIALS AND METHODS
Mice
Intratracheal administration of vehicle or amiodarone (0.8 mg/kg body weight, Sigma-Aldrich, Germany) was performed in C57BL/6 mice every fifth day as detailed in the online supplement. Altogether, 10 mice per each group were included. Mice were sacrificed according to standard lab procedures as described before (Mahavadi et al., 2010). Both the University Animal Care Committee and the Federal Authorities for Animal Research of the Regierungspraesidium Giessen (Hessen, Germany) approved the study protocol.
Lung compliance, histology, and electron microscopy
Mice were subjected to lung compliance measurement as described in the online supplement. Mice were sacrificed 7 and 14 days after first AD or vehicle challenge for perfusion fixation. In order to represent the whole organ a systematic uniform sampling was performed. Tissue blocks designated to transmission electron microscopy were embedded in epoxy resin. Detailed protocols are described in the online supplement.
Biochemical analysis
PLs analysis and characterization of large surfactant aggregates (LAs) was undertaken as described before (Mahavadi et al., 2010). Bronchoalveolar lavage (BAL)-derived LAs were isolated by highspeed centrifugation (48,000 × g, 1 h, 4°C, Sorvall centrifuge). LA preparations were re-assessed for PL content (as described in the online supplement) and related to the originally centrifuged amount of PLs (indicating the% of LA in the original BALF). Lipids were quantified by electrospray ionization–tandem mass spectrometry in positive ion mode (Mahavadi et al., 2010). Lipid species were annotated according to the recently published proposal for shorthand notation of lipid structures that are derived from mass spectrometry (Liebisch et al., 2013). Details about lactate dehydrogenase (LDH) assay, Western blot, immunohistochemistry, and source of antibodies are given in the online supplement.
Cell culture
Mouse lung epithelial cell lines (MLE12) were cultured as described before (Mahavadi et al., 2010). Preparation of AD solution and protocols for immunofluorescence and siRNA transfection are given in the online supplement.
Statistics
All data are expressed as means ± SEM of at least five mice for in vivo studies. For in vitro experiments, three or more independent experiments were conducted for AD treatment and triplicate transfections were performed for siRNA studies. Statistical significance was assessed employing Mann-Whitney U test. Significance is indicated as *p < 0.5, **p < 0.01, ***p < 0.001.
RESULTS
Development of Lung Fibrosis in Mice after AD Treatment
C57/Bl6 mice treated intratracheally with AD employing a microsprayer displayed significantly lowered lung compliance as compared with the vehicle-treated mice (Fig. 1A). AD treatment resulted in a significant increase in lung hydroxyproline levels compared with the vehicle-treated mice (Fig. 1B), reaching significance at day 14. Septal thickening, patchy interstitial lung fibrosis, lymphoplasmacellular infiltration, extracellular matrix deposition, areas of dense fibrosis, and areas with roughly preserved lung structure with increased AECII size were observed in AD-treated mice, right from day 7 onward (Figs. 1C and 1D). Trichrome staining of lung sections confirmed increased collagen deposition by day 7 post AD treatment (Fig. 1E). Electron microscopy demonstrated fragmentation of the alveolar lining with denudation of the basal lamina as well as interstitial edema at day 7 (Fig. 1F), which was supported by the observation of increased lung wet weight following AD treatment (Supplementary Data). At day 14, an increase in collagen fibrils within thickened septal wall tissue was the most prominent finding (Fig. 1F, Supplementary Data). Differential cell counts revealed a modest neutrophilic alveolitis starting at day 7, which persisted over the entire observation period (Supplementary Data).
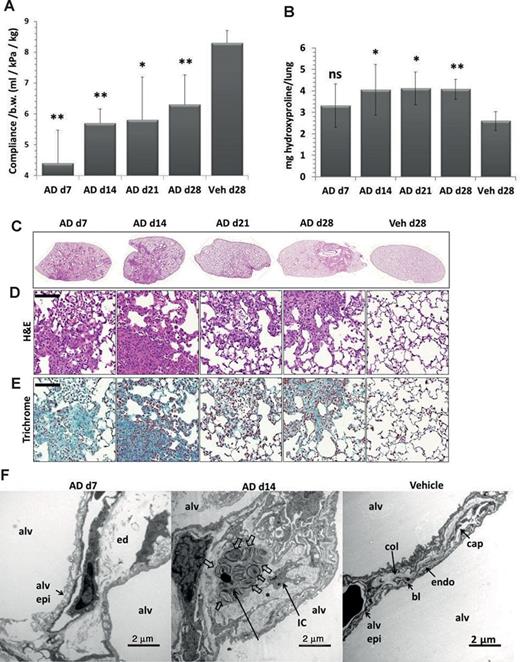
Development of pulmonary fibrosis in AD-treated mice. (A) Graphical representation of dynamic lung compliance showing a significant decrease in AD-treated mice as compared with vehicle-treated controls. (B) Hydroxyproline measurement of total right lungs showing a significant increase in AD-treated mice as compared with vehicle-treated mice. (C–E) Representative H&E (C and D) and trichrome stainings (E) of complete left lungs (C) and higher magnification images (D, E) of days 7, 14, 21, and 28 AD and day 28 vehicle-treated mice showing patchy fibrosis in AD-treated mice. Scale = 100 μm, original magnification: ×200. (F) Representative transmission electron microscopic images: Fragmentation of the alveolar lining (alv epi) and denudation of basal lamina was a typical finding in d7 AD-treated mice. Interstitial edema (ed) is also visible. At d14, septal wall thickening was a consequence of deposition of collagen fibrils (asterisk) and interstitial cells (IC). Profiles of AECII containing lamellar bodies (block arrows) were observed within thickened septal walls. Vehicle-treated mice lungs showed no signs of injury or fibrosis; septal walls were slim and collagen (col) could be located on the “thick” side of the blood-gas barrier. The thin side consisted of alveolar epithelium (alv epi), basal lamina (bl), and endothelium (endo). Alv: alveolar airspace. Scale = 2 μm. *p < 0.5, **p< 0.05, n = 5 mice per group and three independent experiments were performed.
Lung Tissue Damage and Altered Surfactant Homeostasis in AD-Treated Mice
We observed a significant increase in total protein concentration and a significant increase in LDH activity in bronchoalveolar lavage fluids (BALF) (Figs. 2A and 2B) of AD-treated mice as compared with vehicle-treated control mice, indicating an increase in lung cell permeability and lung tissue damage respectively. Parallely, we observed a significant increase in total PLs in BALF of AD- versus vehicle-treated mice (Fig. 2C), with a significant reduction in the relative content of LAs seen at day 7, but not at later time points (Fig. 2D). In agreement, lipidomic analysis of the alveolar surfactant pool forwarded modest changes in the PL profile (Table 1), but distinct changes in the fatty acid profiles, with a significant reduction in the relative amount of dipalmitoylphosphatidylcholine (DPPC) as well as saturated PC and a corresponding increase in unsaturated PC (Table 2). Likewise, saturated phosphatidylglycerol (PG) was significantly reduced at the favor of unsaturated PG species (Table 2). PE-based plasmalogens were increased in AD-treated mice as compared with vehicle-treated mice (Table 3). Analysis of mature forms of surfactant proteins (SP) B and C in BALF of AD- and vehicle-treated mice did not forward any significant differences (Fig. 2E). Taken together, we observed significant cell damage and analysis of the alveolar surfactant pool after AD treatment forwarded significant changes only with regard to PL components.
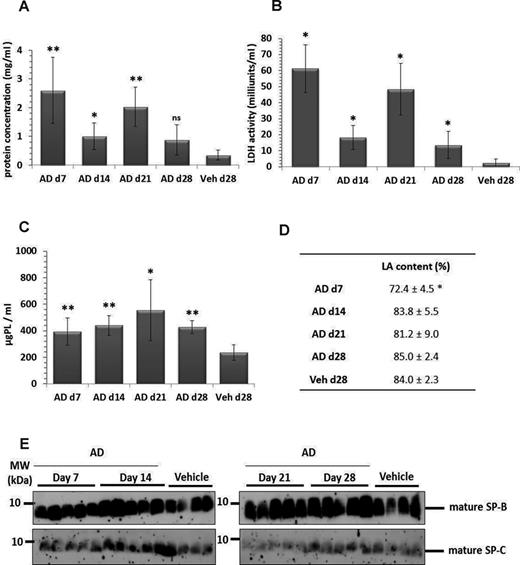
Lung injury and increased surfactant in BAL fluid of AD-treated mice. Graphical representation of (A) total protein concentration and (B) LDH activity in BAL fluid from days 7, 14, 21, and 28 AD and day 28 vehicle-treated mice. (C) Total PLs were extracted from BAL fluid of AD (days 7, 14, 21, and 28) and vehicle-treated mice (day 28). The final concentrations were calculated as ‘per ml’ BAL fluid. (D) Data set indicating relative amount of large surfactant aggregates (LA content, given as a percentage of total PL) in BAL fluid of AD- and vehicle-treated mice. (E) Western blot analysis of mature surfactant protein (SP)-B and mature SP-C in BAL fluid of AD- and vehicle-treated mice. *p < 0.05, **p < 0.01; n = 5 mice per group and three independent experiments were performed.
PL Profile in BAL Fluid from AD- and Vehicle-Treated Mice
| BAL | %PC | %SM | %PE | %PE P | %PS | %PG | %PI | %LPC | %Cer | %CE | %FC |
|---|---|---|---|---|---|---|---|---|---|---|---|
| AD d7 | 67.99 ± 0.01** | 0.80 ± 0.12 | 1.00 ± 0.06 | 1.23 ± 0.10* | 1.45 ± 0.17 | 9.12 ± 0.50 | 2.06 ± 0.26 | 0.93 ± 0.24 | 0.12 ± 0 | 0.77 ± 0.22 | 14.6 ± 1.1** |
| AD d14 | 70.85 ± 0.35 | 0.31 ± 0 | 0.9 4 ± 0.01 | 0.90 ± 0.02 | 0.93 ± 0.02 | 11.81 ± 0.10 | 1.59 ± 0.04 | 0.37 ± 0.01 | 0.07 ± 0 | 0.18 ± 0 | 12.0 ± 0.3 |
| AD d21 | 70 ± 0.58 | 0.51 ± 0.04 | 0.90 ± 0 | 0.94 ± 0.02* | 0.90 ± 0.03 | 10.99 ± 0.23 | 1.54 ± 0.05 | 0.77 ± 0.11 | 0.14 ± 0 | 0.57 ± 0.17 | 12.7 ± 0.5 |
| AD d28 | 71.91 ± 0.38** | 0.32 ± 0.01 | 0.90 ± 0.01 | 0.85 ± 0.01 | 0.8 1± 0.01 | 12.02 ± 0.22 | 1.72 ± 0.12 | 0.48 ± 0.06 | 0.07 ± 0 | 0.19 ± 0.03 | 10.7 ± 0.4** |
| Veh d28 | 68.91 ± 0.17 | 0.36 ± 0.02 | 0.889 ± 0.05 | 0.74 ± 0.06 | 0.73 ± 0.03 | 11.83 ± 0.3 | 1.52 ± 0.09 | 0.71 ± 0.1 | 0.10 ± 0 | 0.23 ± 0.02 | 13.9 ± 0.1 |
Note. Depicted here are the relative percentages of different PL classes in the BAL fluid of AD- and vehicle-treated mice at the indicated time points. Values are represented as means ± SEM, p-value summary: *p < 0.05, **p < 0.01. Where significance is not mentioned, values are considered as being not significant. Per group, n = 5 mice were analyzed. SM, Sphingomyelin; PC, Phosphatidylcholine ; LPC, Lysophosphatidylcholine ; PE, Phosphatidylethanolamine; PE P, PE-based plasmalogens; PG, Phosphatidylglycerol; PS, Phosphatidylserine; Cer, Ceramides; CE, Cholesteryl esters; FC, Free cholesterol.
| BAL | %PC | %SM | %PE | %PE P | %PS | %PG | %PI | %LPC | %Cer | %CE | %FC |
|---|---|---|---|---|---|---|---|---|---|---|---|
| AD d7 | 67.99 ± 0.01** | 0.80 ± 0.12 | 1.00 ± 0.06 | 1.23 ± 0.10* | 1.45 ± 0.17 | 9.12 ± 0.50 | 2.06 ± 0.26 | 0.93 ± 0.24 | 0.12 ± 0 | 0.77 ± 0.22 | 14.6 ± 1.1** |
| AD d14 | 70.85 ± 0.35 | 0.31 ± 0 | 0.9 4 ± 0.01 | 0.90 ± 0.02 | 0.93 ± 0.02 | 11.81 ± 0.10 | 1.59 ± 0.04 | 0.37 ± 0.01 | 0.07 ± 0 | 0.18 ± 0 | 12.0 ± 0.3 |
| AD d21 | 70 ± 0.58 | 0.51 ± 0.04 | 0.90 ± 0 | 0.94 ± 0.02* | 0.90 ± 0.03 | 10.99 ± 0.23 | 1.54 ± 0.05 | 0.77 ± 0.11 | 0.14 ± 0 | 0.57 ± 0.17 | 12.7 ± 0.5 |
| AD d28 | 71.91 ± 0.38** | 0.32 ± 0.01 | 0.90 ± 0.01 | 0.85 ± 0.01 | 0.8 1± 0.01 | 12.02 ± 0.22 | 1.72 ± 0.12 | 0.48 ± 0.06 | 0.07 ± 0 | 0.19 ± 0.03 | 10.7 ± 0.4** |
| Veh d28 | 68.91 ± 0.17 | 0.36 ± 0.02 | 0.889 ± 0.05 | 0.74 ± 0.06 | 0.73 ± 0.03 | 11.83 ± 0.3 | 1.52 ± 0.09 | 0.71 ± 0.1 | 0.10 ± 0 | 0.23 ± 0.02 | 13.9 ± 0.1 |
Note. Depicted here are the relative percentages of different PL classes in the BAL fluid of AD- and vehicle-treated mice at the indicated time points. Values are represented as means ± SEM, p-value summary: *p < 0.05, **p < 0.01. Where significance is not mentioned, values are considered as being not significant. Per group, n = 5 mice were analyzed. SM, Sphingomyelin; PC, Phosphatidylcholine ; LPC, Lysophosphatidylcholine ; PE, Phosphatidylethanolamine; PE P, PE-based plasmalogens; PG, Phosphatidylglycerol; PS, Phosphatidylserine; Cer, Ceramides; CE, Cholesteryl esters; FC, Free cholesterol.
PC and PG Lipid Species in BAL Fluid from AD- and Vehicle-Treated Mice
| BAL | % sat PC | % PC 32:0 (DPPC) | % unsat PC | % alkyl PC | % sat PG | % unsat PG |
|---|---|---|---|---|---|---|
| AD d7 | 46.7 ± 1.2** | 38.2 ± 1.2** | 49.2 ± 1.2** | 4.21 ± 0.17 | 15.6 ± 1.2** | 84.3 ± 1.2** |
| AD d14 | 47.1 ± 0.4* | 37.1 ± 0.7** | 49.1 ± 0.4* | 3.77 ± 0.10 | 17.1 ± 0.2** | 82.8 ± 0.2** |
| AD d21 | 49.7 ± 0.2** | 41.8 ± 0.3** | 46.7 ± 0.2* | 3.51 ± 0.14 | 17.0 ± 0.3** | 82.9 ± 0.3** |
| AD d28 | 49.5 ± 0.3** | 39.6 ± 0.5** | 46.9 ± 0.4** | 3.53 ± 0.05 | 17.4 ± 0.3** | 82.5 ± 0.3** |
| Veh d28 | 54.21 ± 0.5 | 45.7 ± 0.7 | 42.2 ± 0.7 | 3.58 ± 0.15 | 21.3 ± 0.5 | 78.6 ± 0.5 |
Note. Depicted here are the relative percentages of different lipid species from PC & PG phospholipds in the BAL fluid of AD and vehicle treated mice at the indicated time points. PL species annotation is based on the assumption of even numbered carbon chains only. Values are represented as means ± SEM, p-value summary: *p< 0.05, **p< 0.01. Where significance is not mentioned, values are considered as being not significant. Per group, n = 5 mice were analyzed. PC, Phosphatidylcholine; DPPC, Dipalmitoylated PC; PG, Phosphatidylglycerol.
| BAL | % sat PC | % PC 32:0 (DPPC) | % unsat PC | % alkyl PC | % sat PG | % unsat PG |
|---|---|---|---|---|---|---|
| AD d7 | 46.7 ± 1.2** | 38.2 ± 1.2** | 49.2 ± 1.2** | 4.21 ± 0.17 | 15.6 ± 1.2** | 84.3 ± 1.2** |
| AD d14 | 47.1 ± 0.4* | 37.1 ± 0.7** | 49.1 ± 0.4* | 3.77 ± 0.10 | 17.1 ± 0.2** | 82.8 ± 0.2** |
| AD d21 | 49.7 ± 0.2** | 41.8 ± 0.3** | 46.7 ± 0.2* | 3.51 ± 0.14 | 17.0 ± 0.3** | 82.9 ± 0.3** |
| AD d28 | 49.5 ± 0.3** | 39.6 ± 0.5** | 46.9 ± 0.4** | 3.53 ± 0.05 | 17.4 ± 0.3** | 82.5 ± 0.3** |
| Veh d28 | 54.21 ± 0.5 | 45.7 ± 0.7 | 42.2 ± 0.7 | 3.58 ± 0.15 | 21.3 ± 0.5 | 78.6 ± 0.5 |
Note. Depicted here are the relative percentages of different lipid species from PC & PG phospholipds in the BAL fluid of AD and vehicle treated mice at the indicated time points. PL species annotation is based on the assumption of even numbered carbon chains only. Values are represented as means ± SEM, p-value summary: *p< 0.05, **p< 0.01. Where significance is not mentioned, values are considered as being not significant. Per group, n = 5 mice were analyzed. PC, Phosphatidylcholine; DPPC, Dipalmitoylated PC; PG, Phosphatidylglycerol.
Lipid Species of PE-Based Plasmalogens in BAL Fluid from AD- and Vehicle-Treated Mice
| BAL | PE P-16:0 | PE P-18:1 | PE P-18:0 | Total |
|---|---|---|---|---|
| AD d7 | 5.3 ± 0.8** | 0.50 ± 0.07** | 0.78 ± 0.10* | 6.6 ± 1.0** |
| AD d14 | 4.0 ± 0.1** | 0.27 ± 0.01* | 0.50 ± 0.01* | 4.7 ± 0.1** |
| AD d21 | 5.1 ± 0.5** | 0.42 ± 0.04* | 0.61 ± 0.04* | 6.1 ± 0.5** |
| AD d28 | 3.8 ± 0.5** | 0.22 ± 0.02 | 0.40 ± 0.04 | 4.4 ± 0.8** |
| Veh d28 | 1.7 ± 0.2 | 0.18 ± 0.01 | 0.32 ± 0.03 | 2.2 ± 0.3 |
Note. Depicted here are the nmol/ml PE-based plamsalogens in BAL fluid of AD- and vehicle-treated mice at the indicated time points. Values are represented as means ± SEM, p-value summary: *p < 0.05, ** p <0.01. Where significance is not mentioned, values are considered as being not significant. Per group, n = 5 mice were analyzed. PE P, PE-based plasmalogens.
| BAL | PE P-16:0 | PE P-18:1 | PE P-18:0 | Total |
|---|---|---|---|---|
| AD d7 | 5.3 ± 0.8** | 0.50 ± 0.07** | 0.78 ± 0.10* | 6.6 ± 1.0** |
| AD d14 | 4.0 ± 0.1** | 0.27 ± 0.01* | 0.50 ± 0.01* | 4.7 ± 0.1** |
| AD d21 | 5.1 ± 0.5** | 0.42 ± 0.04* | 0.61 ± 0.04* | 6.1 ± 0.5** |
| AD d28 | 3.8 ± 0.5** | 0.22 ± 0.02 | 0.40 ± 0.04 | 4.4 ± 0.8** |
| Veh d28 | 1.7 ± 0.2 | 0.18 ± 0.01 | 0.32 ± 0.03 | 2.2 ± 0.3 |
Note. Depicted here are the nmol/ml PE-based plamsalogens in BAL fluid of AD- and vehicle-treated mice at the indicated time points. Values are represented as means ± SEM, p-value summary: *p < 0.05, ** p <0.01. Where significance is not mentioned, values are considered as being not significant. Per group, n = 5 mice were analyzed. PE P, PE-based plasmalogens.
On the other hand, marked alterations of the intracellular surfactant pool were easily observed and consisted of a significant elevation of the tissue PLs (Fig. 3A) and a significant increase in the 42 kDa form of pro SP-B and a remarkable (5–10-fold) increase in mature SP-B, pro SP-C, and mature SP-C in AD-treated mice (Figs. 3B–D). Lipidomics analysis of lung tissue PLs revealed a significant increase in bis(monacylglycero)phosphate (BMP; also known as lysobisphosphatidic acid, LBPA), a PL that is present in the internal vesicles of multivesicular bodies (MVBs) and that has been suggested to be a biomarker of AD-induced phospholipidosis (Table 4) (Mortuza et al., 2003). In line with this observation, we also observed the increased number of profiles of MVBs within the AECII of AD-treated mice (Supplementary Data), as compared with vehicle-treated mice (Supplementary Data). Lipidomics analysis further revealed significant increase in cholesterol esters in AD-treated mice (Table 4). In addition, small, but significant changes in other PL classes in AD-treated mice lungs were observed (Table 4), overall supporting the concept that there was a substantial intracellular accumulation of mature surfactant compounds. In full agreement, electron microscopy showed larger and more prominent AECII in close neighborhood to areas of interstitial fibrosis suggesting hypertrophy and/or hyperplasia of this cell type. Additionally, lamellar bodies were increased in number and size whereas components of intra-alveolar surfactant appeared more abundant after AD treatment (Figs. 3E and F).
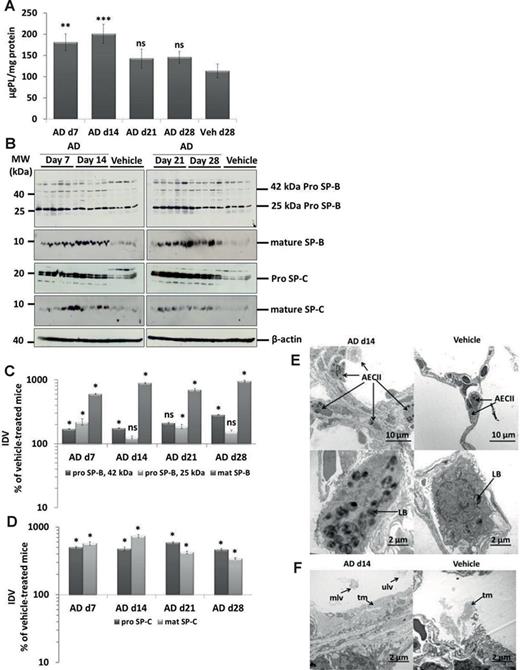
Accumulation of surfactant in AD-treated lung tissues. (A) Total PLs were extracted from lung tissue of all AD- and vehicle-treated mice. The resulting PL concentrations were normalized against their respective protein concentrations and values are expressed as micrograms of PLs per milligram of protein. (B) Western blot analysis of lung homogenates of (left) AD-treated mice at days 7,14 and vehicle at day 28 and (right) AD-treated mice at days 21, 28, and vehicle at day 28 for prosurfactant protein (SP)-B, mature SP-B, pro–SP-C, and mature SP-C. Representative blots are from n = 5 mice per group and results of three independent experiments are shown. (C and D) Densitometry was performed on all Western blot analyses. The target protein/β-actin ratio was calculated and is given as a percentage of the respective vehicle-treated controls. ***p < 0.001,**p < 0.01, *p < 0.05; n = 5 mice per group. Representative blots and analysis from n = 5 mice per group and three independent experiments are shown. (E) Representative transmission electron micrographs showing increased number and size of profiles of AECII (hyperplasia; arrows) d14 post AD challenge compared with vehicle-treated mice. AECII filled with abundant and enlarged profiles of lamellar bodies (LB) are shown. Scale bar = 10 μm (upper panel); 2 μm (lower panel). (F) Alveolar areas filled with surfactant in some areas appeared more prominent in AD-treated mice lungs (left panel) as compared with vehicle-treated mice lungs (right panel). tm, tubular myelin; mlv, multilamellated vesicles; ulv, unilamellated vesicles. Scale bar = 2 μm.
PL Profile in Lung Tissue from AD- and Vehicle-Treated Mice
| Tissue | %PC | %SM | %PE | %PE P | %PS | %PG | %PI | %BMP | %PA | %LPG | %CL | %LPC | %Cer | %CE | %FC |
|---|---|---|---|---|---|---|---|---|---|---|---|---|---|---|---|
| AD d7 | 42.17±1.13** | 6.12±0.09 | 7.95±0.17* | 11.36±0.35* | 17.35±0.67* | 4.23±0.20 | 7.95±0.37 | 0.18±0.03* | 0.05±0.01 | 0.56±0.11 | 0.07±0.03 | 0.87±0.03* | 1.15±0.09** | 0.98±0.14* | 23.07±0.42 |
| AD d14 | 44.02±0.86** | 5.77±0.16 | 7.04±0.15 | 11.47±0.26** | 16.47±0.50** | 5.05±0.32 | 6.79±0.09** | 0.26±0.01** | 0.01±0 | 0.70±0.08 | 0.23±0.03* | 1.15±0.04* | 1.02±0.02* | 0.87±0.11* | 21.73±0.28* |
| AD d21 | 44.35±1.11** | 5.58±0.15* | 6.85±0.20 | 10.43±0.34** | 15.32±0.48** | 7.54±1.0** | 6.96±0.21* | 0.16±0.01* | 0.03±0.01 | 0.62±0.09 | 0.10±0.03 | 1.10±0.04 | 0.97±0.05 | 0.78±0.08* | 20.42±0.30** |
| AD d28 | 42.52±1.0** | 6.01±0.18 | 7.10±0.16 | 11.97±0.27** | 17.84±0.50** | 4.42±0.35 | 7.16±0.12* | 0.17±0.01* | 0.02±0.01 | 0.64±0.05 | 0.16±0.01 | 0.96±0.05 | 1.02±0.02 | 0.59±0.08* | 22.13±0.29* |
| Veh d28 | 36.56±0.50 | 6.22±0.09 | 7.18±0.07 | 13.14±0.15 | 21.92±0.24 | 4.36±0.40 | 7.84±0.20 | 0.11±0 | 0.03±0.01 | 0.56±0.05 | 0.09±0.03 | 1.01±0.02 | 0.97±0.01 | 0.57±0.03 | 24.17±0.29 |
Note. Depicted here are the relative percentages of different PL classes in the lung tissue of AD- and vehicle-treated mice at the indicated time points. Glycerophospholipid species annotation is based on the assumption of even numbered carbon chains only. SM species were assigned, based on the assumption of a sphingoid base d18:1. Values are represented as means ± SEM, p-value summary: *p < 0.05, **p < 0.01. Where significance is not mentioned, values are considered as being not significant. Per group, n = 5 mice were analyzed. SM, Sphingomyelin; PC, Phosphatidylcholine ; LPC, Lysophosphatidylcholine ; PE, Phosphatidylethanolamine; PE P, PE-based plasmalogens; PS, Phosphatidylserine; PG, Phosphatidylglycerol; PI, Phosphatidylinositol; BMP, Bis(monacylglycero)phosphate; PA, Phosphatidic Acid; LPG, Lysophosphatidylglycerol; CL, Cardiolipin; LPC, Lysophosphatidylcholine ; Cer, Ceramides; CE, Cholesteryl esters; FC, Free cholesterol.
| Tissue | %PC | %SM | %PE | %PE P | %PS | %PG | %PI | %BMP | %PA | %LPG | %CL | %LPC | %Cer | %CE | %FC |
|---|---|---|---|---|---|---|---|---|---|---|---|---|---|---|---|
| AD d7 | 42.17±1.13** | 6.12±0.09 | 7.95±0.17* | 11.36±0.35* | 17.35±0.67* | 4.23±0.20 | 7.95±0.37 | 0.18±0.03* | 0.05±0.01 | 0.56±0.11 | 0.07±0.03 | 0.87±0.03* | 1.15±0.09** | 0.98±0.14* | 23.07±0.42 |
| AD d14 | 44.02±0.86** | 5.77±0.16 | 7.04±0.15 | 11.47±0.26** | 16.47±0.50** | 5.05±0.32 | 6.79±0.09** | 0.26±0.01** | 0.01±0 | 0.70±0.08 | 0.23±0.03* | 1.15±0.04* | 1.02±0.02* | 0.87±0.11* | 21.73±0.28* |
| AD d21 | 44.35±1.11** | 5.58±0.15* | 6.85±0.20 | 10.43±0.34** | 15.32±0.48** | 7.54±1.0** | 6.96±0.21* | 0.16±0.01* | 0.03±0.01 | 0.62±0.09 | 0.10±0.03 | 1.10±0.04 | 0.97±0.05 | 0.78±0.08* | 20.42±0.30** |
| AD d28 | 42.52±1.0** | 6.01±0.18 | 7.10±0.16 | 11.97±0.27** | 17.84±0.50** | 4.42±0.35 | 7.16±0.12* | 0.17±0.01* | 0.02±0.01 | 0.64±0.05 | 0.16±0.01 | 0.96±0.05 | 1.02±0.02 | 0.59±0.08* | 22.13±0.29* |
| Veh d28 | 36.56±0.50 | 6.22±0.09 | 7.18±0.07 | 13.14±0.15 | 21.92±0.24 | 4.36±0.40 | 7.84±0.20 | 0.11±0 | 0.03±0.01 | 0.56±0.05 | 0.09±0.03 | 1.01±0.02 | 0.97±0.01 | 0.57±0.03 | 24.17±0.29 |
Note. Depicted here are the relative percentages of different PL classes in the lung tissue of AD- and vehicle-treated mice at the indicated time points. Glycerophospholipid species annotation is based on the assumption of even numbered carbon chains only. SM species were assigned, based on the assumption of a sphingoid base d18:1. Values are represented as means ± SEM, p-value summary: *p < 0.05, **p < 0.01. Where significance is not mentioned, values are considered as being not significant. Per group, n = 5 mice were analyzed. SM, Sphingomyelin; PC, Phosphatidylcholine ; LPC, Lysophosphatidylcholine ; PE, Phosphatidylethanolamine; PE P, PE-based plasmalogens; PS, Phosphatidylserine; PG, Phosphatidylglycerol; PI, Phosphatidylinositol; BMP, Bis(monacylglycero)phosphate; PA, Phosphatidic Acid; LPG, Lysophosphatidylglycerol; CL, Cardiolipin; LPC, Lysophosphatidylcholine ; Cer, Ceramides; CE, Cholesteryl esters; FC, Free cholesterol.
AD Induces Apoptosis of AECII in Mice
Compared with the vehicle-treated mice, we observed a significant, fivefold increase in the cleaved form of caspase 3 in day 7 AD-treated mice that decreased over time (Figs. 4A and B, Supplementary Data). Immunohistochemistry for cleaved caspase 3 and the AECII marker pro SP-C on serial lung sections revealed localization of cleaved caspase 3 signal to AECII in AD-treated mice, whereas no detectable signal was seen in the lung sections of vehicle-treated mice lungs (Fig. 4C). Supporting these data, electron microscopy of lung tissues of AD-treated mice lungs showed fragmentation of the alveolar epithelium and denudation of the basal lamina in mice at d7 after AD treatment (Fig. 1F).
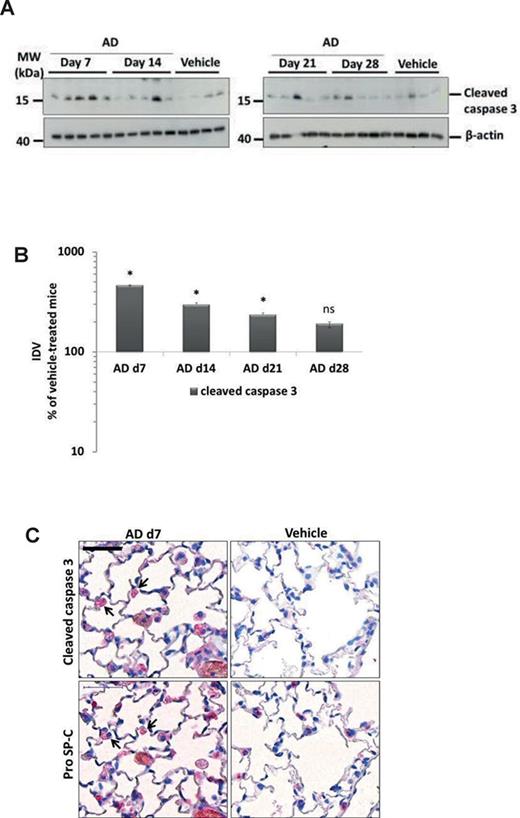
Induction of AECII apoptosis in mice after AD treatment. (A) Western blot analysis of lung homogenates of (left) AD-treated mice at days 7, 14 and vehicle at day 28 and (right) AD-treated mice at days 21, 28 and vehicle at day 28 for cleaved caspase 3 and β-actin. Representative blots and analysis from n = 5 mice per group and three independent experiments are shown. (B) Densitometry analysis of cleaved caspase 3/β-actin ratio was calculated for all available blots and is given as a percentage of the respective vehicle-treated controls. *p < 0.05. (C) Immunohistochemistry performed on serial lung sections from day 7 AD- and vehicle-treated mice for cleaved caspase 3 and pro SP-C. Arrows indicate apoptotic AECII in AD-treated mice. Scale bar = 50 μm; Original magnification of pictomicrographs: ×400. n = 5 mice per group and three independent experiments were performed.
AD Induces Lysosomal and ER Stress in the AECII
Drawn against our previous report of cathepsin D mediated apoptosis of AECII in a mouse model of Hermansky-Pudlak syndrome associated lung fibrosis (Mahavadi et al., 2010), yet another form of lung fibrosis being associated with extensive surfactant accumulation and AECII apoptosis, we investigated the regulation of cathepsin D in AD-induced lung fibrosis. We observed a significant 11-fold increase in cathepsin D levels in lung homogenates of AD-treated mice at day 7 (vs. vehicle), which gradually decreased over time (Figs. 5A and B). In addition, immunohistochemistry for cathepsin D and pro SP-C on serial lung sections showed that the increased cathepsin D was localized to the AECII in AD-treated mice whereas it was mostly restricted to macrophages in vehicle-treated control mice (Fig. 5E, Supplementary Data). Based on our previous study about induction of ER stress within the AECII of IPF patients (Korfei et al., 2008), we analyzed two markers of ER stress, the activating transcription factor (ATF)-6 and C/EBP homologous protein (CHOP). We observed a significant ∼10-fold increase in the p50 form of the ATF6 and ∼3-fold increase in the CHOP protein in AD-treated mice lungs from day 7 through day 28 as compared with vehicle-treated mice lungs (Figs. 5A, C, and D). Immunohistochemistry revealed the induction of ATF6 within AECII and also in some, pro SP-C negative, interstitial cells (Fig. 5F, Supplementary Data). To investigate if AD may exert similar effects in vitro, we treated mouse lung epithelial (MLE) 12 cells with vehicle or with 10 μg/ml AD (according to Bargout et al., 2000) for 8, 16, and 24 h. Western blot analysis revealed an increase in cleaved caspase 3, cathepsin D, p50ATF6, and CHOP as well as pro SP-C in AD-treated cells as compared with vehicle-treated or untreated cells (Fig. 6A). These data completely corroborated with the data obtained from AD-treated mice. Interestingly, high levels of AD-induced toxicity as evident by LDH assay were observed in MLE12 cells only after 24 h of AD treatment and not at earlier time points (Supplementary Data). We then performed knockdown studies in order to investigate if AD may drive apoptosis of MLE12 cells via cathepsin D activation. We transfected cells with a cathepsin D specific versus a scrambled siRNA for 48 h and then treated with AD or vehicle for 8 h. Significant knockdown of cathepsin D was observed (Fig. 6B). In AD- versus vehicle-treated MLE12 cells, cathepsin D knockdown resulted in slightly, albeit insignificantly, reduced levels of cleaved caspase 3 (Figs. 6B and C). Interestingly, MLE12 cells treated with vehicle did show an increased level of cleaved caspase, which—most likely—originated from the stress of transfection. In these cells not treated with AD, knockdown of cathepsin D clearly attenuated the extent of apoptosis, as evident from the reduced amount of cleaved caspase 3. Hence, transfection-induced apoptosis of MLE12 cells seems to be mediated to a larger part through cathepsin D, but AD-induced alveolar epithelial cell apoptosis or pro SP-C increase is not primarily mediated via cathepsin D.
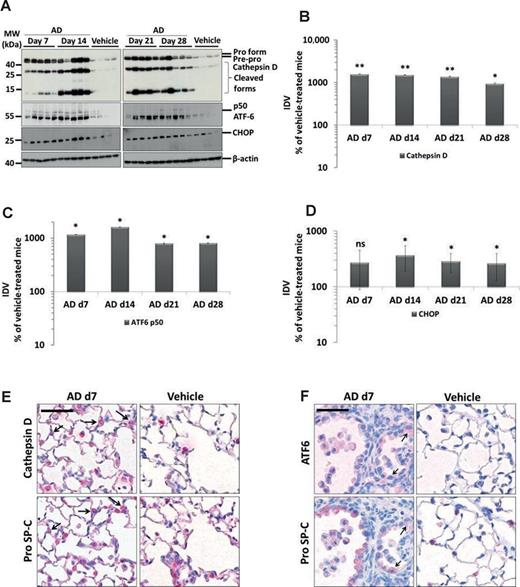
Induction of lysosomal and ER stress in the AECII of AD-treated mice. (A) Western blot analysis of lung homogenates of (left) AD-treated mice at days 7, 14 and vehicle at day 28 and (right) AD-treated mice at days 21, 28 and vehicle at day 28 for cathepsin D, ATF6, CHOP, and β-actin. Representative blots and analysis from n = 5 mice per group and three independent experiments are shown. (B,D,E) Densitometry analysis of the cathepsin D (B) p50ATF6 (D) or CHOP (E) to β-actin ratio was calculated for all blots and is given as a percentage of the respective vehicle-treated controls. **p < 0.01, *p < 0.05; n = 5 mice per group and three independent experiments were performed. (C and F). Immunohistochemistry performed on serial lung sections from day 7 AD- and vehicle-treated mice for cathepsin D and pro SP-C (D) or for ATF6 and pro SP-C (E). Arrows indicate cathepsin D-positive and ATF6-positive AECII in C and F, respectively, in AD-treated mice. Scale bar = 50 μm. Original magnification of pictomicrographs: ×400.
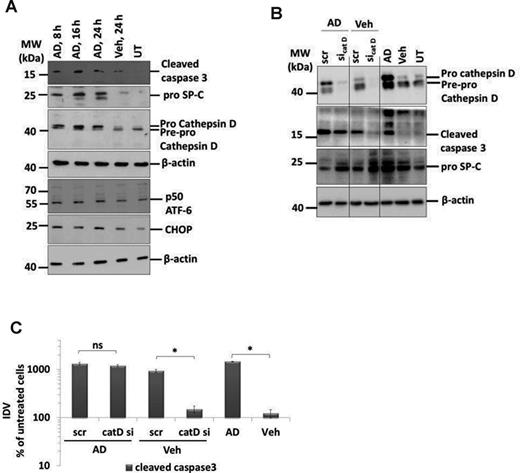
AD-induced AECII apoptosis is not mediated by cathepsin D. (A) Representative Western blot images from cell lysates from AD (8, 16, and 24 h) or vehicle-treated (24 h) or untreated MLE12 cells for cleaved caspase 3, cathepsin D, pro SP-C, ATF6, CHOP, and β-actin. (B) Representative Western blot images for cathepsin D, cleaved caspase 3, pro SP-C, and β-actin from MLE12 cells treated with AD or vehicle and transfected with scrambled or siRNA for cathepsin D. Untransfected cells treated with AD, vehicle, or untreated cells were included as controls. Different parts from same Western blots are separated by vertical lines. (C) Densitometry analysis of cleaved caspase 3 to β-actin ratio was calculated and is given as a percentage of untreated cells. *p < 0.05. Representative images and densitometry analysis from three independent experiments with triplicate transfections each are shown.
DISCUSSION
In the present study, we could show that intratracheal aerosol administration of AD, a frequently used antiarrhythmic drug causing lung fibrosis in a substantial proportion of treated patients, similarly causes a patchy interstitial fibrosis in C57Bl/6 mice alongside with increased alveolar epithelial cell apoptosis, lysosomal stress, and ER stress. To our knowledge, this is the first study to undertake a systematic analysis of surfactant alterations and cellular stress events with special reference to AECII in response to AD treatment in mice.
AD and its metabolites are well known to exert both direct and indirect toxicity on different cell types (Chiovato et al., 1994; Martin et al., 1989). Direct toxicity of AD causing disruption of cellular integrity thereby leading to tissue damage has been reported previously (Bolt et al., 2001) and by us in the current study. Other important features of AD-induced cytotoxicity include intracellular phospholipidosis (Martin et al., 1989), free radical formation (Sarma et al., 1997), membrane destabilization due to inhibition of Na+/K+-ATPase (Chatelain et al., 1985), disruption of intracellular calcium homeostasis (Lubic et al., 1994), and disruption of cellular energy homeostasis (Fromenty et al., 1990). The extent of cytotoxicity is, however, dosage and time dependent. The in vivo and in vitro AD dosages used in this study are within the range of AD concentrations reported within the lungs of patients treated with this drug (Brien et al., 1987; Plomp et al., 1984). Because of repeated AD doses, it is logical to assume that a portion of the applied AD might get accumulated in the alveolar hypophase which associates with the layers of pulmonary surfactant due to its amphiphilic nature. But surfactant film in the hypophase is continuously renewed and lipids are removed from the alveoli with a turnover time of few hours (Wright, 1990). It has been indicated that AD does not affect the degradation of exogenous DPPC and that it does not interfere with early stages of endocytosis, a process through which surfactant is recycled by the alveolar type II cell (Baritussio et al., 2001). Hence directly after AD administration there might be a high and possibly toxic local concentration in the alveolar hypophase, but due to the short turnover time of surfactant, this is also taken up by AECII, making the accumulation of toxic AD concentrations in the hypophase unlikely. Although significant tissue damage was observed in AD-treated mice in this study, in vitro data revealed that apoptosis is predominant, followed by direct toxic effects in AD-treated MLE 12 cells.
Full-blown AD-induced lung fibrosis was visible on day 7, in the absence of extensive inflammatory changes. As extensive AECII cell death is known to be a prominent feature in some idiopathic (IPF, cellular and fibrotic NSIP, EAA) (Jinta et al., 2010; Korfei et al., 2008) and drug-induced forms of interstitial pneumonia including AD (Bargout et al., 2000), our data reinforce the concept that lung fibrosis may actually develop very fast, probably pending on the magnitude of epithelial cell death. In line with such reasoning, the extent of fibrosis as well as the extent of epithelial cell death seemed to slightly vanish over time despite continuous application of identical AD dosages. This to us suggests the evolution of a compensatory mechanism of the injured AECII, making these cells less susceptible towards the toxic effects of AD.
Although impairment in lung compliance and significant increase in total PL content in BALF from AD-treated mice were observed, we did not observe a remarkable difference in total surfactant pool in these mice. The decrease in lung compliance in AD-treated mice might however be a result of the increased thickness of the fibrotic lung tissue. This observation makes the AD model different to the already known Hermansky-Pudlak syndrome associated lung fibrosis, the bleomycin induced mouse model of lung fibrosis and to the clinical IPF, where pronounced disturbances in the biochemical and physical properties of lung surfactant pool were reported (Gunther et al., 1999; Horiuchi et al., 1996; Mahavadi et al., 2010).
As mentioned earlier, AD gets enriched within the lysosomes of various cell types and gets only gradually degraded because of its uncommon long half-life (Okayasu et al., 2006; Somani et al., 1987). In line with such reasoning, the prominent histopathological and biochemical read-out of AD toxicity in the alveolar epithelium was that of a substantial disturbance of lysosomal homeostasis, clearly indicated by the profound increase in the size and number of lamellar bodies within the AECII, and the significant increase in the hydrophobic SP and PL content. These findings are in agreement with previous studies reporting lamellar inclusions in several tissues including lung in AD-treated patients (Dake et al., 1985). The increase in lamellar body sizes might account to the increased surfactant PLs as described before (Padmavathy et al., 1993) and in our current study, and because of increased amounts of pro and mature forms of SP –B and –C within the lungs of AD-treated mice as described here.
Other important observations from our study are the increase in cholesterol and BMP in AD-treated mice lungs. This increase in cholesterol esters along with other accumulated lipids might contribute towards the characteristic foamy nature of cells due to AD treatment. This is further supported by a recent study which reported that upon AD treatment, distribution of BMP, cholesterol and other lipids were altered but the removal of cholesterol did not restore the AD-induced BMP distribution (Piccoli et al., 2011). Although AD is very well-known to induce phospholipidosis in various tissues, the effects of AD on intra-alveolar surfactant pool are not reported extensively. We observed that AD increases the intra-alveolar surfactant in mice. Of note, along with an increase in the unsaturated species of PC and PG, we observed an increase in PE plasmalogens. Plasmalogens are integral components of lung surfactant and are secreted by AECII together with the other surfactant components. They are implicated to play both functional and structural roles (Rustow et al., 1994). Plasmalogens are antioxidant PLs and AD has been implicated to increase oxidative stress (Sarma et al., 1997). Hence, it is reasonable to speculate that the increase in plasmalogens after AD treatment, as observed in the current study might be one of the rescue mechanisms of the type II cell to cope up with the increased oxidative stress. Moreover, it has been shown that increasing amount of ethanolamine plasmalogens result in reduced surface tension in synthetic PL mixtures (Rudiger et al., 1998). Clinically, treatment of premature infants (with ARDS) with synthetic surfactant without plasmalogens demonstrated less efficient recovery when compared with treatment with natural surfactant extracts from bovine lungs (Ramanathan, 2009). Hence, although not experimentally proven here, the increase in plasmalogens may in part explain the ongoing compensatory mechanism of the injured AECII that makes the mice less susceptible towards the toxic effects of AD over time.
Because surfactant processing, secretion, and re-uptake in AECII take place in the lysosomal compartment, an altered intracellular surfactant homeostasis as seen in our model reflects an altered lysosomal homeostasis. In addition, because of an increase in alveolar epithelial cell apoptosis, lysosomal, and ER stress markers, at a quick glance, the AD model offers a lot of similarities with the recently described model of Hermansky-Pudlak syndrome (HPS) associated interstitial pneumonia (Mahavadi et al., 2010). In agreement with this concept, we observed an increase in the levels of cathepsin D, a lysosomal aspartyl protease within the lungs of AD-treated mice and in mouse lung epithelial cells after AD treatment. Although cathepsin D is involved in activating pro-apoptotic mechanisms and terminal caspases (Kagedal et al., 2001), unlike in the HPS model, we observed that AD-induced apoptosis of alveolar epithelial cells is not mediated via cathepsin D, rather the increase in cathepsin D levels after AD treatment might in fact reflect an increase in an overall lysosomal turnover in the alveolar epithelial cells, indicating that other lysosomal cell death pathways might be activated. In fact, it has been shown that AD induces cytoplasmic inclusions (Dake et al., 1985; Somani et al., 1987) and stimulates autophagy (Morissette et al., 2009), a lysosome dependent pathway in several cell types. Whether alveolar epithelial cells undergo apoptosis in an autophagy-dependent manner has yet to be studied in our model.
Altogether, our study describes some important cellular stress mechanisms induced by AD within the AECII and paves the way for further studies on the role of these cellular stress events in the development of AD-induced lung fibrosis.
FUNDING
Part of this work has been undertaken with the enormous support of the European Commission (European IPF Network, funded from 2008 to 2012 through the frame program 7). The authors thank Stefanie Hezel and Susanne Fassbender for their superb technical assistance.
Conflict of interest: Personal fees and board membership from Intermune, Boehringer, Roche. Consultancy fees from Activaero.
REFERENCES

Comments