


Abstract
microRNAs (miRNAs) regulate expression by promoting degradation or repressing translation of target transcripts. miRNA target sites have been catalogued in databases based on experimental validation and computational prediction using various algorithms. Several online resources provide collections of multiple databases but need to be imported into other software, such as R, for processing, tabulation, graphing and computation. Currently available miRNA target site packages in R are limited in the number of databases, types of databases and flexibility. We present multiMiR, a new miRNA–target interaction R package and database, which includes several novel features not available in existing R packages: (i) compilation of nearly 50 million records in human and mouse from 14 different databases, more than any other collection; (ii) expansion of databases to those based on disease annotation and drug microRNAresponse, in addition to many experimental and computational databases; and (iii) user-defined cutoffs for predicted binding strength to provide the most confident selection. Case studies are reported on various biomedical applications including mouse models of alcohol consumption, studies of chronic obstructive pulmonary disease in human subjects, and human cell line models of bladder cancer metastasis. We also demonstrate how multiMiR was used to generate testable hypotheses that were pursued experimentally.
INTRODUCTION
microRNAs (miRNAs) with proven biological functions are involved in biological processes in all organs of the human body (1), including cell cycle control, cell survival, drug resistance and many tissue specific activities. With more than 60% of human 3’-UTRs under evolutionary pressure to maintain conserved miRNA target sites (2), miRNAs could play roles in most, if not all, biological processes (3). Many experimental approaches have been utilized to identify and validate miRNA targets (4,5). Complementing experimental data, a large number of computational methods have been developed to predict potential miRNA targets (6–13). Predictions are primarily based on base pairings in the miRNA seed region (the first eight nucleotides of an miRNA), conservation of target sites across species, accessibility of target sites, free energy of the miRNA–mRNA duplex, or a combination of two or more of these features (3,14). Due to loose complementarity between most animal miRNAs and target mRNAs, the computational challenge has been to confidently identify real targets without predicting too many false positives. Using experimentally validated targets, comparisons of miRNA target prediction algorithms showed that the best performing algorithms had around 50% precision (correctly predicted/total predicted) and 6% to 12% sensitivity (correctly predicted/total correct) (15). A more recent comparison based on microarray data indicated that PITA, PicTar and TargetScan have the best precision and recall rates of the databases evaluated (16). Due to our limited understanding of the rules of miRNA–target interactions, there is no single algorithm that outperforms others routinely (17). An alternative approach would be to take the union (with the increase of sensitivity and loss of precision) or intersection (with the increase of precision at the cost of sensitivity) of multiple prediction programs (15,18). The combination approach may not be as effective as a single algorithm because of age or quality of the tool, but it has been recommended by Shirdel et al. (16). These authors also give guidelines for using a single database in specific cases.
There are many online databases and web servers that collect experimentally validated miRNA targets from the literature or integrate miRNA target predictions from multiple programs (see review (19)). For example, miRWalk (20) and miRSystem (21) integrate predictions from nine and seven software programs, respectively. In addition, both resources contain validated miRNA–target interactions from external databases. To facilitate biomedical research, a few online resources, such as miR2Disease (22), Pharmaco-miR (23) and PhenomiR (24), are dedicated to disease- or drug-related miRNAs from the literature.
Compared to online resources, miRNA related packages in the statistical software R (http://www.R-project.org) provide more user-controlled features and the potential to automate the whole analysis pipeline without restriction on the number of miRNAs or target genes as input, in addition to the full repertoire of statistical analysis and graphical tools available in R. Unfortunately, there are limitations to the five currently available R packages providing miRNA target information (Table 1). Two of them, targetscan.Hs.eg.db (version 0.6.1) and targetscan.Mm.eg.db (version 0.6.1) from Bioconductor (http://www.bioconductor.org), are specific to TargetScan (10) predictions in human and mouse, respectively. CORNA (25) tests for significant miRNA–target associations given a gene list and links miRNAs and targets to functional annotation. It utilizes miRNA target predictions from MicroCosm/miRBase (9) only. RmiR.Hs.miRNA (version 1.0.6) is another Bioconductor package which includes predictions from five programs (MicroCosm, miRanda (7), miRDB (13), PicTar (6) and TargetScan) and validations from TarBase (26) in human. The last package CROME (https://code.google.com/p/crome/, version 1.0.0) identifies gene clusters based on gene expression and the genes’ association with miRNAs and gene ontology. Although not specific to miRNA-target interactions, CROME provides miRNA–mRNA mappings in human and mouse by MicroCosm, PicTar and TargetScan. For all five packages, users can query miRNA–target interactions using miRNA and/or gene identifiers. However, users have little control over the quality of the prediction due to the lack of scores, conservation, or seed pairings that indicate predicting confidence. In addition, there is little information about whether an miRNA–target interaction has been experimentally validated and no information about the relationship of a given miRNA with diseases or drugs.
Comparison of R packages for miRNA–target interactions
| Feature/Database | R package | |||||
|---|---|---|---|---|---|---|
| multiMiR | RmiR.Hs.miRNA | CROME | CORNA (25) | targetscan.Hs.eg.db & targetscan.Mm.eg.db | ||
| Predicted miRNA–target interactions | DIANA-microT (12) | X | ||||
| ElMMo (8) | X | |||||
| MicroCosm/miRBase (9) | X | X | X | X | ||
| miRanda (7) | X | X | ||||
| miRDB (13) | X | X | ||||
| PicTar (6) | X | X | X | |||
| PITA (11) | X | |||||
| TargetScan (10) | X | X | X | X | ||
| Validated miRNA–target interactions | miRecords (27) | X | ||||
| miRTarBase (28) | X | |||||
| TarBase (26) | X | X | ||||
| Disease-/drug-related miRNAs | miR2Disease (22) | X | ||||
| Pharmaco-miR (23) | X | |||||
| PhenomiR (24) | X | |||||
Here, we developed an R package multiMiR with its database and web server at http://multimir.ucdenver.edu. It is also accessible in an interactive mode at the PhenoGen Informatics website http://phenogen.ucdenver.edu/PhenoGen/. multiMiR is a comprehensive collection of predicted and validated miRNA–target interactions and their associations with diseases and drugs. This package has incorporated several novel features that address gaps and needs in the field including (i) more data sets than any of the current R packages (Table 1); (ii) queries not only based on a list of miRNAs and/or genes, but also diseases and/or drugs; and (iii) control of the score cutoff for each predicted data set for more confident or comprehensive results. The multiMiR R package serves as an interface between the user and the multiMiR database on the remote server. It is a collection of R functions to display information of the database, build query based on user's input, submit query to the web server, and parse and summarize results returned by the server (Figure 1). For applications, we illustrate how queries to multiMiR can provide insights into the process of human bladder cancer metastasis and can generate testable hypotheses that we pursued experimentally to facilitate research on alcohol consumption in a mouse model and chronic obstructive pulmonary disease (COPD) in human samples.
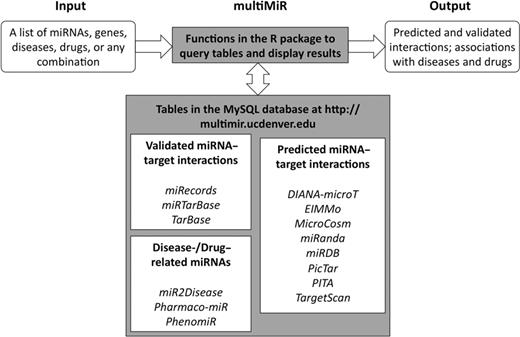
multiMiR components and data workflow. multiMiR components, including R functions and database are highlighted in grey. Data analysis flow is denoted by arrows.
MATERIALS AND METHODS
Building the multiMiR database and package
The multiMiR database contains human and mouse data from 14 external databases that are categorized into three components (Figure 1), including the three validated miRNA–target databases (miRecords (27), miRTarBase (28) and TarBase (26)), the eight predicted miRNA–target databases (DIANA-microT (12), ElMMo (8), MicroCosm (9), miRanda (7), miRDB (13), PicTar (6), PITA (11) and TargetScan (10)), and the three disease-/drug-related miRNA databases (miR2Disease (22), Pharmaco-miR (23) and PhenomiR (24)). Data were downloaded (see Supplementary Table S1) and pre-processed before loading into a MySQL database. Depending on the available miRNA and gene information in the original data, the pre-processing involved updating/retrieving mature miRNA IDs (e.g., hsa-miR-10a-5p) and retrieving mature miRNA accession numbers (e.g., MIMAT0000253) using the mirbase.db package (29) (package version 1.2.0; miRBase version 19), updating/retrieving gene symbols and retrieving Entrez and Ensembl gene IDs using the biomaRt package (30) (version 2.16.0), and cleaning and reorganizing the data, such as correcting typographical errors, removing duplicates, and reorganizing the information for consistency between databases. The multiMiR database is hosted at http://multimir.ucdenver.edu that supports RESTful access to the database. The multiMiR package includes functions to display information of the multiMiR database, query the database and summarize the result (Figure 1).
get.multimir input and parameters
multiMiR provides several functions for users to explore the database, such as multimir_dbSchema to display database schema and list.multimir to list miRNA, gene, disease and drug entries. Users can refer to the documentation, which is available at http://multimir.ucdenver.edu or by typing vignette (‘multiMiR’) in R. Here, we focus on the get.multimir function that serves as the main interface between users and the multiMiR database. Input to the function could be mature miRNA IDs, mature miRNA accession numbers, gene symbols, Entrez gene IDs, Ensembl gene IDs, disease or drug terms, or a combination of any of the aforementioned identifiers.
Several databases provide a summary score between 0 and 1 (or percentage) for conservation across species at the target sites (miRanda and PITA), where the value one (or 100%) is the most conserved. For these databases, we use the author recommended target site predictions with a minimum of 0.90 conservation for PITA, and 0.57 and 0.566 for human and mouse, respectively, for miRanda. Predictions below these levels are considered non-conserved. When downloading PicTar, there were three levels of miRNA conservation (‘mammals, chicken, fish’, ‘mammals, chicken’, and ‘mammals’) to select from, and the least stringent (‘mammals’) was chosen. For TargetScan, predictions indicated as conserved or non-conserved are also contained in the multiMiR package. For other sources, there was no conservation information. multiMiR provides a user option to select ‘conserved’, ‘nonconserved’, or ‘all’ target site predictions.
All predicted databases have a primary score for target site strength, which is calculated depending on the particular computational method. Almost all existing R packages only provide a list of the target site predictions but no control over selecting predictions by their target strength. In contrast, multiMiR allows the user to select the top predictions ranked by the primary score either using a percentage or number cutoff. First, as default only the top 20% predicted target sites of each external database are queried, but the user can alter this percentage. A percentage cutoff of 100% provides no filtering. Second, a user-set number of top predicted target sites can be queried for all databases. The number cutoff is also relevant because predicted target databases vary in orders of magnitude in the number of predictions (from hundreds of thousands in PicTar to millions in DIANA-microT and TargetScan). Therefore, when tallying the number of predictions across databases, the very large ones may dominate the counts. The number cutoff allows the user to compare the same number of predictions for each database. The default is set at 300,000. If this number is larger than any of the databases, there will be a warning message for the user.
get.multimir output
Depending on the input parameters, output from the get.multimir function is a list with several data frames containing results from a given external database, predicted, validated, and disease and drug components of multiMiR, and a summary (see examples in ‘Results’ section). The result includes miRNA and target gene identifiers, information on the external database supporting the interaction, prediction scores (for the ‘predicted’ data frame), diseases/drugs (for the ‘disease.drug’ data frame), supporting experiments (for the ‘validated’ data frame), and PubMed IDs (for the ‘validated’ and ‘disease.drug’ data frames). The summary provides results for each miRNA–gene pair by tallying the number of times that pair is supported by each of the external databases, each of the database types (predicted, validated, disease or drug associations) and the total number of databases. Finally, the user can select the ‘add.link’ option, which will display the external links from the original database for the miRNA–target validations or predictions. For many of the databases, the links are available. However, in Supplementary Table S2 we have listed the databases where links may be broken due to outdated identifiers in these databases. We also listed the databases that do not have the option to search by miRNA–gene pairs. In the package and documentation, we have included a warning to the user for unavailable or broken links.
Methods for the three case studies
qRT-PCR
Whole brains of naïve, saline or ethanol (5 g/kg; i.p.) injected mice from the Inbred Long Sleep (ILS) and Inbred Short Sleep (ISS) strains (n = 3/condition) were used for a small pilot study. The origin of these inbred strains is discussed in (31) and phenotypic data on these strains and on members of a large recombinant inbred panel derived from these strains are available at the Jackson Laboratory (http://www.jax.org), GeneNetwork (http://www.genenetwork.org) and PhenoGen (http://phenogen.ucdenver.edu/PhenoGen). Tissue was collected at 8 h post injection. The dose and time were selected based on previous work which showed a relationship between ethanol tolerance and drinking behaviour under these conditions (32). Eighteen mice were used in total (2 strains X 3 conditions X 3 mice), however one ISS naïve sample was removed due to low quality. The Qiagen miScript system was used to give relative expression of a miRNA normalized to three additional miRNAs profiled and selected for normalization based on the approach in (33). cDNA was generated using the miScript Reverse Transcriptase kit (Qiagen) followed by qRT-PCR using miScript SYBR green (Qiagen) with the universal reverse primer and microRNA specific primers for mmu-miR-101a-3p, mmu-miR-218, mmu-miR-9 and U6. Mature mmu-miR-101a-3p and mmu-miR-101b-3p only differ by one base, but the location of that base is far enough into the primer that it should not disrupt binding. Therefore, we used the primer for mmu-miR-101a-3p only. ANOVA was applied in R to determine p-values for treatment and strain effects.
Luciferase assay
The predicted hsa-miR-429 binding site was placed in the plasmid pSI-CHECK2 using the following primers For-CERS6 5’- tcgaTG TAG GCA TGC TGT ATG TAA TTG ACA CAA GGG AAC AGT ATT TGC ATT TGT A and Rev-CERS6 5’-ggccTAC AAA TGC AAA TAC TGT TCC CTT GTG TCA ATT ACA TAC AGC ATG CCT ACA and for the mutant construct For-CERS6 mut 5’-tcgaTG TAG GCA TGC TGT ATG TAA TTG ACA CAA GGG AAC AaT gTT TGC ATT TGT A and Rev-CERS6 mut 5’-ggccTAC AAA TGC AAA cAt TGT TCC CTT GTG TCA ATT ACA TAC AGC ATG CCT ACA.
The first construct contained the predicted binding site and the second construct contained site directed mutations of the predicted binding site as previously described (34). Plasmids were transfected into HEK293 cells using the lipophilic reagent Lipofectamine 2000 (Invitrogen) and treated with control mimics or mimics of hsa-miR-429 (Fisher Scientific-Dharmacon). Following 24 h of incubation, luciferase activity was quantitated on a luminometer and compared to the internal control in the dual luciferase vector for transfection efficiency.
Microarray experiment
Two metastatic human bladder cancer cell lines FL4 and Lul2 were lineage related (35,36) to their poorly metastatic relatives T24 and Luc, respectively. Total RNA of the four cell lines was extracted by Trizol (Invitrogen). For the miRNA microarray, RNA was labelled and hybridized as described (37) to version 5 of the MDACC miRNA expression bioarray (38). Hybridization signals were detected and quantified as in (37). mRNAs of the four cell lines were profiled on Affymetrix HG-U133A arrays as in (36). For these miRNA microarrays, signal intensities were background corrected and set at the minimum value of 128 if the intensity was below the minimum (this level is the average minimum intensity level detected in the experiments). Arrays were median centered using the median of all arrays. A probe was excluded if more than 50% of its data were missing or below the minimum intensity. All remaining probes for an miRNA were considered for differential expression. For the Affymetrix microarrays on the four cell lines, raw data were processed by the Robust Multi-array Average algorithm implemented in the affy package (39) in R. Differentially expressed miRNA and protein-coding genes between T24 and FL4 and between Luc and Lul2 were identified using the limma package (40) in R with false discovery rate (FDR) < 0.05. The mRNA and miRNA array data are available in the ArrayExpress database (http://www.ebi.ac.uk/arrayexpress) under accession numbers E-MTAB-2610 and E-MTAB-2611, respectively.
RESULTS
To demonstrate a typical application of multiMiR, we first discuss two examples that illustrate the get.multimir function's input options and output format. We continue to demonstrate multiMiR's features with three additional case studies, emphasizing applications where multiMiR can be used to generate testable hypotheses for experimental validations.
In the first example, a user may query whether a given miRNA (i.e., hsa-miR-18a-3p) has targets that are experimentally validated in the literature. This is usually an initial query for researchers investigating the role of a particular miRNA. As a result, a total of two records from miRecords and miRTarBase show that hsa-miR-18a-3p targets KRAS (Figure 2A) based on a luciferase assay. The interaction is confirmed by multiple experiments in a single paper (Figure 2A). In the summary, get.multimir returns how many times this miRNA–target pair is recorded in each of the external databases and in total.
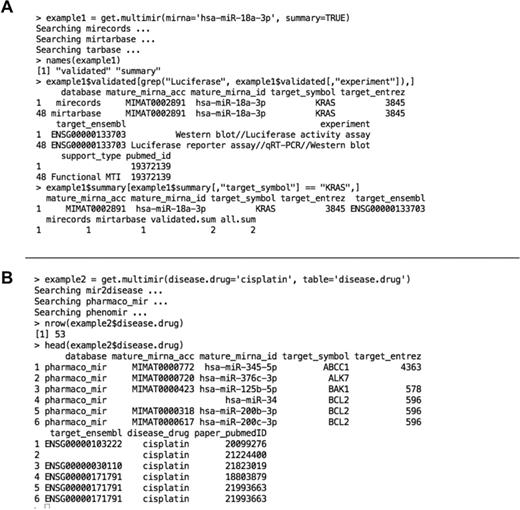
R commands and results for examples 1 (A) and 2 (B). (A) Parameter ‘summary’ was set to TRUE (to summarize the result) and other parameters were as default. By default, get.multimir searches the validated miRNA–target interactions in human. MTI, miRNA–target interaction.
One of the novel features of multiMiR is the disease/drug association of miRNAs. In the second example, we ask what miRNA–target pairs are related to Cisplatin, which is prescribed to treat various types of cancers. We searched ‘cisplatin’ in the ‘disease.drug’ component of multiMiR that includes miR2Disease, Pharmaco-miR and PhenomiR. The output of multiMiR showed that there are 53 miRNA–target interactions associated with Cisplatin (Figure 2B). The PubMed IDs in the resulting table can be used to examine the original papers for more details of the association.
In the following three case studies, we illustrate how multiMiR can be used to select candidate miRNA–target pairs in mouse and human for further experimental testing. For two of these cases, we show how predictions were validated by miRNA expression and binding assays.
Case Study 1: Alcohol drinking in mice
In a previous investigation, we examined the predisposing genetic factors for voluntary alcohol consumption in mice (41). Brain gene expression was compared between five pairs of mouse strains and selected lines (4–6 mice per strain or line) that showed high and low drinking behaviour (42,43). For all five pairs, the transcript for guanine nucleotide binding protein (G protein), beta 1 subunit (Gnb1) was differentially expressed. The Gnb1 transcript codes for the Gβ1 subunit of the guanine nucleotide binding proteins, which transduces signals from G protein coupled receptors (GPCRs). The transcript levels for Gnb1 were higher in the brains of the low alcohol-drinking mice in all but the ISS/ILS pair, where higher levels of Gnb1 mRNA were found in the ISS mice, which consume more ethanol than the ILS mice. However, based on protein levels of Gβ1 in whole brains of all the strain pairs, in all cases, protein levels were higher in the brains of the low alcohol-consuming mice. In exploring this inconsistency, we found that the Gnb1 gene has at least two different transcripts that vary in the length of their 3’ UTR prior to the polyA sequence (Figure 3A). The probes that were used to interrogate the Gnb1 transcript on the Affymetrix array target the long form of the 3′ UTR. Therefore, the low alcohol-consuming DBA/2J mice have more of this form of Gnb1 mRNA than the high alcohol-consuming C57BL/6J mice. However, the ILS mice, which have more Gβ1 protein in their brain and drink less alcohol than the ISS mice, have less of the Gnb1 transcript with the long 3′ UTR.
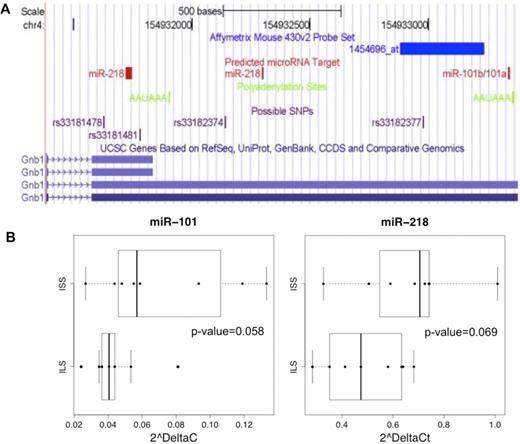
(A) Diagram of 3’UTR of Gnb1. Graphic was from Saba et al. (41) and generated using tools available at UCSC Genome Browser (http://genome.ucsc.edu/). Among four different Gnb1 transcripts, there are two versions of the 3′ UTR region of Gnb1 (blue bars bottom). The diagram also depicts the differentially expressed Affymetrix probe set for Gnb1 (bright blue), polyadenylation sites (green), predicted miRNA target sites (red) and the SNPs predicted to differ between ISS and three other inbred strains (purple). The entire length of the 3’UTR is 1809bp and the longer version extends from 254 to1809bp. mmu-miR-218 had predicted target sites by three databases (DIANA-microT, ElMMo and PITA) and mmu-miR-101a/b had predicted target sites by four databases (ElMMo, miRanda, PicTar and TargetScan). By checking location information from the original databases, we found that in the long form of the 3’UTR, the mmu-miR-218 predicted target site was located at 727–734bp and the mmu-miR-101a/b predicted target site were located at 1765–1771bp. In the shorter version of the 3’ UTR, mmu-miR-218 also had a predicted target site at 150–178bp. (B) RT-PCR results for mmu-miR-101a and mmu-miR-218 in ILS and ISS mice. Strain effects determined by ANOVA are suggestive of mmu-miR-101a (p = 0.058, fold-change FC = 1.94) and mmu-miR-218 (p = 0.069, FC = 1.37) expression increases in ISS. Conditions for each strain were combined to create the boxplot.
To explore the role of miRNAs, we searched for miRNA binding sites of Gnb1 in all databases of the multiMiR package (Supplementary R Code). Two miRNAs, mmu-miR-324–3p and mmu-miR-7b-5p, were validated to target Gnb1 according to miRTarBase and TarBase. The predicted databases varied greatly in the number of miRNAs predicted to target Gnb1: DIANA-microT (108), ElMMo (53), MicroCosm (5), Miranda (44), miRDB (1), PicTar (9), PITA (132) and TargetScan (58). Among them, PITA was the only one that predicted the two validated miRNAs. To select novel miRNAs for validation, users could pick the top-scoring candidates from PITA, or any one of the other predicted databases, or use a combination approach. It is still a debate whether the single or combination approach is better (15–18). Here, we examined all databases and found that mmu-miR-101a/b-3p and mmu-miR-218–5p (Figure 3A) were supported by the largest number of predictions, seven from six and four databases respectively.
One plausible hypothesis, explaining the discrepancy in the transcript and protein expression data for the ILS/ISS mice, is that one or both of these miRNA may be expressed at higher levels in the ISS, and following targeting of the Gnb1 3’UTR, this could result in repression of translation and generation of less Gβ1 protein, which is consistent with our results. To explore this hypothesis, we assessed the expression of the two miRNA in the ILS and ISS strains. Based on a small pilot study, both mmu-miR-101a/b-3p and mmu-miR-218–5p show evidence of increased expression in the whole brains of the ISS strains compared to ILS (Figure 3B), supporting further investigation in a larger study.
Case Study 2: Chronic Obstructive Pulmonary Disease (COPD)
In recently published work, we examined microarray expression signatures for COPD and emphysema in the peripheral blood mononuclear cells (PBMCs) of 136 current and former smokers from COPDGene®, a nationwide genetic epidemiology study (44). Pathways relevant to the immune system, inflammatory responses and sphingolipid (ceramide) metabolism and signaling were over-represented by the candidate genes. The abundance of differentially expressed immune and inflammatory response genes were not unexpected considering that PBMCs were profiled. However, the appearance of sphingolipid metabolism and signaling genes is relevant since it is an area of research for treatment of lung disease (45). To explore whether miRNAs are regulators of sphingolipid related pathways in PBMCs, we took a set of candidate genes from these pathways in our data set (AKT2, CERS6, S1PR3, SULF2) and ran multiMiR (Supplementary R Code). We found that 465 miRNA had at least one predicted site to one of the four genes and the different databases varied in the number of miRNA predicted to target any of the four genes: DIANA-microT (145), ElMMo (172), MicroCosm (32), Miranda (29), miRDB (141), PicTar (47), PITA (85) and TargetScan (157). To focus on miRNAs targeting this set of genes, five miRNAs had predicted sites to three of the four genes; no miRNA had predicted sites to all four. Of the five, hsa-miR-429 was the miRNA with the most predicted target sites to three genes including CERS6 (supported by DIANA-microT, ElMMo, PicTar and TargetScan), AKT2 (supported by MicroCosm and PITA) and SULF2 (supported by MicroCosm). To follow up, we used a luciferase reporter assay to evaluate the binding of hsa-miR-429 in the 3’UTR of CERS6, which is involved in sphingolipid metabolism. The assay confirmed that there was significant reduction in luciferase expression when treated with hsa-miR-429 mimics compared to the negative control mimics (p-value < 0.05; Figure 4A). We also mutated the binding site to show that the regulation of the mutated gene by mimic hsa-miR-429 is no longer possible (Figure 4B).
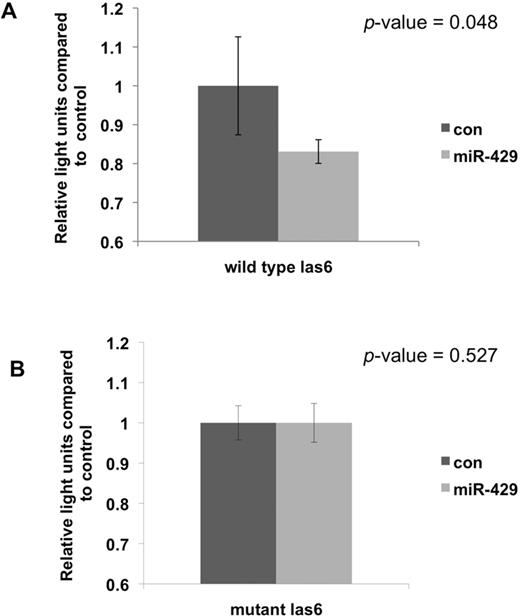
Results of luciferase reporter assay for hsa-miR-429 and CERS6. The first construct (A) contains the hsa-miR-429 predicted binding site and the second construct (B) contains site directed mutations of the predicted binding site. Plasmids were treated with control (con) or hsa-miR-429 mimics. Bars indicate the standard error. The wild type CERS6 target site is AAC AGT ATT TGC ATT and the mutant target site is AAC AaT gTT TGC ATT, where lower case indicates the variants.
Case Study 3: Bladder cancer metastasis
To identify miRNA:target interactions that are important in bladder cancer metastasis, we profiled miRNA and mRNA expression in poorly metastatic cell lines T24 and Luc, and their metastatic derivatives FL4 (36) and Lul2 (35), respectively. Within each pair of parental-derivative cell lines, differentially expressed (DE) miRNAs and genes were identified. To diminish cell lineage-specific artifacts, we focused on nine DE miRNAs and 83 DE genes that were common between the two pairs of cell lines and whose expression changes were in the same direction for both pairs when comparing the parent and derivative. Interestingly, all nine DE miRNAs are upregulated and more than half (47 out of 83) of the DE genes are downregulated in the tumorigenic cell lines (Supplementary Tables S3 and S4).
We reasoned that miRNAs and genes that expressed differently between parental and derivative cell lines could potentially contribute to their disparity in metastatic competence. We further hypothesized that interactions between these miRNAs and target genes may play an important role in metastatic competence. For demonstration, multiMiR was utilized to check whether any of the nine upregulated miRNAs (in FL4 and Lul2) could potentially target any of the 47 downregulated genes (in FL4 and Lul2) (Supplementary R Code). As a result, all nine miRNAs are documented by miR2Disease and/or PhenomiR for their association with a total of 100 disease terms. For example, five cancers (breast, lung, ovarian, prostate cancers, and head and neck squamous cell carcinoma) have associations with all the nine miRNAs. Only two miRNAs (hsa-miR-23b-3p and hsa-miR-146a-5p) are supported by the literature for their involvement in bladder cancer. There are 65 predicted unique miRNA–target pairs between the nine miRNAs and 28 of the 47 genes (Supplementary Table S5). Three interactions, two included in the predicted set, hsa-miR-30a-5p and LIMCH1, hsa-miR-30a-5p and FDX1, and hsa-miR-128 and NEK2, have been experimentally validated and documented in miRTarBase and TarBase. In summary, expression data and multiMiR searches suggested the role of several miRNA–gene regulatory relationships in metastatic competence. By combining and mining the information from the validated, predicted and disease components of multiMiR, we can prioritize the miRNA–gene pairs for further experimental investigation.
DISCUSSION
We developed and presented a new R package multiMiR and its database that compiles 14 miRNA and target databases from experimental, computational, drug and disease resources. Although web servers exist that also assemble a similar set of the target databases, this package provides the largest collection available in R, in addition to more flexible queries. Furthermore, integration into R facilitates a seamless downstream analysis for making tables, graphics and statistical computations. Finally, unlike most other compilation web servers and packages, we allow the user to alter the cutoffs for predicted binding strength so that they can obtain the most confident targets.
Our examples and case studies illustrate the typical usage of our package, searching by gene, miRNA, gene–miRNA pair and/or by disease/drug. The case studies also illustrate how the package generated hypotheses regarding miRNA regulation that could be tested in the laboratory. For alcohol preference, multiMiR was used to identify potential miRNA that target the brain candidate gene Gnb1 discovered in different mouse studies and qRT-PCR confirmed that their expression was consistent with the transcript and protein levels of the candidate gene. In the COPD study, a luciferase assay confirmed binding of the predicted miRNA reported by multiMiR for the candidate PBMC gene CERS6. The genes for the COPD study were chosen based on their role in sphingolipid metabolism and signaling. For a more focused analysis on the overall effects of miRNA on regulation of pathways, there are several tools to study pathways affected by miRNA (21,25,46). Finally, in the third case study, multiMiR was used to identify interactions between differentially expressed miRNAs and genes in two pairs of metastatic and poorly metastatic cell lines in bladder, providing a list of miRNA–target gene pairs for further investigation of their roles in bladder cancer metastasis.
Advanced users have the option to query the multiMiR database directly and can refer to the documentation for details. Our multiMiR R package and its documentation can be freely accessed and downloaded from http://multimir.ucdenver.edu.
AVAILABILITY
multiMiR is freely available at http://multimir.ucdenver.edu. We will check for updates in the original databases quarterly and will include new versions when they are available.
ACCESSION NUMBERS
The microarray data used in case study 3 are available in ArrayExpress (http://www.ebi.ac.uk/arrayexpress) under accession numbers E-MTAB-2610 and E-MTAB-2611.
We thank Michael Hinterberg and Tzu-Lip Phang for testing the multiMiR package and Jason Braddy for server support.
FUNDING
National Institutes of Health [R01CA075115 to D.T., K01AA16922, R01AA021131 to K.J.K., R01AA016957 to R.A.R., R24AA013162 to B.T.]; a Butcher Seed Grant [to K.J.K., R.B.]; the Banbury Fund [to B.T.]. Funding for open access charge: National Institutes of Health.
Conflict of interest statement. None declared.
Present addresses:
Yuanbin Ru, Department of Biomedical Informatics, Windber Research Institute, Windber, PA 15963, USA.
Simona Rossi, SIB Swiss Institute of Bioinformatics, Bâtiment Génopode, Quartier Sorge, University of Lausanne, 1015 Lausanne, Switzerland.
The authors wish it to be known that, in their opinion, the first two authors should be regarded as Joint First Authors.

Comments