


Abstract
Background: The causal role of circulating sex hormone-binding globulin (SHBG) for type 2 diabetes is controversial. Information on the relations between SHBG and new biomarkers of cardiometabolic risk is scarce.
Methods: We applied quantitative nuclear magnetic resonance metabolomics in three Finnish population-based cohorts to comprehensively profile circulating lipids and metabolites and study their associations with SHBG. Mendelian randomization was used to examine potential causality of SHBG on the metabolic measures and insulin resistance. Prospective associations and causal effect estimates of SHBG on type 2 diabetes were assessed via meta-analysis including summary statistics from the DIAGRAM consortium.
Results: In cross-sectional analysis in 6475 young adults (mean age 31, 57% men), higher SHBG was linked with a more favourable cardiometabolic risk profile, including associations with lipoprotein subclasses, fatty acid composition, amino acids, ketone bodies and inflammation-linked glycoproteins. Prospective analysis of 1377 young adults with 6-year follow-up indicated that SHBG is also associated with future insulin resistance. Mendelian randomization suggested only minor, if any, causal effects of SHBG on lipid and metabolite measures and insulin resistance(n = 10 895).Causal effect estimates on type 2 diabetes for 41 439 cases and 103 870 controls indicated a causative protective role of SHBG (OR = 0.83 per 1-SD, 95% CI: 0.76, 0.91); however, effects were considerably weaker than observed in meta-analysis of prospective studies [hazard ratio (HR) = 0.47 per 1-SD, 95% CI: 0.41, 0.53].
Conclusion: Circulating SHBG is strongly associated with systemic metabolism and predictive for insulin resistance and diabetes. The weaker causal estimates suggest that the observational associations are partly confounded rather than conferred directly via circulating SHBG.
KEY MESSAGES
Higher circulating SHBG is favourably linked with a wide range of cardiometabolic risk factors, including lipoprotein lipids and subclasses, fatty acids, amino acids and inflammation-linked glycoproteins.
The associations between SHBG and circulating lipids and metabolites are generally stronger for men than for women, especially for triglyceride-rich lipoproteins and fatty acids.
SHBG is also associated with future insulin resistance in young adults; however, causal effects of SHBG on circulating lipids, metabolites and insulin levels are weak or absent.
Mendelian randomization analyses indicate modest protective effects of SHBG on type 2 diabetes risk.
Stronger observational associations than causal effect estimates suggest that the observed associations of SHBG with systemic metabolism and diabetes are partly confounded, potentially via influences from sex hormones.
Introduction
Sex hormone-binding globulin (SHBG) is a specific binding protein for sex hormones regulating the availability of free testosterone and oestrogen in the circulation.1 Although SHBG has traditionally been considered as a passive carrier protein, it may have an important biological function of its own and thereby also potential as a therapeutic target. Numerous studies have shown that lower circulating concentrations of SHBG are related to higher insulin resistance, presence of the metabolic syndrome and higher risk for type 2 diabetes.1,2
Controversy remains regarding the potential causal role of circulating SHBG on type 2 diabetes: two Mendelian randomization studies have suggested a causal relationship3,4 with effect estimates matching observational associations, whereas a more recent study argued against causality.5 Both the recent study5 refuting causality and a large meta-analysis suggesting a causal role3 used a single nucleotide polymorphism (SNP), rs1799941, near the SHBG gene as the instrument for circulating SHBG levels. The third,4 a relatively small study indicating prominent causal effects, examined the causal effects via two SHBG SNPs, rs6257 and rs6259. In Mendelian randomization analysis, the combination of independent genetic variants is preferred over single SNPs to explain more variance of the intermediate phenotype and reduce potential pleiotropic influences.6,7 Since our study population characteristics match those of a recent genome-wide association study (GWAS),8 we were here able to generate a gene score composed of 11 independent variants associated with circulating SHBG levels to inform on the causal role in relation to type 2 diabetes and numerous metabolic risk markers.
In the light of the potential causal role of SHBG on type 2 diabetes, it is of importance to investigate the relationships of SHBG with metabolic pathways that could underlie the link of SHBG to the development of diabetes. Insulin resistance is on the causal pathway to type 2 diabetes9 and it is anticipated that multiple circulating biomarkers could also be so. However, prior studies investigating the associations between SHBG and metabolic risk have focused only on a limited set of risk markers, such as blood pressure, C-reactive protein, triglycerides and high-density lipoprotein (HDL) cholesterol.10–13 Further, the assessments have predominantly been conducted in men.
None of the previous studies have assessed the potential causality of SHBG on circulating biomarkers. The potential involvement of SHBG in the aetiology of metabolic deviations related to cardiometabolic risk therefore remains unclear. Furthermore, metabolomics profiling of risk factors have recently revealed a plethora of new biomarkers for type 2 diabetes and vascular diseases.14,15 These include lipoprotein subclass measures,16 multiple fatty acids,17 ketone bodies,18 and many amino acids.19 However, there is a dearth of evidence on how circulating SHBG concentrations relate to these new cardiometabolic risk markers. The present application of quantitative serum nuclear magnetic resonance (NMR) metabolomics in three large population-based cohorts from Finland extends the coverage to an extensive set of established and emerging metabolic risk factors for both men and women, and further examines the potential causality for the detailed molecular associations with SHBG.
Methods
Study populations
The characteristics of the study populations are given in Table 1, and the analysis flow of this study is illustrated in Figure 1. Pregnant women and those using oral contraceptives were excluded. In total, 6475 young adults from two population-based cohorts, the Northern Finland Birth Cohort 1966 (NFBC1966; mean age 31, 57% men)20 and the Cardiovascular Risk in Young Finns Study (YFS; mean age 32, 54% men),21 had data on SHBG concentrations and detailed systemic metabolite profiles. In YFS, 1377 individuals had data also at 6-year follow-up. A third population-based cohort, the FINRISK 1997 study (FINRISK; mean age 49, 52% men),22 was included to increase the statistical power for genetic associations; these three cohorts added up to 10 985 individuals with genotype data and detailed metabolic profiles. Secondary analyses to extend the results to adolescents were conducted for 4834 boys and girls aged 15–16 from the Northern Finland Birth Cohort 1986 (NFBC1986).23 Descriptions of the study populations are given in the Supplementary Methods (available as Supplementary data at IJE online). All participants gave written informed consent and the local ethics committees approved the study protocols.
Characteristics of the study populations
| Characteristics | Primary data | Secondary data | ||
|---|---|---|---|---|
| NFBC1966 | YFS | FINRISK | NFBC1986 | |
| Number of individuals | 4841 | 1870 | 7200 | 5099 |
| Male [%] | 57 | 54 | 52 | 55 |
| Age [year] | 31.0 (0.0) | 32.1 (4.9) | 49.1 (12.9) | 16.0 (0.0) |
| BMI [kg/m2] | 24.8 (4.1) | 25.3 (4.5) | 26.8 (4.5) | 21.2 (3.4) |
| Systolic blood pressure [mmHg] | 125 (13) | 117 (13) | 137 (20) | 116 (13) |
| Plasma glucose [mmol/L] | 5.0 [4.8–5.3] | 5.0 [4.8–5.3] | 5.0 [4.7–5.4] | 5.2 [4.9–5.4] |
| Insulin [IU/L] | 7.5 [6.1–9.4] | 6.0 [4.0–9.0] | 5.3 [3.7–7.9] | 9.5 [7.3–12.4] |
| Insulin resistance index | 1.7 [1.3–2.2] | 1.4 [1.0–2.1] | 1.2 [0.8–1.8] | 2.2 [1.7–2.9] |
| HDL cholesterol [mmol/L] | 1.6 (0.4) | 1.5 (0.4) | 1.6 (0.4) | 1.4 (0.3) |
| Triglycerides [mmol/L] | 1.0 [0.7–1.4] | 1.1 [0.9–1.6] | 1.2 [0.9–1.6] | 0.8 [0.7–1.1] |
| SHBG Women [nmol/L] | 57 [42–78] | 50 [36–67] | – | 48 [35–64] |
| SHBG Men [nmol/L] | 32 [24–41] | 29 [22–37] | – | 30 [22–38] |
| SD-units SHBG per 1-SD gene score (beta [95%CI]), variance explained and corresponding F-statistics | ||||
| Gene Score A | 0.19 [0.16–0.22] | 0.20 [0.15–0.25] | – | – |
| R2 = 3.7% | R2 = 4.0% | |||
| F-statistic = 160 | F-statistic = 71 | |||
| Gene Score B | 0.15 [0.12–0.18] | 0.14 [0.10–0.19] | ||
| R2 = 2.2% | R2 = 2.0% | |||
| F-statistic = 93 | F-statistic = 35 | |||
The characteristics of the study populations were reported for the individuals with metabolic profiles. Values are mean (SD) for normally distributed and median [interquartile range] for skewed variables. Gene Score A is composed of 11 SHBG-correlated SNPs after excluding the pleiotropic GCKR variant. Gene Score B comprising 4 SNPs all located in the SHBG locus, including rs12150660, rs6258, rs1641537 and rs1625895.
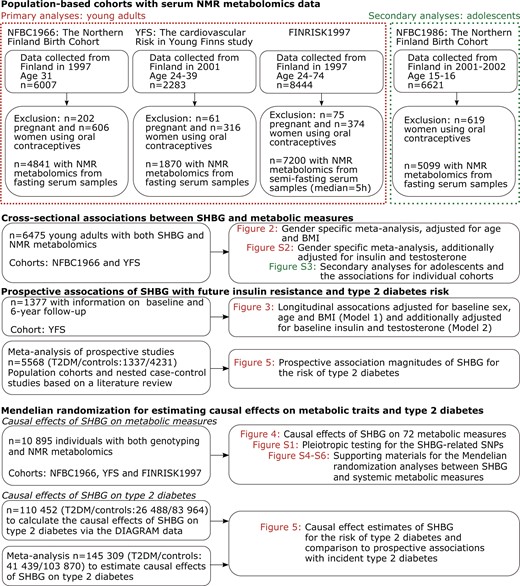
Overview of the study design, cohorts and statistical analyses.
Summary statistics for type 2 diabetes risk were available for 10 autosomal SNPs previously associated with circulating SHBG8 based on 26 488 cases and 83 964 controls from the DIAGRAM consortium.24 Mendelian randomization analysis of gene scores from the DIAGRAM summary statistics was used to estimate causal effects of SHBG on type 2 diabetes. The causality assessment in DIAGRAM was complemented by meta-analysis with previously published studies on the causal role of SHBG on type 2 diabetes; details and clinical characteristic of the population studies included in the meta-analysis have been described previously.3,4
Genotyping
The 11 genetic variants associated with SHBG and a pleiotropic variant in GCKR are described in Table S1 (available as Supplementary data at IJE online). Genotyping of these variants was conducted on HumanHap 370 k for NFBC1966, 670 k Illumina platform for YFS and Illumina core-exome chip for FINRISK. Variants not directly genotyped were imputed based on the 1000 Genomes April 2012 release.25
Instrumental variables
The prerequisite of a gene score being a valid instrument in Mendelian randomization analysis is that each genetic variant contributing to the score must be a valid instrumental variable in itself.7 However, the GCKR variant associated with SHBG in the prior GWAS study is known to display extensive pleiotropy with various lipids and metabolites as illustrated in Figure S1 (available as Supplementary data at IJE online).26–29 This violates a key requirement for Mendelian randomization.6,30 Therefore, the GCKR variant was excluded from the further analysis, and 11 genetic variants constitute the weighted gene score for SHBG (Gene Score A). To minimize the potential influence of pleiotropy,31 we further conducted Mendelian randomization analyses using a gene score composed solely of the four independent SNPs located in the SHBG locus (Gene Score B comprising rs12150660, rs6258, rs1641537 and rs1625895).
Metabolic profiling
SHBG was measured by an immunofluorometric assay in the NFBC studies and by Spectria SHBG IRMA in the YFS study. Total testosterone was measured by an automated chemiluminescence system in the NFBC studies and by the Spectria Testosterone kit in the YFS study. Insulin and C-reactive protein were measured as part of the clinical examinations. Insulin resistance was estimated by the HOMA-IR index.32
A high-throughput serum nuclear magnetic resonance (NMR) metabolomics platform was used to quantify 69 metabolites that represent a broad molecular signature of systemic metabolism.14,33 The fasting state serum samples were stored in a freezer at -80°C. The frozen samples were first slowly thawed in a refrigerator (+4°C) overnight prior to measurements. Aliquots of each sample (300 µl) were mixed with 300 µl of sodium phosphate buffer using a robotic Gilson Liquid Handler. The NMR data were acquired using a Bruker AVANCE III spectrometer operating at 500 MHz.33 The metabolite set covers multiple metabolic pathways, including lipoprotein lipids and subclasses, fatty acids and fatty acid compositions, as well as amino acids and glycolysis precursors. All molecular measures are quantified in a single experimental setup, constituting both established and novel metabolic risk factors.14 The applied NMR-based metabolic profiling has recently been used in various epidemiological and genetic studies34–39. Applications of this high-throughput metabolomics platform has recently been reviewed14 and details of the experimentation have been described elsewhere.33,40
Statistical analyses
Prior to statistical analyses, SHBG and metabolic measures were log-transformed and scaled to standard deviations (SD) in each cohort. For sex stratified cross-sectional analysis, sex-specific scaling was applied. Due to the correlated nature of the systemic metabolite measures, over 95% of the variation in the metabolic data was explained by 25 principal components in all three cohorts; therefore 25 was used as the number of independent tests defining multiple testing correction (Supplementary Methods, available as Supplementary data at IJE online).36 Thus, the value of P < 0.05 becomes P < 0.002 (0.05/25) when the multiple testing is taken into account.
Cross-sectional associations of SHBG with insulin resistance and circulating metabolites were analysed using linear regression models, stratified by sex, with each metabolic measure as outcome and SHBG as the explanatory variable. The regression models were adjusted for age (if applicable) and body mass index (BMI). Separate models were tested with additional adjustments for insulin and testosterone.10,41 The sex-stratified associations were meta-analysed across two cohorts (NFBC1966 and YFS) using inverse variance-weighted fixed-effects. To facilitate comparisons across metabolites, association magnitudes are reported in SD-units of metabolite concentration per 1-SD increment in SHBG. For each metabolic measure, statistical differences between the meta-analysed associations for men and women were assessed using a t-statistic.
The prospective association of SHBG with future insulin resistance was assessed using a linear regression model with 6-year follow-up HOMA-IR index as outcome and baseline SHBG as explanatory variable. The model was adjusted for baseline sex, age and BMI. A model with additional adjustments for baseline glucose, insulin and testosterone was also tested.
To evaluate the potential causative role of SHBG on metabolic measures, the genotypes were combined into a gene score for predisposition to elevated SHBG by summing the allele count for the 11 independent SNPs weighted by the effect size determined in a recent large-scale GWAS (Gene Score A).8 The gene score served as an instrumental variable to estimate the causal effects of SHBG on the metabolic measures.6,7 The causal effects for the metabolic measures were calculated via the ratio estimator, and the corresponding standard errors via the delta method (detailed formulation given in the Supplementary Methods, available as Supplementary data at IJE online).42,43 The causal effect estimates derived by the ratio estimator are equal to those derived by two-stage least squares method when a single instrument variable is used.44 The causal effect estimates were adjusted for sex, age and BMI. The causality assessment was repeated using Gene Score B comprised solely of four independent variants located in the SHBG locus. Since weights for the gene scores were obtained from a GWAS using adjustment for BMI,8 we retained BMI as a covariate when estimating the causal effects for SHBG on the circulating metabolites. Since NFBC1966 and YFS were part of the original SHBG GWAS study, sensitivity analysis using unweighted allele scores was conducted to avoid potential over-fitting.7
The potential causal role of SHBG on type 2 diabetes was examined using the two gene scores based on summary statistics from the DIAGRAM type 2 diabetes study.24 The X-chromosomal variant was not available in the DIAGRAM data and this SNP was therefore not included in Gene Score A here. The causal effect estimates and corresponding standard error for type 2 diabetes were calculated via the method proposed by Burgess et al.45 The principle of this method is to combine the ratio estimates from the individual variants using inverse-variance weights (see Supplementary Methods, available as Supplementary data at IJE online). To ease comparison with other studies, the causal effect estimate is reported as the odds ratio (OR) of type 2 diabetes per 1-SD SHBG. This was calculated as OR = exp(0.52·βIV) where βIV represents the change in log-odds per 1-unit SHBG. Here, 0.52 is the scaling factor to transform the unit from 1-unit SHBG to 1-SD SHBG; this value denotes the average standard deviation of log-transformed SHBG in YFS and NFBC1966.
Results
Three Finnish population-based cohorts with comprehensive lipid and metabolite profiling were analysed in this work (Table 1 and Figure 1). Prospective associations of SHBG with type 2 diabetes were assessed via meta-analysis of published studies based on a literature review. The causal role of SHBG on diabetes was examined by Mendelian randomization using multi-SNP gene scores on summary statistics from DIAGRAM consortium (26 488 cases and 83 964 controls). The causal effect estimates were further meta-analysed with prior studies on the causal role of SHBG.3,4
Cross-sectional analyses: SHBG and circulating lipids and metabolites
Cross-sectional associations of SHBG with the 69 metabolomics measures and insulin, HOMA-IR, and C-reactive protein are illustrated for men and women in Figure 2. For both sexes, numerous metabolic measures were associated with SHBG (38 measures for women and 46 measures for men at P < 0.002 in the meta-analyses). The associations were generally in the same direction for both genders, albeit stronger for men. Overall, higher SHBG was associated with metabolic biomarker differences linked with lower cardiometabolic risk. Prominent inverse associations were observed for insulin and inflammatory markers. Lipoprotein subclasses displayed a characteristic association pattern with SHBG: strong inverse associations for very-low-density lipoprotein (VLDL) subclasses and for VLDL particle size except for the very small VLDL. Despite the lack of associations with intermediate-density (IDL) and low-density (LDL) lipoprotein subclasses, LDL particle size associated positively with SHBG. High-density lipoprotein (HDL) subclasses displayed heterogeneous associations, with strong positive associations observed for the very large and large HDL subclasses and HDL particle size whereas there was no association with small HDL. The associations of SHBG with apolipoprotein B and A-I were in opposite directions, concurrent with the association pattern for lipoprotein subclasses. In addition, branched-chain and aromatic amino acids were strongly inversely associated with SHBG, with magnitudes comparable to those observed for VLDL subclasses and triglycerides. Ketone bodies were positively associated with circulating SHBG levels. The magnitudes of the cross-sectional associations of SHBG with the metabolic measures remained broadly similar when further adjusting for insulin and testosterone (Figure S2, available as Supplementary data at IJE online). The metabolite associations with SHBG were highly consistent across the two cohorts of young adults, and the association pattern further replicated in adolescents (mean age 16 years, n = 4834) as shown in Figure S3 (available as Supplementary data at IJE online).
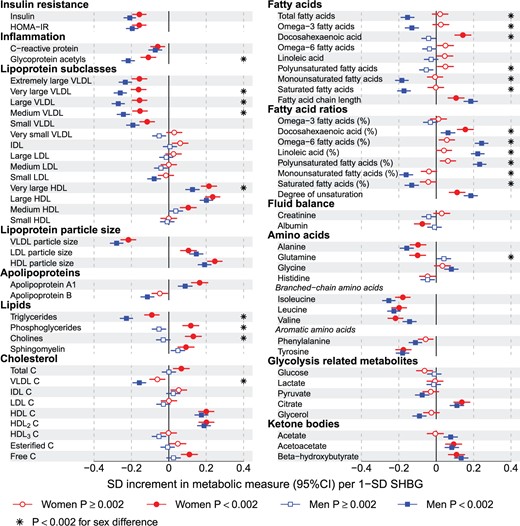
Cross-sectional associations of SHBG with systemic lipid and metabolite measures for men and women. The sex-specific associations are meta-analyses for 2778 women and 3697 men in the NFBC1966 and YFS. The associations are adjusted for age and BMI. Women are shown with circles and men with squares. Open and closed symbols indicate P ≥ 0.002 and P < 0.002, respectively. Sex differences with P < 0.002 are marked by asterisks.
The associations of SHBG with the metabolic measures tended to be stronger for men than for women (median 137%, interquartile range 64%–256%). The sex differences were even more pronounced if scaling the metabolite associations to the same absolute increment in SHBG concentration. Prominent sex differences (P < 0.002) were observed for multiple metabolic measures, including glycoprotein acetyls, VLDL and HDL subclasses, multiple lipids and glutamine. The most pronounced sex differences were observed for the fatty acids: strong positive associations were observed for the proportion of omega-6 and polyunsaturated fatty acids for men only. Similarly, inverse associations with the proportion of monounsaturated and saturated fatty acids were specific to men.
Prospective analyses: SHBG and future insulin resistance
The associations of baseline SHBG with 6-year glucose and HOMA-IR index are shown in Figure 3. The association magnitudes were similar for men and women, and therefore both sexes were combined to increase statistical power. Strong inverse associations were observed when adjusting for baseline sex, age and BMI (Model 1). Further adjustments for baseline glucose, insulin and testosterone attenuated the associations, but baseline SHBG remained associated with 6-year HOMA-IR index (β = −0.08, 95% CI:−0.13, −0.03; P = 7 × 10⁻⁴ as shown in Model 2 of Figure 3.
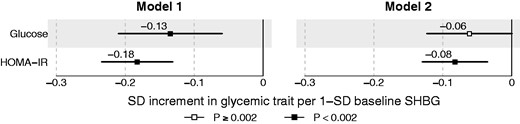
Prospective associations of baseline SHBG and 6-year glycaemic traits. The analyses are conducted for 1377 individuals from the YFS. The prospective associations are adjusted for baseline sex, age and BMI (Model 1) and further for baseline glucose, insulin and testosterone (Model 2). Open and closed squares indicate P ≥ 0.002 and P < 0.002, respectively.
Mendelian randomization analyses: causal effects of SHBG on metabolic traits
A weighted gene score composed of 11 genetic variants for elevating SHBG was used as the genetic instrument (Gene Score A). Gene score A was strongly associated with circulating SHBG levels, explaining on average 4% of the SHBG variation with F-statistic = 228 (Table 1), indicating that Gene score A is a robust instrument.45 Neither individual genetic variants nor the gene score were associated with potential confounders including sex, age and BMI (Figure S4, available as Supplementary data at IJE online). Men and women were combined for the Mendelian randomization analyses to increase the statistical power, since there were no robust interactions between the gene score and sex with respect to the metabolic measures. The causal effect estimates did not provide evidence for a causative role of SHBG on any of the 72 metabolic measures examined (Figure 4). The overall match between the causal estimates and the cross-sectional metabolite associations with SHBG was mediocre, with a linear fit of slope 0.23 ± 0.04 (R2 = 0.29; Figure S5, available as Supplementary data at IJE online). The fit indicates that there was a tendency towards similar direction of association for observational and causal effects; however, the causal estimates were in general considerably weaker than the observational associations. To minimize the potential influence of pleiotropy,31 we further conducted Mendelian randomization analysis using a gene score composed solely of the 4 SNPs located in the SHBG locus (Gene Score B with rs12150660, rs6258, rs1641537 and rs1625895). Gene score B explained on average 2% variation of circulating SHBG with F statistic = 124. Causal estimates based on Gene Score B indicated similar weak causal effect estimates as for Gene Score A (Figure 4), and poor correspondence with the cross-sectional associations (linear fit slope 0.19 ± 0.05, R2 = 0.17; Figure S6, available as Supplementary data at IJE online). A sensitivity assessment using the unweighted allele score gave highly similar results (Figure 4). Analogous results were also obtained when BMI was excluded from the model, or when further accounting for population stratification by adjusting for the first four principal components (data not shown).
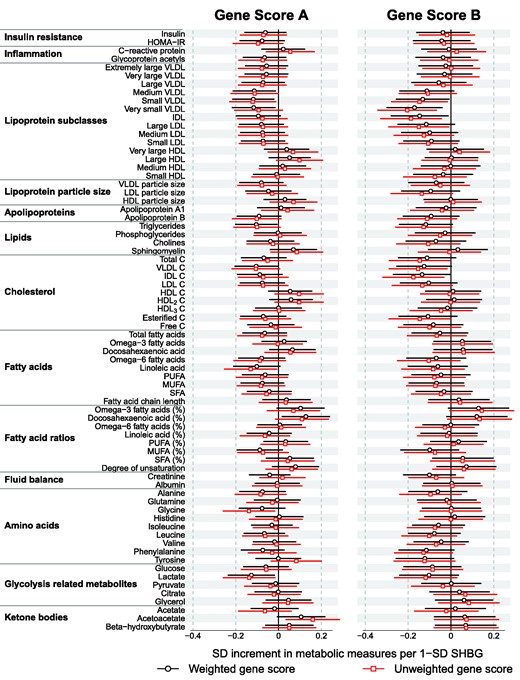
Mendelian randomization for the causal effect estimates of SHBG for 72 metabolic measures. Mendelian randomization analyses were conducted for 10 895 individuals across three cohorts, using both weighted and unweighted gene scores as the instrument. The causal effect estimates were adjusted for sex, age and BMI. Gene score A is composed of 11 independent SHBG-associated SNPs after excluding the pleiotropic GCKR variant. Gene Score B is composed of four SNPs all located in the SHBG locus, including rs12150660, rs6258, rs1641537 and rs1625895. P ≥ 0.002 for all the causal effect estimates.
Mendelian randomization analyses: causal effects of SHBG on type 2 diabetes
To estimate the causal effects of SHBG on type 2 diabetes, we used the two SHBG-gene scores and summary statistics from DIAGRAM consortium.24 Summary statistics were available for up to 26 488 cases and 83 964 controls for all 11 variants except for the one at chromosome X. Thus,10 genetic variants comprised Gene Score A and we used the formulation by Burgess et al. to combine effect estimates from a multilocus instrument.45 Evidence for weak causal effects of SHBG on diabetes was found for both Gene Score A (OR = 0.89, 95% CI: 0.80, 0.99; P = 0.04) and for Gene Score B (OR = 0.88; 95% CI: 0.77, 1.00; P = 0.05) per 1-SD increment of SHBG (Figure 5). The results from the DIAGRAM consortium were further meta-analysed for a total of 41 439 diabetes cases and 103 870 controls by including the causal estimates obtained by Perry et al.3 in cohorts not part of the DIAGRAM consortium (based on rs1799941) and Ding et al.4 (based on rs6257 and rs6259). As illustrated in Figure 5, the meta-analysis of causal estimates further corroborated a weak protective role of higher SHBG on diabetes risk: OR = 0.83 per 1-SD, 95% CI: 0.76, 0.91; P = 9 × 10⁻⁵.
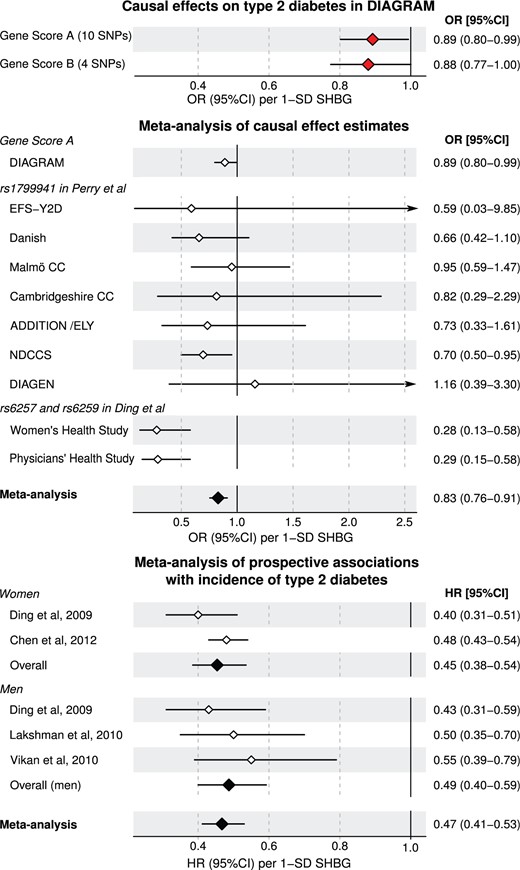
Causal effect estimates and prospective associations of SHBG with type 2 diabetes. The odds ratios (for causal estimates) and hazard ratios (for prospective associations) are shown per 1-SD increment SHBG so that the association magnitudes are directly comparable. The causal effect estimates were obtained via Mendelian randomization using the most recent summary statistics from DIAGRAM consortium for up to 26 488 cases and 83 964 controls. These results were meta-analysed with prior studies that were not included in DIAGRAM.3,4 The meta-analysis of prospective studies on SHBG and the risk of incident type 2 diabetes were based on a literature review. Two studies included women4,46 and three studies men.4,47,48 Details of the prospective studies are described in Table S2 (available as Supplementary data at IJE online). Open and closed diamonds indicate individual and meta-analysis associations, respectively.
The causal effect estimates were compared with meta-analysis of four prospective studies on SHBG with the risk for incident type 2 diabetes based on a literature review (Table S2, available as Supplementary data at IJE online).4,46–48 The prospective associations of SHBG with incident diabetes were consistent and robust across the four studies (Figure 5). The observational associations in meta-analysis were several fold stronger (hazard ratio 0.47) than the causal effect estimates and the confidence intervals did not overlap (95% CI: 0.41, 0.53).
Discussion
Previous Mendelian randomization analyses on the causality of circulating SHBG on type 2 diabetes have been inconclusive.3–5 Our results, using a multilocus instrument based on summary statistics from the DIAGRAM consortium24 and a further meta-analysis with prior Mendelian randomization studies, indicate a causal protective role of SHBG on type 2 diabetes. However, the sizeable discrepancy between the prominent prospective associations and the weaker causal effect estimates suggest that the observational results are partly confounded. These findings may suggest that circulating SHBG affects sex hormones, which in turn could confer part of the risk for type 2 diabetes. Consistent with the partly confounded observational associations, we showed that circulating SHBG levels are also predictive for future insulin resistance in healthy young adults, whereas Mendelian randomization analysis did not indicate a causal role of SHBG on insulin resistance. Further, detailed metabolic profiling of 6475 young adults from two population-based Finnish cohorts revealed a plethora of new molecular information demonstrating that SHBG is strongly associated with numerous circulating markers for the risk of diabetes and cardiovascular disease including lipoprotein subclasses, various lipids and fatty acids as well as low-molecular-weight metabolites.17,19,37–39,49 Even though the observational associations between circulating SHBG and lipids and metabolites were prominent, the Mendelian randomization analyses provided only limited evidence for even a weak causal role of SHBG on these cardiometabolic biomarkers.
Circulating SHBG is intrinsically linked with the complex myriad of metabolic perturbations accompanying insulin resistance and adiposity.17,34,37–39,50 Comprehensive metabolic profiling here revealed that higher circulating SHBG concentrations in young adults were related to numerous metabolic deviations characterizing a less risk-prone cardiometabolic profile.17,34,38,50,51 Previously reported associations of SHBG with routine lipid measures10,11 were extended to the lipoprotein subclass level, thereby elucidating substantial heterogeneity of associations with HDL subclasses. Novel, strong associations were observed for various fatty acids, branched-chain and aromatic amino acids, and ketone bodies. Overall, the metabolic associations with higher SHBG followed a similar pattern of metabolic perturbations as previously reported for a lower degree of adiposity and higher insulin sensitivity.17,18,29,38,50,51 Broadly, 1-SD higher SHBG level (0.47 natural-log nmol/l for women; 0.41 natural-log nmol/l for men) was associated with similar metabolic deviations as caused by having 2–3 kg/m2 lower BMI.38 Nevertheless, the metabolite associations with SHBG remained robust when adjusting for both BMI and insulin, suggesting that SHBG levels reflect numerous metabolic risk perturbations at least partly independent of these coarse measures of adiposity and insulin resistance. Higher adiposity has recently been demonstrated to be causal for lower levels of circulating SHBG;38 however, this mediation is insufficient to explain the strong observational associations between SHBG and circulating metabolites independent of obesity and insulin resistance. One may speculate that various sex hormonal effects not assayed in these large population cohorts could potentially drive the observed metabolic signature of SHBG; however, the molecular underpinnings remain elusive.
The detailed metabolic profiling revealed multiple sex interactions in the associations with SHBG. The metabolic perturbations were generally stronger for men— only in men was SHBG associated with monounsaturated and saturated fatty acids, both emerging biomarkers of the risk of cardiovascular disease39and type 2 diabetes.17 The aetiological underpinnings of these prominent sex interactions remain unknown, however similar trends in sex differences have been reported for fatty acid associations with adiposity.38 Despite of these sex differences for the metabolic associations, the prospective estimates of SHBG with the risk of insulin resistance and diabetes were similar for men and women (Figures 4 and 5).
Circulating SHBG levels have been inversely associated with the risk for type 2 diabetes in multiple prospective studies.4,46–48,52 Concordantly, our prospective analyses indicated that circulating SHBG is predictive of the degree of insulin resistance and glycaemia at 6-year follow-up, even when adjusting for baseline insulin and testosterone levels. These findings extend the link between SHBG and future insulin resistance to young adults, and thus to early manifestations of the pathogenesis of type 2 diabetes. Despite the prospective associations of SHBG with insulin resistance and glycaemia, such observational associations are known to be susceptible to confounders and reverse causation.6,30 Here, Mendelian randomization analysis indicated only very weak, if any, causal effects of SHBG on the panel of detailed lipid measures, metabolites and insulin resistance. The null associations on glucose and insulin resistance for both gene scores for SHBG are in line with the results from the MAGIC consortium indicating no association of rs1799941 near the SHBG gene with intermediate glycaemic traits.3
Prominent causal effects of SHBG on type 2 diabetes risk have previously been suggested based on Mendelian randomization analysis, with effect sizes similar3 or stronger4 for the genetic associations than expected based on observational estimates. The meta-analysis of Mendelian randomization in the present study corroborated a causal protective role of SHBG, but also indicated that the causal effect estimates were several fold weaker than the corresponding observational estimates based on the meta-analysis of prospective studies on incident type 2 diabetes. These results seem to suggest that the prospective associations are partly confounded rather than conferred entirely via circulating SHBG. It is possible that the influence of SHBG on binding androgens and oestrogens may contribute to mediate the prominent observational associations. Whereas the protective role of SHBG on type 2 diabetes is in line with prior Mendelian randomization analyses, the discrepancy between causal and observational effects contrasts with prior studies.
There are two main reasons for this mismatch: the meta-analysis of causal effects including a multi-locus gene score from the DIAGRAM consortium indicated weaker causal effects than suggested by earlier Mendelian randomization studies,3,4 and the meta-analysis of prospective studies demonstrated more prominent observational results than estimated based on small cross-sectional settings.3 Specifically, the causal effect estimate obtained in the meta-analysis by Perry and co-workers was OR = 0.73 (0.62–0.86) when scaled to 1-SD SHBG based on rs1799941. This variant is in strong linkage disequilibrium (R2 = 0.95) with rs12150660 included in both of the gene scores here employed for the causality assessment in the DIAGRAM consortium, and the confidence intervals of the estimates are overlapping. However, the expected observational association magnitude from Perry et al. (OR = 0.65 [0.53–0.80] per 1-SD SHBG) was estimated based on SHBG concentration differences between a small number of diabetes cases and controls (n = 389/2719) from cross-sectional studies.3
In contrast, the observational estimate from the present meta-analysis of studies on incident type 2 diabetes (Figure 5) provide narrow confidence intervals and are less biased due to the prospective design. With these more accurate prospective associations, even the causal estimates from Perry et al. are consistent with partial confounding of the observational associations, as concluded based on the present meta-analysis. As discussed in detail elsewhere,3 the study by Ding et al.4 was small in terms of Mendelian randomization requirements, and the very low odds ratio for diabetes is likely not reflecting the true effect size. Finally, although the study by Svartberg et al. concluded against a causal role of SHBG based on rs1799941, the direction of association in that study of 570 cases and 1499 controls was towards a weak protective effect for type 2 diabetes, that is, in accordance with the present meta-analysis.5
This study has both strengths and limitations. Our cross-sectional analyses were conducted in large, homogeneous population-based cohorts at young age, and further replicated in adolescents. Analyses of young individuals limit the influences of ageing and comorbidities;53 however, we acknowledge that association magnitudes of SHBG with metabolites may differ at older age and in other ethnicities. Although large sample size (n = 10 895) was used to assess the causal effects of SHBG on circulating lipids and metabolites, inference of weak causal effects may still require stronger statistical power as evident in the case of diabetes.
Pleiotropy is a potential concern in Mendelian randomization; the use of a multigenic instrument is helpful in this regard as it dilutes the effects of single variant pleiotropy.6 Results were further consistent between the multigenic instrument and the instrument comprising solely the variants in the SHBG locus, suggesting that the causal effect estimates are not biased by pleiotropy from a specific gene. Since gene score B was solely composed of four independent variants in SHBG, it is implausible that pleiotropic effects of this gene score could be mediated via sex hormones rather than arise from a primary effect on circulating SHBG that subsequently may influence other molecules to confer the diabetes risk. Although genetic variants in the SHBG region have previously been associated with testosterone levels,5,54 the proportion of testosterone variance explained by Gene Score A or B is small (R2 < 0.3%) compared to the prominent SHBG association (R2 = 4%). This small effect on testosterone is consistent with vertical pleiotropy, and thus not a violation of the assumptions underlying Mendelian randomization.6,55 Methods such as MR-Egger, which allow for invalid instruments given certain assumptions, could be used to further interrogate this association.56
Finally, circulating oestrogen levels were not assessed in the present study and no strong genetic instrument is currently available to examine if oestrogen could potentially underpin the discrepancy between weak causal effects and strong observational associations.
In conclusion, SHBG was strongly associated with multiple circulating lipids and metabolites reflecting the degree of adiposity and insulin resistance, and prospectively associated with the development of insulin resistance in early adulthood. These associations remained robust after adjustment for baseline adiposity, insulin and testosterone levels. Despite the prominent metabolic associations with SHBG, the Mendelian randomization analyses suggested at best weak causal effects of SHBG on lipids, metabolites and insulin resistance. In contrast, our large meta-analysis of causal effects based on Mendelian randomization indicated a protective role of higher SHBG on type 2 diabetes risk. Nonetheless, the contrasting results between the strong prospective associations but modest causal estimates suggest that the observational results are partly confounded. Potential interventions aiming to elevate SHBG levels might therefore not be as effective for alleviating the risk for type 2 diabetes as suggested previously.4 It is plausible that hormones binding to SHBG could contribute to conferring the prominent risk for type 2 diabetes and the metabolic association pattern linked with SHBG. In support of this, meta-analyses of randomized controlled trials have suggested that testosterone administration would improve insulin resistance in men57 and that oestrogen administration would reduce diabetes in women.58 Consequently, further studies are required to address whether hormone binding to SHBG may underpin the observed associations of SHBG with cardiometabolic risk markers and type 2 diabetes.
Supplementary Data
Supplementary data are available at IJE online.
Funding
The quantitative serum NMR metabolomics platform and its development have been supported by the Academy of Finland, TEKES (the Finnish Funding Agency for Technology and Innovation), the Sigrid Juselius Foundation, the Novo Nordisk Foundation, the Finnish Diabetes Research Foundation, the Paavo Nurmi Foundation, and the strategic and infrastructural research funding from the University of Oulu, Finland, as well as by the British Heart Foundation, the Wellcome Trust and the Medical Research Council, UK. The Young Finns Study has been financially supported by the Academy of Finland: grant numbers 134309 (Eye), 126925, 121584, 124282, 129378 (Salve), 117797 (Gendi), and 41071 (Skidi), the Social Insurance Institution of Finland, Kuopio, Tampere and Turku University Hospital Medical Funds, Juho Vainio Foundation, Sigrid Juselius Foundation, Yrjö Jahnsson Foundation, Paavo Nurmi Foundation, Finnish Foundation for Cardiovascular Research and Finnish Cultural Foundation, Tampere Tuberculosis Foundation and Emil Aaltonen Foundation. V.S. has received funds from the Academy of Finland (grant number 139635) and from the Finnish Foundation for Cardiovascular Research. J.K. was supported through funds from the Academy of Finland (grant number 283045).
Conflict of interest: A.J.K., P.S., P.W. and M.A.K. are shareholders of Brainshake Ltd (www.brainshake.fi), a company offering NMR-based metabolite profiling. Q.W., A.J.K., P.S., M.T., T.T., P.W., and J.K. report employment and consulting for Brainshake Ltd. Other authors did not report any disclosures.
References
Author notes
†These authors are joint senior authors of this work.

