


Abstract
Aims LV reverse remodelling has been shown to be a favourable response after cardiac resynchronization therapy (CRT) in many clinical trials. This study investigated whether left ventricular (LV) reverse remodelling after CRT has any structural benefit, which include the improvement of LV mass or regional wall thickness.
Methods and results Fifty patients (66±11 years) receiving CRT were followed up for at least 3 months. Echocardiography with tissue Doppler imaging was performed serially before and at day 1 and 3 months after CRT. Although LV end-systolic volume (LVESV) was decreased at day 1 after CRT (141±74 vs. 129±71 cm3, P<0.001), further LV reverse remodelling was observed at 3 months (110±67 cm3, P<0.001 vs. day 1). LV ejection fraction increased at day 1 (26.5±9.3 vs. 28.5±9.1%, P<0.005) and was further improved at 3 months (34.2±10.5%, P<0.001 vs. day 1). However, reduction of LV mass (231±67 vs. 213±59 g, P<0.001) and regional wall thickness was only observed at 3 months, but not at day 1. The improvement of LV mass correlated with the change in LVESV (r=0.66, P<0.001) and the baseline systolic asynchrony index (Ts-SD) (r=−0.52, P<0.001). LV mass was only decreased significantly in responders of LV reverse remodelling (245±66 vs. 207±61 g, P<0.001), but increased in non-responders (209±64 vs. 223±56 g, P=0.02). Responders had significant decrease in thickness of all the four walls for −6 to −11% (all P≤0.02), whereas non-responders had increased thickness in septal and lateral walls for +11% (both P<0.05).
Conclusion The acute reduction in LV volume after CRT is mediated by haemodynamic and geometric benefits without actual changes in LV mass. However, at 3-month follow-up, reduction in LV mass and regional wall thickness was demonstrated, which represents structural reverse remodelling. Such benefit was only observed in volumetric responders but was worsened in non-responders.
Introduction
Cardiac resynchronization therapy (CRT) has become an established treatment for patients with advanced chronic heart failure and prolonged QRS complexes.1–4 Clinical data have confirmed the benefits of CRT on symptoms, exercise capacity, quality-of-life, left ventricular (LV) reverse remodelling, and long-term prognosis including mortality and heart failure hospitalization.1–6 In fact, LV reverse remodelling detected by echocardiography or other non-invasive methods is an objective endpoint, which is thought to contribute to the symptomatic benefits of CRT7 and may herald the improvement of long-term survival.5,6,8–10 Recently, a 10% reduction of LV end-systolic volume (LVESV) after CRT for 3 to 6 months is found to be associated with a significantly lower all-cause mortality and heart failure events.5 Therefore, LV reverse remodelling has recently been adopted as an endpoint measure to signify functional improvement of LV in multicentre trials of CRT.11 Our previous studies observed that a small but significant degree of reduction in LV volume and gain in EF was obtained even after CRT for less than 48 h.12 Apart from this functional and geometrical improvement, the MIRACLE study also reported reduction of LV mass from 3 to 6 months after CRT,6 whereas other studies found no evidence of such changes. The study of LV mass by M-mode echocardiography is limited by the over-simplified nature of measurement, in particular it is invalid in the population with regional asynchrony.13,14 In order to confirm any structural change in the LV and calculate the LV mass more precisely, the use of careful method based on two-dimensional echocardiography is helpful, which will provide information on both global and regional changes in LV. This study examined whether chronic LV reverse remodelling is contributed by a reduction of LV mass apart from haemodynamic and geometric benefits after the therapy and determined whether there is any difference in structural remodelling between volumetric responders and non-responders.
Methods
Patients
The study population consisted of 50 patients (66±11 years) with advanced congestive heart failure, who had received CRT and followed up for at least 3 months. The inclusion criteria of CRT included symptomatic heart failure despite optimal pharmacological therapy, New York Heart Association (NYHA) class III or IV heart failure, evidence of LV systolic dysfunction with an EF <40%, and QRS duration >120 ms in the form of bundle branch block or intraventricular conduction delay. The demographic and clinical characteristics of the patients are shown in Table 1. Serial standard echocardiography with tissue Doppler imaging (TDI) was performed at baseline, day 1, and 3 months after CRT. Clinical assessment was also performed at baseline and 3 months after CRT. The study protocol was approved by the Ethics Committee, and the written informed consent was obtained from each participant.
Baseline demographic and clinical characteristics of the study population
| Parameters | Patients (n=50) |
|---|---|
| Age (years) | 66±11 |
| Sex (male/female) | 36/14 |
| NYHA class (III/IV) | 40/10 |
| Cause of heart failure (ischaemic/non-ischaemic) | 24/26 |
| Quality-of-life score | 34±25 |
| 6 min hall walk distance (m) | 313±105 |
| QRS duration on ECG (ms) | 151±27 |
| Medication (n) (%) | |
| Diuretics | 50 (100) |
| ACE-inhibitors or angiotensin receptor blockers | 48 (96) |
| β-blockers | 39 (78) |
| Spironolactone | 18 (36) |
| Digoxin | 11 (22) |
ACE, angiotensin-converting enzyme.
Biventricular device implantation
Biventricular devices were implanted as previously described.4,7 The LV pacing lead was inserted by a transvenous approach through the coronary sinus into either the lateral or postero-lateral cardiac vein in all but five patients. It was placed in the antero-lateral vein in three patients and in the anterior cardiac vein in another two patients. Thirty-seven patients received an Attain system [Model 2187, Model 4189, Model 4191 (side-wire lead), or Model 4193 (over-the-wire lead)] (Medtronic Inc., Minneapolis, MN, USA) and 13 received the Easytrak over-the-wire lead (Model 4512, Guidant Inc., St Paul, MN, USA). Only three patients had CRT+defibrillator devices (InSync ICD or Contak CD), whereas all the others received biventricular pacemakers (InSync, InSync III, Contak TR, or Contak TR II).
Echocardiography
Echocardiography with TDI was performed (Vivid 5 or Vivid 7, Vingmed-General Electric, Horten, Norway) serially before CRT, day 1 after implantation, and 3 months after CRT. The atrioventricular interval was optimized by Ritter's method at day 1 after implantation to reach maximal transmitral diastolic filling.15 The LV volumes and EF were assessed by biplane Simpson's equation using the apical four-chamber and two-chamber views, where the length of the ventricular image was maximized. The LV mass was measured by the two-dimensional method using area-length formula as previously described.16 The mid-ventricular short-axis view at the level of papillary muscle tips at end-diastolic frame was used for tracing the epicardial and cavity areas. In the same view, LV regional wall thickness was measured at the 3, 6, 9, and 12 O'clock positions which represent lateral, inferior, septal, and anterior walls, respectively. The intra- and inter-observer variabilities for volumetric analysis were 4 and 5%, respectively.7 The LV mass assessment was performed by one observer who was blinded to the other measurements. Cardiac output, LV sphericity indices, rate of pressure rise in systole (+dp/dt), and mitral regurgitation were measured as previously described.7,17,18
Two-dimensional colour TDI was performed using apical views (apical four-chamber, two-chamber, and long-axis views) for the long-axis motion of the ventricles as previously described.7,19,20 At least three consecutive beats were stored, and the images were analysed offline by a customized software package (EchoPac PC, Vingmed-General Electric, Horten, Norway). Myocardial velocity curves were reconstituted offline using the 6-basal, 6-mid segmental model in the LV as previously described.7,20,21 Regional peak myocardial systolic velocity during ejection phase (Sm) and the time to the peak systolic velocity during ejection phase (Ts) were measured in each segment.7,22–24 Parameters of systolic asynchrony were measured, which included systolic asynchrony index (Ts-SD, i.e. the standard deviation of Ts among the 12 LV segments), the maximal difference in Ts between any two out of the 12 LV segments (Ts-12-dif), and the absolute difference in Ts between the basal septal and basal lateral segments (Ts-sept-lat).7,21
Statistical analyses
For comparison of parametric variables between different time-points, i.e. baseline, day 1, and 3 months after CRT, paired sample t-test with Bonferroni correction was used. The comparison of continuous clinical and echocardiographic parameters between volumetric responders and non-responders was performed by unpaired t-test. Correlation analysis was used to compare the relationship between parameters of systolic asynchrony and the change of LV mass or wall thickness in a univariate model. All parametric data were expressed as mean±SD. A P-value <0.05 was considered statistically significant where two-sided test was used.
Results
Changes in LV volume, LV mass, LV regional wall thickness, and clinical parameters after CRT
On the first day after CRT, the optimal atrioventricular interval was 101±27 ms. The LV end-diastolic volume (LVEDV) (P<0.001) and LVESV (P<0.001) were significantly reduced with gain in ejection fraction (EF) (P=0.005). The LV end-systolic sphericity index was increased (P=0.006). However, there was no significant change in LV mass (P=0.493). The LV mid-wall thickness in the four regions was also unchanged (Table 2 and Figure 1). Other echocardiographic parameters of cardiac function were improved, which included mitral regurgitation (P<0.001) and +dp/dt (P=0.030). There was a trend but insignificant increase in cardiac output (Table 2).
Changes in (A) LVEDV and LVESV. *P<0.001 vs. baseline. †P<0.005 vs. day 1. ‡P<0.001 vs. day 1. (B) LV mass over the time after CRT. *P<0.001 vs. baseline. †P<0.001 vs. day 1.
Comparison of clinical parameters, LV volume, mass, and other echocardiographic parameters of cardiac function at baseline, day 1, and 3 months after CRT
| Parameters | Baseline | Day 1 | 3 months | P-value | ||
|---|---|---|---|---|---|---|
| Day 1 vs. baseline | 3 months vs. day 1 | 3 months vs. baseline | ||||
| LVEDV (cm3) | 187±83 | 175±81 | 161±82 | <0.001 | 0.003 | <0.001 |
| LVESV (cm3) | 141±74 | 129±71 | 110±67 | <0.001 | <0.001 | <0.001 |
| LVEF (%) | 26.5±9.3 | 28.5±9.1 | 34.2±10.5 | 0.005 | <0.001 | <0.001 |
| LV mass (g) | 231±67 | 239±71 | 213±59 | 0.493 | 0.001 | <0.001 |
| Anterior wall thickness (cm) | 1.00±0.24 | 1.09±0.22 | 0.94±0.20 | 0.055 | <0.001 | 0.036 |
| Inferior wall thickness (cm) | 0.99±0.23 | 1.04±0.18 | 0.96±0.19 | 0.227 | 0.009 | 0.259 |
| Septal wall thickness (cm) | 1.06±0.26*,† | 1.12±0.17† | 1.02±0.20*,† | 0.256 | 0.003 | 0.119 |
| Lateral wall thickness (cm) | 1.03±0.23† | 1.08±0.16 | 1.02±0.19*,† | 0.223 | 0.035 | 0.560 |
| Cardiac output (L/min) | 2.8±0.8 | 3.0±0.6 | 3.1±0.7 | 0.058 | 0.074 | 0.039 |
| Sphericity index, end-diastole | 1.65±0.23 | 1.69±0.30 | 1.73±0.35 | 0.246 | 0.342 | 0.029 |
| Sphericity index, end-systole | 1.74±0.27 | 1.82±0.34 | 1.89±0.43 | 0.006 | 0.124 | 0.004 |
| Mitral regurgitation (%) | 31.5±19.2 | 22.6±19.0 | 21.1±18.4 | <0.001 | 0.766 | <0.001 |
| +dp/dt (mmHg/s) | 604±202 | 780±264 | 897±315 | 0.030 | 0.042 | 0.002 |
| NYHA class | 3.2±0.4 | — | 2.4±0.5 | — | — | <0.001 |
| 6 min hall walk (m) | 313±105 | — | 365±89 | — | — | <0.001 |
| MLWHF quality-of-life score | 34±25 | — | 17±17 | — | — | <0.001 |
3 months, 3 months after CRT; +dp/dt, rate of pressure rise in systole; MLWHF, Minnesota Living With Heart Failure quality-of-life score.
*P<0.01 vs. anterior wall.
†P<0.05 vs. inferior wall within the same column.
At the end of 3 months after CRT, there was an obvious LV reverse remodelling response as reflected by further reduction in LVEDV (P<0.001 vs. baseline, P=0.003 vs. day 1) and LVESV (P<0.001 vs. baseline, P<0.001 vs. day 1). The LVEF was further increased (P<0.001 vs. baseline, P<0.001 vs. day 1). The sphericity index at end-diastole (P=0.039 vs. baseline) and end-systole (P=0.004 vs. baseline) were improved. Moreover, the LV mass was significantly reduced (P<0.001 vs. baseline). Reduction of LV mid-wall thickness was observed in the anterior wall when compared with baseline (P=0.036) (Table 2 and Figure 1). Interestingly, the septal/lateral wall thicknesses were significantly greater than that of the anterior/inferior wall, for both baseline and after CRT for 3 months (Table 2). For other echocardiographic parameters of cardiac function, they were improved at 3 months, namely +dp/dt (P=0.002), cardiac output (P=0.039), and mitral regurgitation (P<0.001), when compared with baseline (Table 2). Clinical assessment showed significant improvement of NYHA class, quality-of-life, and 6 min hall walk distance after CRT for 3 months (all P<0.001).
LV mass, LV regional wall thickness, and its relationship with LV reverse remodelling response
Successful LV reverse remodelling was defined by a reduction of LVESV ≥10% at 3 months after CRT when compared with baseline.5 By this criterion, 30 (60%) patients were labelled as volumetric responders, whereas 20 patients were non-responders in whom the reduction of LVESV was <10%. These two groups have comparable baseline echocardiographic characteristics with similar LV volume, LV mass, and systolic and diastolic functions (Table 3). In contrast, the changes in cardiac mass and function were very different between the two groups.
Comparison of clinical parameter, LV volume, mass, and other echocardiographic parameters of cardiac function according to status of response to CRT
| Parameters | Responders (n=30) | Non-responders (n=20) | ||||
|---|---|---|---|---|---|---|
| Baseline | 3 months | P-value | Baseline | 3 months | P-value | |
| LVEDV (cm3) | 179±74 | 134±64* | <0.001 | 199±95 | 201±89 | 0.507 |
| LVESV (cm3) | 135±68 | 86±49* | <0.001 | 149±85 | 147±74 | 0.598 |
| LVEF (%) | 26.1±8.6 | 37.9±9.1* | <0.001 | 27.1±10.5 | 28.6±10.0 | 0.115 |
| Sphericity index, end-diastole | 1.67±0.21 | 1.88±0.36* | <0.001 | 1.63±0.27 | 1.52±0.17 | 0.009 |
| Sphericity index, end-systole | 1.73±0.25 | 2.03±0.45* | <0.001 | 1.76±0.30 | 1.66±0.24 | 0.020 |
| LV mass (g) | 245±66 | 207±61 | <0.001 | 209±64 | 223±56 | 0.020 |
| Anterior wall thickness (cm) | 1.12±0.17§ | 1.00±0.19‡ | <0.001 | 0.83±0.22 | 0.88±0.20 | 0.120 |
| Inferior wall thickness (cm) | 1.10±0.18§ | 1.02±0.18† | 0.006 | 0.81±0.17 | 0.87±0.15 | 0.109 |
| Septal wall thickness (cm) | 1.19±0.21§,‖,** | 1.07±0.18‡,‖ | <0.001 | 0.86±0.21 | 0.94±0.20 | 0.040 |
| Lateral wall thickness (cm) | 1.15±0.18§ | 1.07±0.19‡,‖ | 0.020 | 0.87±0.20** | 0.95±0.18** | 0.030 |
| Cardiac output (L/min) | 2.9±0.9 | 3.1±0.6 | 0.010 | 3.0±1.6 | 3.2±0.8 | 0.459 |
| Mitral regurgitation (%) | 32.4±19.3 | 22.3±18.3 | 0.001 | 30.9±23.7 | 19.1±18.9 | 0.050 |
| MPI | 1.03±0.29 | 0.88±0.21 | 0.010 | 1.00±0.54 | 0.94±0.30 | 0.477 |
| +dp/dt (mmHg) | 590±218 | 1016±369 | 0.010 | 576±90 | 867±299 | 0.020 |
| NYHA class | 3.3±0.4 | 2.2±0.4‡ | <0.001 | 3.1±0.3 | 2.6±0.6 | 0.004 |
| 6 min hall walk (m) | 298±105 | 349±96 | 0.001 | 336±104 | 389±74 | 0.001 |
| MLWHF quality-of-life score | 35±25 | 17±18 | <0.001 | 34±25 | 16±14 | 0.004 |
*P≤0.001.
†P≤0.005.
‡P<0.05 vs. non-responders after CRT for 3 months.
§P<0.001 vs. non-responders at baseline.
‖P<0.05 vs. anterior wall.
**P<0.05 vs. inferior wall within the same column.
In the responders of LV reverse remodelling, there was significant decrease in LV mass (P<0.001) and increase in both end-diastolic (P<0.001) and end-systolic (P<0.001) sphericity index. The LVEF (P<0.001) was increased. The myocardial performance index was improved (P=0.01). The LV mid-wall thickness was significantly decreased in all the regions studied, namely septal (P<0.001), lateral (P=0.02), anterior (P<0.001), and inferior walls (P=0.006) (Table 3).
On the contrary, non-responders of LV reverse remodelling had significant increase in LV mass (P=0.02). The sphericity index was significantly worsened, indicating a more globular shaped heart (P=0.02). Furthermore, the LV regional wall thickness not only showed no improvement but was further increased in both the septal (P=0.04) and lateral (P=0.03) walls (Table 3).
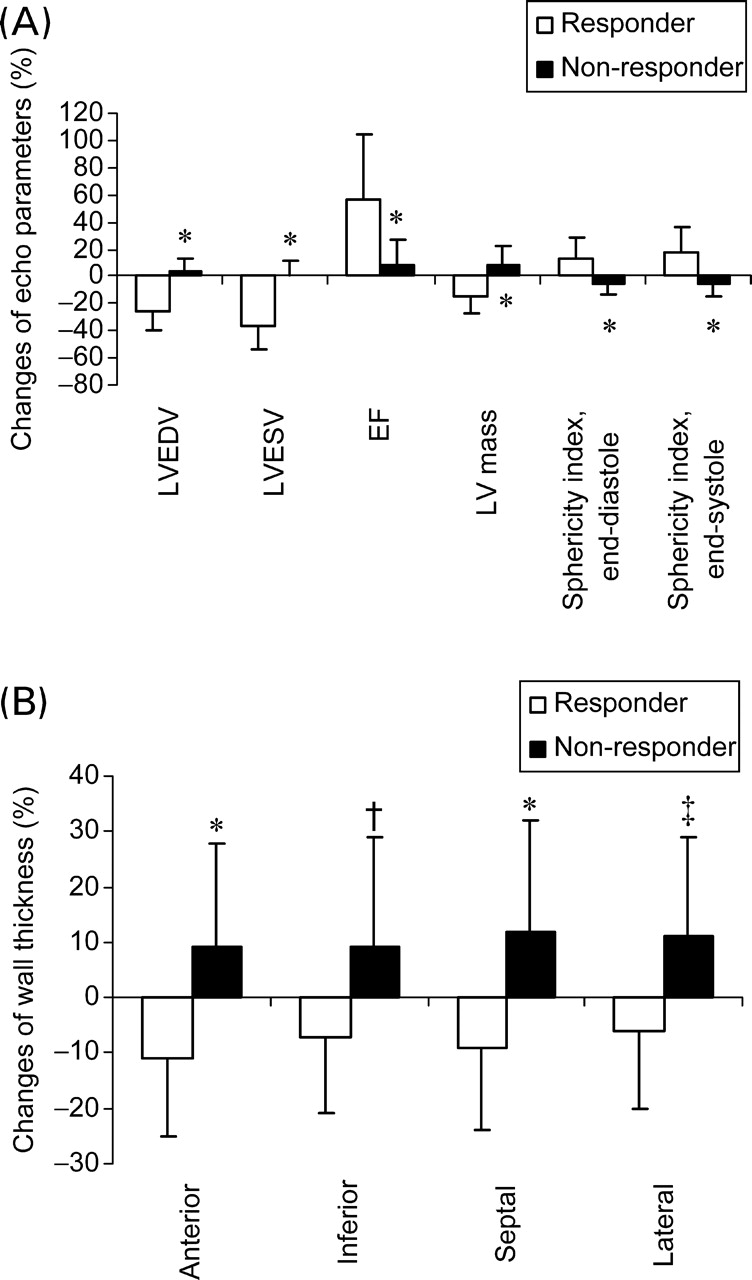
In fact, when the magnitude of changes in LV mass and other echocardiographic parameters were compared, there was a significant difference between responders and non-responders (−15±13 vs. +9±13%, P<0.001). The parameters for LV reverse remodelling were highly different between the two groups, namely LV volumes, EF, and sphericity indices (all P<0.001) (Figure 2A). Similarly, when the percentage change in regional wall thickness was compared, it was observed to change in an opposite manner in all the four regions. Responders had a significant decrease in thickness of all the four walls for −6 to −11%, whereas non-responders had a significant increase for +11% in septal and lateral walls (both P≤0.001 vs. responders), and increase for +9% in anterior (P<0.001 vs. responders) and inferior walls (P=0.002 vs. responders) (Figure 2B).
Changes of parameters of LV reverse remodelling between responders and non-responders in percentage. (A) LVEDV, LVESV, EF, end-diastolic sphericity index, end-systolic sphericity index, LV mass, and *P<0.001 vs. responders; (B) wall thickness in the four sites, namely anterior, inferior, septal, and lateral mid-LV wall, *P<0.001 vs. responders, †P=0.002 vs. responders, ‡P=0.001 vs. responders.
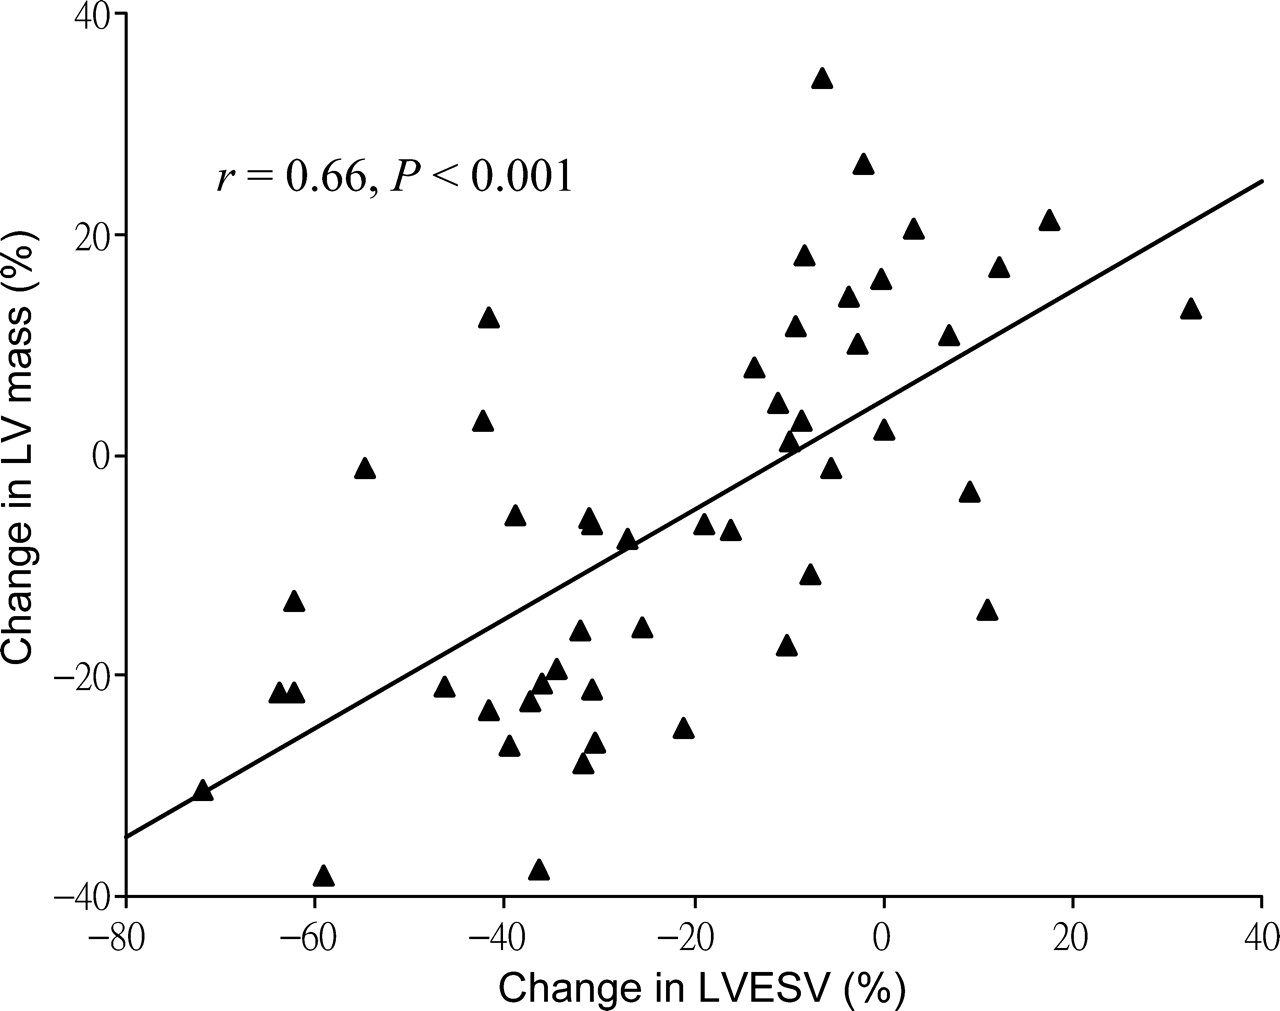
When the degree of LV reverse remodelling and improvement of LV mass and thickness were compared, a close correlation between the change in LVESV and change in LV mass was observed (r=0.66, P<0.001) (Figure 3). For individual wall, the change in septal wall thickness correlated more with the change in LVESV (r=0.45, P=0.001), which was followed by anterior (r=0.35, P=0.010) and lateral (r=0.32, P=0.020) walls, but not the inferior wall (r=0.21, P=0.146).
A scatter plot of the change in LVESV and the change in LV mass at the end of 3 months after CRT.
The percentage change in LV mass, regional wall thickness, and reverse remodelling was attempted to compare between non-ischaemic (n=26) and ischaemic (n=24) patients. However, though the non-ischaemic group appeared to have a better response, none of the parameters showed a significant difference, namely LV mass (−8.4±18.5 vs. −2.9±16.2%, P=0.265), anterior wall (−1.8±18.9 vs. −3.9±18.3%, P=0.696), inferior wall (−2.1±20.2 vs. +1.5±16.9%, P=0.497), septal wall (−5.5±18.1 vs. +4.4±20.0%, P=0.072), and lateral wall (−2.2±18.2 vs. +4.5±17.1%, P=0.181) thickness, LVEDV (−17.5±18.9 vs. −10.5±19.2%, P=0.196), LVESV (−25.2±23.2 vs. −17.7±23.5%, P=0.264), and LVEF (+47.8±54.9 vs. +25.6±30.1%, P=0.087). Moreover, the response rates of reverse remodelling in non-ischaemic and ischaemic patients were similar (57.5 vs. 62.5%, P=0.729).
Relationship between change in systolic asynchrony, regional systolic function, and LV mass
Systolic asynchrony index at baseline was significantly larger in responders than in non-responders of LV reverse remodelling (P<0.001). An improvement of asynchrony index after CRT was observed in the responders (P=0.001) but was further worsened in the non-responders (P=0.020). Similar observation was observed in other parameters of systolic asynchrony, namely Ts-12-diff and Ts-sept-lat (Table 4). There was a significant correlation between the severity of baseline systolic asynchrony and the degree of reduction of LV mass after CRT for 3 months. Such relationship was the strongest for asynchrony index (r=−0.52, P<0.001) (Figure 4), which was followed by Ts-12-diff (r=−0.49, P<0.001), and was the least for Ts-sept-lat (r=−0.34, P=0.020).
A scatter plot of the baseline systolic asynchrony index as measured by the standard deviation of the time to peak myocardial systolic velocity of the 12 LV segments (Ts-SD) and the change in LV mass at the end of 3 months after CRT.
Comparison of LV asynchrony and regional peak myocardial velocity by TDI according to the status of response to CRT
| Parameters | Responders (n=30) | Non-responders (n=20) | ||||
|---|---|---|---|---|---|---|
| Baseline | 3 months | P-value | Baseline | 3 months | P-value | |
| Ts-SD (ms) | 42.5±11.1* | 32.8±14.1 | 0.001 | 26.2±6.9 | 33.4±15.7 | 0.020 |
| Ts-12-diff (ms) | 131±31* | 103±42 | 0.002 | 83±20 | 105±44 | 0.010 |
| Ts-sept-lat (ms) | 53±30* | 39±31 | 0.001 | 21±24 | 34±43 | 0.260 |
| Anterior wall Sm (cm/s) | 3.4±1.3 | 4.0±1.5 | 0.127 | 3.3±1.4 | 3.3±1.8 | 0.982 |
| Inferior wall Sm (cm/s) | 2.7±1.8 | 3.8±1.5† | 0.004 | 2.8±1.4 | 2.7±1.1 | 0.668 |
| Septal wall Sm (cm/s) | 2.6±1.3 | 3.8±1.3‡ | <0.001 | 2.5±1.1 | 2.8±1.4 | 0.555 |
| Lateral wall Sm (cm/s) | 2.8±1.3 | 3.0±1.3 | 0.303 | 3.1±1.9 | 2.5±1.9 | 0.256 |
Ts-SD, the standard deviation of the time to peak systolic velocity in the 12 LV segments; Ts-12-diff, the maximal difference in the time to peak systolic velocity among any two out of the 12 LV segments; Ts-sept-lat, the absolute difference in the time to peak systolic velocity between basal septal and basal lateral segments; Sm, the regional peak myocardial velocity during ejection phase.
*P<0.05 vs. non-responders at baseline.
†P=0.005.
‡P<0.05 vs. non-responders at 3 months after CRT.
Regional peak myocardial systolic velocity (Sm) was also studied by TDI (Table 4). In the responders, the Sm had a significant improvement in the septal (P<0.001) and inferior (P=0.004) walls and a trend but insignificant increase in the anterior and lateral walls. In contrast, the Sm was unchanged in all the four walls in the non-responders.
Discussion
This study provides some new insights about improvement of LV volumes and cardiac function after CRT, which is very different between immediately after device implantation and chronic follow-up. Within 24 h after CRT, there was acute, but a small extent, reduction in LV volume and gain in EF; without changes in LV mass or regional wall thickness. However, there was structural remodelling of the LV and regression of wall thickness upon 3-month follow-up, which was associated with greater magnitude of reduction in LV volume and increase in EF. Of note, the favourable structural and functional reverse remodelling of the LV with regression of global and regional LV mass only occurred in those volumetric responders but was worsened in the non-responders, indicating disease progression.
Evidence of LV structural reverse remodelling with reduction in LV mass
Chronic LV reverse remodelling response after CRT has been observed consistently in previous studies, which is associated with a better prognosis, including a lower mortality as well as fewer heart failure hospitalizations.2,5–9 It is likely combined effects of improvement in intraventricular synchronicity,7 haemodynamics,17,25 atrioventricular synchronicity,26 interventricular synchronicity,7,9 and mitral regurgitation.7,9 A small amplitude of reduction in LV volume and increase in EF was observed within the first 24 h after CRT in an early study,11 as well as in the present study. However, the key information is that the LV mass and regional wall thickness in all the LV sites were unchanged in the acute stage. Therefore, such acute benefit is explained by the haemodynamic effect as a result of pressure and volume unloading through improvement of systolic asynchrony and reduction of mitral regurgitation.7 However, cardiac remodelling is a process that involves structural changes in the LV resulting in cardiac dilatation, progressive loss of cardiac function, and hypertrophy. In order to prove the true benefit of LV reverse remodelling, it has been suggested that a decrease in LV mass has to be demonstrated. The MIRACLE study reported a reduction of LV mass for 12 g in the CRT treatment group at the medium-term, which was significant when compared with an increase for 10 g in the CRT-off group. However, it is not clear whether the 3–4% of reduction itself in the CRT group or the increase in the control group was significant. The current study measured LV mass using a more comprehensive method which showed a highly significant reduction of nearly 8% after CRT in the whole study population. This benefit is present globally throughout the whole LV, as mid-wall thickness in all the four measured regions was significantly reduced. A close correlation was found between the degree of reverse remodelling and reduction in LV mass. Therefore, the decrease in LV mass that occurred over 3 months of treatment is probably due to a decrease in both wall thickness and overall chamber size. This is compatible with the previous observation that the maximal benefits of CRT take time to maximize.7 The occurrence of LV reverse remodelling will further decrease the metabolic demand by lowering the global and regional wall stress.27,28 This will form a positive feedback that favours further regression of LV hypertrophy.
Differential changes in LV mass between responders and non-responders
Despite the consistent benefits of CRT, the lack of reverse remodelling response occurs in more than one-third of patients.17,22 In previous studies, a reduction in LVESV is associated with a more favourable prognosis in multicentre pharmacological trials of heart failure.29–31 The current study adopted a 10% cutoff value of LVESV to signify reverse remodelling, as volumetric responders above this threshold has been shown to predict a better long-term prognosis.5 Interestingly, only responders had a significant decrease in LV mass for a mean amplitude of over 15% and reduction of wall thickness in all the regions which ranged from 7 to 11%. In contrast, non-responders behaved in the opposite direction with increase in LV mass and regional wall thickness. With respect to the aetiology of heart failure, the present study did not demonstrate any difference in the extent of improvement in LV mass or other parameters of reverse remodelling between ischaemic and non-ischaemic patients after CRT.
It is interesting to note that the increased regional wall thickness is particular serious over the septal and lateral walls at baseline in both groups. Furthermore, the worsening of wall thickness was particularly severe over these regions in the non-responders. In studies of electrical mapping for patients with prolonged QRS duration, septal depolarization is always early, whereas the functional conduction block at the anterior or posterior walls will render a delay in the lateral wall region.32,33 Therefore, the hyperactive septal contraction during early systole probably exerts extra stress on the relatively relaxed orthogonal lateral wall. Subsequently, the early relaxed septum will have extra wall stress during late systole and even isovolumic relaxation period when the lateral wall contraction is delayed. As a result, the septal and lateral walls are often subjected to greater wall stress than the anterior and inferior walls and therefore more severe hypertrophy. In fact, improvement of septal wall function was evident by TDI in the responders after abolishment of asynchrony and paradoxical septal motion.
In the present study, a significant correlation was demonstrated between the baseline systolic asynchrony and the reduction of LV mass. As the responders had larger values of asynchrony index than the non-responders and the severity of pre-pacing asynchrony also shown correlated with the reduction of LVESV, it appears that pre-pacing asynchrony is an important determinant of both structural and functional reverse remodelling. As similar to LV mass, systolic asynchrony index was decreased in responders but increased in non-responders. Therefore, CRT reverses systolic asynchrony, which leads to the favourable change in LV wall thickness and LV volume.
Conclusion
The reduction of LV mass and wall thickness are important and objective markers of LV structural reverse remodelling after CRT. Such structural benefit was not present immediately after device implantation but occurred gradually after 3 months, though it was only observed in volumetric responders. On the contrary, increase in LV mass and septal/lateral wall thickness was observed in non-responders. Therefore, this study provides some new insights into LV reverse remodelling, supporting chronic structural regression of LV mass on top of haemodynamic benefit.
Acknowledgement
This study was supported by a research grant from Li Ka Shing Institute of Health Sciences.
Conflict of interest: none declared.

