
Abstract
Exhaled volatile organic compounds (VOCs) have shown promise in diagnosing chronic obstructive pulmonary disease (COPD) but studies have been limited by small sample size and potential confounders. An investigation was conducted in order to establish whether combinations of VOCs could identify COPD patients from age and BMI matched controls. Breath samples were collected from 119 stable COPD patients and 63 healthy controls. The samples were collected with a portable apparatus, and then assayed by gas chromatography and mass spectroscopy. Machine learning approaches were applied to the data and the automatically generated models were assessed using classification accuracy and receiver operating characteristic (ROC) curves. Cross-validation of the combinations correctly predicted the diagnosis in 79% of COPD patients and 64% of controls and an optimum area under the ROC curve of 0.82 was obtained. Comparison of current and ex smokers within the COPD group showed that smoking status was likely to affect the classification; with correct prediction of smoking status in 85% of COPD subjects. When current smokers were omitted from the analysis, prediction of COPD was similar at 78% but correct prediction of controls was increased to 74%. Applying different analytical methods to the largest group of subjects so far, suggests VOC analysis holds promise for diagnosing COPD but smoking status needs to be balanced.
Export citation and abstract BibTeX RIS
1. Introduction
Chronic obstructive pulmonary disease (COPD) is a global health problem and is predicted to become the third leading cause of death worldwide by 2020 [1]. Demonstration of an obstructive pattern by spirometry is currently fundamental to the diagnosis of COPD [2, 3]. Spirometry is a low cost and relatively non-invasive approach but it requires subject effort, and repeated exhalation manoeuvres can be difficult for breathless people. Spirometry also requires trained staff and is affected by factors such as technique, age, height, gender and ethnic origin; its accuracy also decreases in young or very elderly subjects [4]. A lack of local reference values for most of the world's population, disparity between symptoms and lung function and negative screening studies [5] highlight the limitations of spirometry. Furthermore, it is an unscientific means of diagnosis afflicted by confounding factors as it measures lung function and not disease. Developing new biomarkers that are objective, sensitive, specific, non-invasive and yet still low cost is therefore highly desirable. It would greatly improve diagnostic rates for this severe disease and perhaps even allow screening programs of at risk smokers.
Breath analysis is a non-invasive means of studying biochemical processes in the body. Since Pauling's initial description of around 200 volatile organic compounds (VOCs) in exhaled breath over 30 years ago [6], considerable progress has been made in various trapping, detecting and analytical techniques. Improved understanding of biochemical pathways and VOC metabolism such as their relation to oxidative stress has paralleled technological advances. Specific VOC profiles have been reported in many illnesses including heart transplant rejection [7], diabetes [8] and pulmonary conditions, particularly lung cancer [9–12] but also cystic fibrosis [13], tuberculosis [14] and asthma phenotype [15]. Recently, Van Berkel et al proposed a set of six VOCs that could differentiate COPD patients from controls with high sensitivity and specificity [16] and Fens et al suggested exhaled breath profiling discriminates COPD from asthma albeit with some overlap in profiles between COPD and asymptomatic smokers when using an electronic nose [17]. However, these studies are small, have not validated smoking status, and have not balanced the age, body mass index (BMI), fasting state or gender of subjects—all of which may affect VOCs [18–20]. Kishkel et al showed how important these confounders could be when apparent differences of exhalation profiles between lung cancer and non-cancer patients did not persist after these confounding variables were taken into account [21]. The same could be true for COPD.
This study employs a substantially larger set of subjects than previous studies and uses a range of automatic machine learning methods to differentiate patients with COPD from healthy controls. Machine learning is a branch of artificial intelligence, and is concerned with the design and development of algorithms that allow machines to automatically emulate particular behaviour based on empirical data. The data itself is considered to consist of examples that are representative of the relations between the observed attributes. One of the primary research areas in machine learning is that of automatically learning complex patterns and to make intelligent decisions based on the current data. In this paper a number of machine learning methods are used not only to learn from the data (known as classifier learners), but also to select the most informative attributes from the data (known as feature selection (FS)).
2. Methods
2.1. Subjects
Subjects gave written consent and the study was approved by the local ethics committee and registered (ISRCTN 82911859). COPD patients were identified through hospital and primary care registers. All were deemed stable by a respiratory clinician and none reported worsening symptoms within six weeks of testing. All were prescribed optimal medication [2]. Healthy controls comprised spouses of patients, volunteers from local charity organizations and members of staff with no chest pain, breathlessness, cough or wheeze on screening questions.
Anyone who did not respond to a written and telephone invitation, refused consent, with current or previous cancer (except non-melanoma skin cancer), known dementia, heart failure, other known pulmonary, renal or liver disease or pregnancy was excluded. Participants completed questionnaires for socio-demographic data, smoking status and any illnesses including current/recent symptoms then performed dry wedge spirometry (Vitalograph Alpha®,Buckinghamshire, UK). Smoking status was validated using exhaled carbon monoxide (CO) (Bedfont-Micro Smokerlyzer®). An approved research standard [22] was used to define never, ex- and current smokers. Resting peripheral oxygen saturations on air (Konica Minolta Pulsox-300, Konica Minolta Sensing Inc, Osaka, Japan) and BMI were recorded.
The study comprised 119 patients with COPD and 63 healthy controls. COPD was observed in differing severities which are described according to internationally agreed guidelines from the global initiative for chronic obstructive lung disease. This is based on the severity of lung impairment (obstruction FEV1/FVC <0.70) where 'Mild COPD' is defined as GOLD Stage 1 and FEV1 = > 80% predicted, 'Moderate COPD' is defined as GOLD Stage 2 with FEV1 =>50% but <80% predicted, 'Severe COPD' is defined as GOLD Stage 3 with FEV1 = > 30% but <50% predicted, 'Very Severe COPD' is defined as GOLD Stage 4 with FEV1 =<30% predicted. Of the COPD group there were 7 GOLD stage 1, 48 GOLD stage 2, 38 GOLD stage 3 and 22 GOLD stage 4. In addition, four patients had an FEV1/FVC >0.70 but had symptoms of COPD, were on treatments and had emphysema on thoracic HRCT scans. Table 1 describes both groups.
Table 1. COPD and control groups in the study.
| Variable (Mean±SD) | COPD (n = 119) | Controls (n = 63) |
|---|---|---|
| Age (years) | 67.0 ± 8.4 | 67.4 ± 9.7 |
| Male | 61% | 47% |
| Smoking status | ||
| -Never | 0 | 39 |
| - Ex | 78 | 18 |
| -Current | 41 | 6 |
| BMI (kg m−2) | 25.7 ± 4.6 | 27.0 ± 4.4 |
| Predicted% FEV1 | 50 ± 18 | 98 ± 16 |
| Oxygen saturations% | 95.0 ± 2.4 | 95.8 ± 2.3 |
The patient group is typical in age, smoking and demographics of COPD patients attending hospital. The control group is matched, as far as possible, for gender and age and is drawn from the same community (socioeconomic class). COPD is a smoking related illness and there was a clear imbalance of smoking status in between COPD and control groups as finding heavy smokers, of an appropriate age and who did not suffer from COPD or other lung dysfunction is difficult.
Given the imbalance of smoking status between the COPD and control groups, sub-analysis was also performed. The first sub-analysis involved dividing the COPD group into ex smokers and current smokers, so that the indicators of smoking could be compared with apparent indicators of COPD. The second sub-analysis eliminated current smokers from both groups in order to look for indicators of disease without the influence of smoking related VOCs. It was not possible to compare current smoking controls with current smoking COPD patients as there were insufficient numbers of the former to perform reliable analysis.
2.2. Breath sampling procedure
The same clinical room (with closed door and no air conditioning) within the hospital was used for sample collection. However, due to the practicalities of gathering the subjects together, sampling had to be performed on multiple days. After fasting for 4 h, subjects performed spirometry then rested for 20 min within the test room prior to breath collection. Patients were asked to stop short-acting bronchodilators and inhaled corticosteroids for at least 12 h, and any long-acting bronchodilator for 24 h before testing.
Breath samples were collected using a commercially available sampler (Bio-VOC®, Markes International Limited, Llantrisant, UK). This apparatus has been reported in a previous study [10]. Participants took a deep breath and then slowly exhaled through a sampler to their vital capacity until further exhalation was not possible. The sampler consists of a PTFE syringe which holds 129 mL of air with the initial dead-space air displaced by the alveolar air as exhalation proceeds; although there is no data on the breath distribution in these samplers. After full exhalation, a plunger is used to force the breath into a sorbent tube where VOCs are then trapped. Flow rate was not measured but is limited by the resistance offered by the sampler. Three individual samples were taken (i.e. three tubes per patient) with 2 min intervals between each. This allowed more data to be gathered for each subject than the single samples used in most studies. On each of the sampling days, a single air sample was taken in the room prior to testing for monitoring purposes but this was not used in the automatic data analysis. The sorbent tubes (stainless steel (Markes International Limited)) were preconditioned and contained two graphitized carbon black sorbents (Carbograph 1TD and Carbopack X, total sorbent mass of ∼470 mg). An airtight brass cap with a PTFE seal was fitted to the tube ends before storage in lined steel cans for transportation to the laboratory for processing within five days, in batches of typically 20 or more tubes.
Batches of tubes were loaded into an Ultra unit (Markes International, Llantrisant, UK) for automated processing via a Unity thermal desorption unit and fed with inert helium at 10 psi to desorb the tubes in a 30 mL min−1 stream of inert helium at 300 °C for 5 min. To further concentrate, the flow was driven onto a cold trap (U-T11GPC, general purpose graphitized carbon C4/5-C30/32) set at −10 °C. The trap was then desorbed at 300 °C for 3 min. To allow sufficient flow through the trap, 5 mL of the sample is vented and the remainder injected into the GC (Agilent Technologies 6890N gas chromatograph). The VOCs were separated using a capillary column (30 m × 0.25 mm id, HP-5MS film thickness 0.25 µm). The column temperature was initially set at 40 °C and then increased steadily to 200 °C at a rate of 5 °C min−1. Mass spectrometry (Agilent Technologies 5973 network mass selective detector) was used in electronic ionization mode and mass spectral data obtained in the SCAN mode with a mass range m/z 40 –550. Each tube was run twice to prevent carry over of volatiles onto the cold trap in subsequent samples and to check for VOCs inherent in the system.
Automated peak detection and baseline correction was used to calculate peak area (area under the curve) and retention time (RT) for each compound. Using an automated library search function in the Chemstation GC/MS software (Agilent Technologies), VOCs were tentatively identified using the NIST 98 mass spectral library (The National Institute of Standards and Technology) at the apex of each peak and utilizing probability-based matching. RTs were consistent for the vast majority of compounds over the course of the study; for example the standard deviations of RTs in toluene and undecane were 0.03 and 0.04 min, respectively.
Two methods were employed to normalize/scale the data. The first approach used total VOC levels to normalize each sample (i.e. the sum total magnitude of all VOCs in a particular sample—thus expressing each VOC as the proportion of total VOC). Total VOC was calculated for a RT window (1.49–24.5 min) to exclude noisy spectra at low RT and column bleed at high RT. In addition, known system peaks such as siloxanes were also omitted. This approach has been used previously by Van Berkel et al [16, 43] to compensate both for mixing of alveolar and upper airway breath and drifts in sensitivity of the test equipment. However, this study found that total VOC levels were substantially higher in COPD than control subjects (both in terms of the number and abundance of VOCs) so this approach effectively reduces the levels of individual VOCs in COPD, which may influence the ability to learn from the data. Therefore, an additional scaling method was used in which VOC levels were divided by the average area under the curve for benzaldehyde in the entire batch of measurements from which it originated (rather than individual samples). Normalization allowed for compensation to be made for drifts in cold trap and MS performance and removed the need for introducing internal standards into the sample. Benzaldehyde was present in almost all samples, and although it did vary from sample-to-sample, averages for both COPD and controls within a given batch were similar across the series of collections (see figure 1). Benzaldehyde has also been reported in other studies as being one of the most prevalent VOCs in breath [23] with van den Velde et al [24] suggesting that it is due to the environment. In this study, benzaldehyde was detected in over 90% of air samples, and at higher levels than in breath, suggesting an environmental source. Analysis of sorbent tubes injected with controlled amounts of toluene, xylene and dodecane demonstrated that the system gave very similar mass responses for each compound. The RTs of these compounds covered the range of most of the detected compounds.
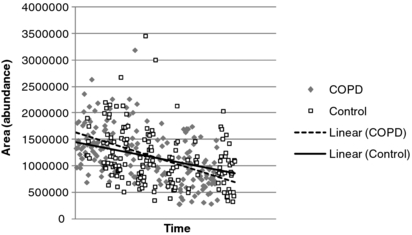
Figure 1. Benzaldehyde levels in breath over time in the different subjects.
Download figure:
Standard image2.3. Data analysis
In the field of machine learning, there are a large range of different techniques for supervised learning [25], each with its own underlying mathematical foundation or metric (for example fuzzy sets [26], support vector machines [27], Bayes, entropy, etc), and each with its own merits and demerits. Some techniques may perform better than others, and depending on the data, one approach may outperform another, however the same may not be true given a different dataset [25]. As such, in order to provide a comprehensive and robust evaluation, a number of approaches have been included for the data analysis. In addition to techniques which have different underlying theories, a number of different approaches to learning such as ensembles [25] (where multiple classifiers are combined) are also included. As well as different learning techniques, an additional step known as feature subset selection is also incorporated. The main aim of FS is to determine a minimal feature subset from a problem domain whilst retaining a suitably high accuracy in representing the original features. The usefulness of a feature subset is determined by both its relevance and redundancy. A feature is said to be relevant if it is predictive of the decision feature(s), otherwise it is irrelevant. A feature is considered to be redundant if it is highly correlated with other features. Hence, the search for a good feature subset involves finding those features that are highly correlated with the decision feature(s), but are not correlated with each other. FS attempts to focus selectively on relevant features, whilst simultaneously attempting to ignore the (possibly misleading) contribution of irrelevant features. It should be noted that the approaches employed in this paper select subsets of features rather than individual features e.g. based on the rank of the individual features.
All detected VOCs from 546 data objects (119 × 3 = 357 for COPD patients, and 63 × 3 = 189 for controls) were examined. The rationale for this investigation was to determine what results could be obtained without any subjective human input such as a tunable threshold, or prior domain knowledge which may affect or optimistically bias the learning process. All of these data objects (individual patients/controls) retain their link to the original patient/control for the purpose of classifier learning such that data objects which are related to the same subject do not appear simultaneously in both training and testing phases.
For analysis of the data, there were two steps involved: firstly, classifier learning based on the full set of VOCs (shown in figure 2) and secondly, classifier learning based on an automatically selected subset of the VOCs using FS (shown in figure 3). It is important to note that the feature subsets obtained using FS were obtained independently of any classifier learning technique, i.e. the learning techniques were not used as a metric for the selection of subsets of features (this can often lead to overfitting). Experiments were carried out using in-house software in partial combination with Weka [28] and some stand-alone software. Weka is an open-source collection of machine learning algorithms for data mining tasks and contains tools for data pre-processing, classification, regression, clustering, association rules, and visualization. It can also be used as a platform to develop new machine learning schemes.

Figure 2. Experimental set-up for learning from the full set of VOCs.
Download figure:
Standard image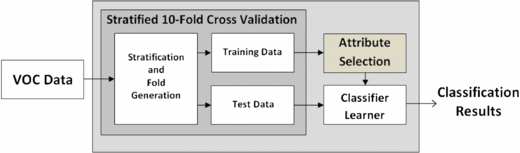
Figure 3. Experimental set-up for learning from the reduced set of VOCs.
Download figure:
Standard imageOverall, 12 different automatic classifier methods were used. These were based on various different techniques and schemes; with eight stand-alone classifiers, and two ensemble techniques (both used with different base classifiers). As mentioned previously, the reasons for including a variety of learning methods is to provide a comprehensive and robust examination of the data. The learning methods comprise: J48 (a version of Quinlan's ID3 decision-tree algorithm) [29], JRIP (a rule-based 'ripper' classifier which generates rules and uses these to classify 'new' objects) [30], PART (another rule-based classifier) [31], SMO (sequential minimal optimization approach for support vector machines) [27], FNN (fuzzy nearest-neighbour classifier) [32], random forest (a tree-based classifier) [33], FRNN (a fuzzy-rough set nearest-neighbour approach) [34] and VQNN (a noise-tolerant fuzzy-rough set-based classifier) [35]. For the ensemble techniques, J48 and VQNN were used as base classifiers, while random subspace [36] and bagging [37] schemes were implemented with a redundancy elimination step.
For testing and validation of the classifier learners, stratified ten times 10-fold cross-validation (10-FCV) is employed. The original dataset is partitioned into ten subsets and of these ten subsets, a single subset is retained as the testing data for the classifier, and the remaining nine subsets are used for training. The cross-validation process is then repeated ten times (the number of folds). This process is then repeated ten times, resulting in 100 runs in total. Note that there are other available training/validation and testing schemes which are equally suited to this task, however they are not implemented for the study in this paper. The stratification of the data prior to its division into folds ensures that each class label (as far as possible) has equal representation in all folds, The process of stratification (in addition to the use of 10-FCV) helps to further alleviate the problems of class-imbalanced data, and thus bias/variance [38]. The 10-FCV validation strategy produces very robust results and good generalizability [38–40] when compared with strategies such as leave-one-out cross-validation, which suffers from the problem of large variance [38]. The large variance is a result of predictions which are generated using almost all of the data (only one object is 'left-out' for each cross-validation), i.e. a small change in data causes a large change in the generated model (over-fitting) [38, 39].
For the FS step, an approach based on fuzzy-rough sets is employed [41]. This approach is a filter-based method, which is entirely data-driven and does not require any subjective thresholding values or have any tunable parameters, nor does it require any prior domain knowledge. A number of search strategies were adopted for the discovery of subsets (i.e. informative VOCs): (1) Greedy hill-climbing—where features are added greedily until a stopping criterion is reached. (2) SAT (propositional satisfiability)—subsets are generated using a SAT solver or constraint satisfaction problem [42]. (3) This approach is a variant of approach 1 above, where a tenfold cross-model-validation is employed for the generation of feature subsets. The intersection of all subsets could then used as the final reduct or subset. It should be noted that features are selected at each round of cross-validation described previously, thus providing a cross-model-validation of the data.
The performance of the various techniques was measured using classification accuracy, area under the receiver operating characteristic curve (AUC) as well as sensitivity (the proportion of correct predictions for COPD subjects) and specificity (the proportion of correct predictions for control subjects).
The approach was repeated for all of the sub-analyses leading to three comparisons:
- (1)COPD versus control for all subjects.
- (2)Current versus ex smokers for COPD subjects.
- (3)COPD versus control with current smokers removed.
3. Results
A total of 2075 individual VOCs were identified in the analysis. The results of the overall and sub-analyses are presented in the following sections.
3.1. Comparison of all COPD and control subjects
In general, higher accuracies were observed when the data was normalized with respect to total VOC than when normalized by using benzaldehyde. Prior to the application of FS, and using total VOC normalization, the most accurate individual classifier for COPD versus control was PART (a rule-based classifier) with an overall classification accuracy of 71.6% (81% of COPD group correctly predicted and 54% correct prediction for control subjects) and an AUC of 0.71. When data was normalized with respect to benzaldehyde, the maximum accuracy and AUC were 71.5% and 0.78, respectively (for Random SubSpace/J48 ensemble). The application of FS tended to result in improved performance when normalizing using total VOC, and overall accuracy increased to 73.8% (79% for COPD and 64% for control) with VQNN as the best individual classifier learner resulting in an AUC of 0.79. A maximum AUC value of 0.82 was achieved with an ensemble employing VQNN with bagging and a redundancy removal step for the reduced data; this gave an accuracy of 73.4% (82% for COPD and 58% for control) at this point. When data was normalized using benzaldehyde, the use of FS tended to result in slightly reduced accuracy for the better performing methods, but increased performance in the poorly performing methods. Maximum accuracy and AUC were 70.5% and 0.76, respectively, using a Bagging/J48 ensemble. Summary data for all the methods, including standard deviations, is provided in the online supplementary material, available from stacks.iop.org/JBR/6/036003/mmedia.
The subset of selected VOCs, automatically generated from the complete dataset following FS is listed in table 2 for data normalized by both total VOC and benzaldehyde. The dataset for which they were selected (total VOC normalized, benzaldehyde normalized, or both), the frequency at which they were detected in COPD and control subjects and their mean abundance over all samples (normalized with respect to both total VOC and batch data for benzaldehyde) together with the standard error are shown. Match quality and RTs are also shown. Most selected VOCs identified had high quality scores. However, butane and carbon dioxide suffered from poor match quality resulting from their low molecular weight but they did have consistent mass fragments and RTs, suggesting that the same compound was being identified each time. In addition spiking a thermal desorption tube with pure butane gave similar mass fragments and RT to the breath data. This approach did not tend to identify compounds that appeared in only a small numbers of subjects; with most compounds present in the majority of both COPD and control groups. The exception was phthalic anhydride which occurred in less than 18% of COPD subjects and only in a single sample in one of the controls. Furthermore, the compounds benzene, hexanal, nonadecane, and toluene all appear in the subsets for each of the three breath samples, when FS is performed on this data in isolation. Different feature subsets were selected, depending on the method of normalization, although both methods gave a core (that were found in all ten cross-model-validations) of common VOCs (Isoprene, Acetic acid, benzaldehyde, benzene, butane, nonadecane and toluene). Normalization of the data using benzaldehyde resulted in smaller feature subsets being selected and did not, for example, result in subsets containing hexanal or phenol.
Table 2. VOCs automatically generated from the complete dataset for COPD versus control.
| Frequency (%) | Mean abundance (% of Total VOC) | Mean abundance (w.r.t. Benzaldehyde) | |||||||
|---|---|---|---|---|---|---|---|---|---|
| Compound | Occurs in | Qual | RT (min) | COPD | Control | COPD | Control | COPD | Control |
| Isoprene | Both | 90 | 1.52 | 94.1 | 95.2 | 24.52(0.60) | 26.38(0.78) | 10.51(0.32) | 8.24(0.31) |
| Acetic acid | Both | 71 | 1.76 | 94.1 | 95.2 | 6.56(0.29) | 8.60(0.57) | 2.72(0.12) | 2.94(0.26) |
| Benzaldehyde | Both | 92 | 7.40 | 100 | 98.4 | 2.52(0.08) | 3.38(0.10) | 1.00(0.03) | 0.99(0.03) |
| Benzene | Both | 90 | 2.17 | 99.2 | 100 | 2.86(0.08) | 3.35(0.13) | 1.18(0.04) | 0.99(0.04) |
| Butanea | Both | 33 | 1.40 | 70.6 | 55.6 | 21.59(0.80) | 21.39(1.05) | 9.44(0.31) | 6.82(0.32) |
| Carbon dioxidea | Both | 4 | 1.20 | 100 | 100 | 6.15(0.34) | 8.22(0.60) | 2.29(0.11) | 2.28(0.17) |
| Hexanal | Total | 55 | 4.01 | 93.3 | 90.5 | 0.66(0.02) | 0.87(0.03) | 0.31(0.02) | 0.29(0.01) |
| Nonadecane | Both | 92 | 31.60 | 82.4 | 95.2 | 2.48(0.11) | 2.92(0.12) | 1.08(0.04) | 0.89(0.04) |
| Phenol | Total | 67 | 8.00 | 67.2 | 57.1 | 0.78(0.04) | 0.80(0.05) | 0.37(0.01) | 0.32(0.01) |
| Phthalic anhydride | Total | 69 | 17.65 | 17.7 | 1.6 | 0.76(0.08) | 0.04(N/A) | 0.32(0.01) | 0.02(N/A) |
| Sulphur dioxide | Both | 77 | 1.36 | 77.3 | 65.1 | 10.45(0.61) | 14.64(1.22) | 4.73(0.20) | 4.82(0.25) |
| Toluene | Both | 80 | 3.26 | 95.8 | 96.8 | 2.13(0.12) | 1.20(0.07) | 0.98(0.07) | 0.42(0.04) |
3.2. Comparison of current versus ex smokers in the COPD group
Classification accuracy was higher when comparing current versus ex smokers in the COPD group than when attempting to classify COPD and control groups. For the unreduced data (without FS), the best accuracy achieved was 87.6% (81% of current smokers correctly predicted and 91% of ex smokers) when using a Random SubSpace/J48 ensemble on the benzaldehyde normalized data. An optimum AUC of 0.94 was achieved using Bagging with J48. These were reduced slightly for total VOC normalized data; where the optimum accuracy and AUC were: 85.3% (80% of current smokers correctly predicted and 91% of ex smokers) and 0.92 when using the random forest classifier. When FS was employed on the total VOC normalized data, there was a slight decrease in overall classification accuracy following FS to 83.7% (82% of current smokers correctly predicted and 87% of ex smokers) with an AUC of 0.90 (both achieved using random forest). There was a more substantial decrease in performance when FS was employed on the benzaldehyde normalized data; with classification accuracy and AUC of 79.9% and 0.83, respectively (achieved using JRIP and Bagging with J48, respectively). Summary data for all the methods, including standard deviations, is provided in the online supplementary material, available from stacks.iop.org/JBR/6/036003/mmedia.
The subset obtained using FS contained the compounds listed in table 3. The subsets of compounds have substantial overlap with those discovered for the COPD versus control experiments (Isoprene, Benzaldehyde, Benzene, Toluene, Acetic Acid, Carbon dioxide, Sulphur dioxide). Only 1-Heptene, and 1,3,5-Cycloheptatriene were not in the COPD versus control FS and the latter has a similar RT to toluene which, together with the poor quality score, suggests that it may have been misidentified. Again, different features were selected, depending on the normalization method employed, though both methods gave a core of common VOCs. The similarity of compounds derived using FS in smoking with those in COPD versus control suggest that the original task of differentiating COPD from healthy controls is influenced by the smoking status of subjects.
Table 3. VOCs automatically generated from the complete dataset for current versus ex smokers in the COPD group.
| Frequency (%) | Mean abundance (% of Total VOC) | Mean abundance (w.r.t. Benzaldehyde) | |||||||
|---|---|---|---|---|---|---|---|---|---|
| Compound | Occurs in | Qual | RT (min) | Current | Ex | Current | Ex | Current | Ex |
| Isoprene | Both | 90 | 1.52 | 97.6 | 92.3 | 24.29(0.91) | 24.64(0.78) | 11.54(0.50) | 9.91(0.40) |
| Acetic acid | Total | 71 | 1.76 | 90.2 | 96.2 | 6.28(0.49) | 6.68(0.36) | 3.19(0.24) | 2.51(0.12) |
| Benzaldehyde | Both | 92 | 7.40 | 100 | 100 | 2.27(0.10) | 2.64(0.11) | 1.00(0.04) | 1.01(0.03) |
| Benzene | Both | 90 | 2.17 | 100 | 98.7 | 3.73(0.17) | 2.42(0.08) | 1.69(0.07) | 0.91(0.03) |
| Carbon dioxidea | Both | 4 | 1.20 | 100 | 100 | 6.09(0.61) | 6.18(0.41) | 2.46(0.19) | 2.20(0.13) |
| Hexanal | Total | 55 | 4.01 | 90.2 | 94.9 | 0.62(0.03) | 0.68(0.02) | 0.35(0.03) | 0.30(0.02) |
| Toluene | Both | 80 | 3.26 | 100 | 93.6 | 3.05(0.17) | 1.56(0.16) | 1.37(0.06) | 0.73(0.10) |
| 1-Heptenea | Total | 32 | 2.37 | 46.3 | 1.3 | 0.80(0.10) | 1.05(N/A) | 0.45(0.02) | 0.18(N/A) |
| Sulphur dioxide | Benz | 77 | 1.36 | 71.1 | 80.3 | 8.72(0.69) | 11.10(0.78) | 4.48(0.41) | 4.81(0.35) |
| 1,3,5-Cycloheptatrienea | Both | 17 | 3.27 | 4.9 | 28.2 | 3.55(0.15) | 0.54(0.04) | 0.20(0.00) | 0.25(0.00) |
3.3. Comparison of COPD and control subjects with current smokers omitted
For the comparison of COPD and control subjects with current smokers omitted, and normalized using total VOC, classification accuracy was improved for all of the models tested when compared to the overall study of all subjects. The best performing technique was an ensemble of Bagging with J48 as the base classifier. This gave a classification accuracy of 74.3% (79% correct classification for COPD and 68% for controls) and an AUC 0.82. When normalizing using benzaldehyde, optimum accuracy and AUC were obtained using the same classifier but reduced to 67.1% and 0.73, respectively. With FS, the same ensemble again gave optimum results and there was an increase in classification accuracy to 76.0% (78% correct classification for COPD and 74% for controls) and an AUC of 0.84. When normalizing using benzaldehyde, optimum accuracy and AUC were obtained using the same classifier but reduced to 68.1% and 0.72, respectively. The results for total VOC normalized data show a slight improvement over those obtained for COPD versus control with all subjects included, particularly in terms of specificity (prediction of controls). However, the amount of data available for learning is smaller which will potentially reduce accuracy. Also, the control group contains subjects who have never smoked; smoking history, like other lifestyle factors is presumed to affect VOCs. Summary data for all the methods, including standard deviations, is once again provided in the online supplementary material, available from stacks.iop.org/JBR/6/036003/mmedia.
The subsets obtained using FS contained the compounds listed in table 4. Isoprene, acetic acid, benzaldehyde, benzene, butane and carbon dioxide were selected for both normalized datasets. However, toluene, which appeared in the selected subsets when analysing smoking and when comparing all COPD and patients, was not selected by the FS method when smokers were omitted. Otherwise, there was much similarity with the compounds in the other parts of the study, indicating that there is a similarity between indicators of smoking status and indicators of disease. Cyclopentanone and ethaethioamide were not accurately identified but had consistent RTs. They also occurred in very few samples and should be regarded with suspicion.
Table 4. VOCs automatically generated from the complete dataset for COPD versus control subjects with current smokers omitted.
| Frequency (%) | Mean abundance (Total VOC) | Mean abundance (Benzaldehyde) | |||||||
|---|---|---|---|---|---|---|---|---|---|
| Compound | Occurs in | Qual | RT (min) | COPD | Control | COPD | Control | COPD | Control |
| Isoprene | Both | 90 | 1.52 | 92.4 | 96.5 | 24.64(0.78) | 26.55 (0.80) | 9.98(0.40) | 8.04(0.30) |
| Acetic acid | Both | 71 | 1.76 | 96.2 | 94.7 | 6.68(0.36) | 8.65(0.61) | 2.51(0.12) | 2.83(0.27) |
| Benzaldehyde | Both | 92 | 7.40 | 100 | 98.2 | 2.64(0.11) | 3.43(0.10) | 1.01(0.03) | 0.99(0.03) |
| Benzene | Both | 90 | 2.17 | 98.7 | 100.0 | 2.42(0.08) | 3.31(0.14) | 0.92(0.03) | 0.91(0.03) |
| Butanea | Both | 33 | 1.40 | 68.4 | 56.1 | 22.51(1.07) | 21.72(1.12) | 9.31(0.41) | 6.68(0.34) |
| Carbon dioxidea | Both | 4 | 1.20 | 100 | 100 | 6.18(0.41) | 8.48(0.65) | 2.19(0.13) | 2.31(0.18) |
| Cyclopentanonea | Total | 13 | 8.57 | 8.9 | 0 | 0.59(0.07) | N/A | 0.25(0.00) | N/A |
| Decanal | Total | 62 | 14.44 | 93.7 | 80.7 | 1.39(0.06) | 1.66(0.09) | 0.70(0.04) | 0.64(0.04) |
| Limonene | Total | 92 | 9.29 | 92.4 | 91.2 | 1.93(0.27) | 1.79(0.16) | 1.14(0.14) | 0.60(0.03) |
| Sulphur dioxide | Total | 77 | 1.36 | 81.0 | 63.2 | 11.10(0.78) | 14.19(1.29) | 4.82(0.26) | 4.47(0.26) |
| Nonadecane | Benz | 92 | 31.60 | 77.8 | 96.5 | 2.38(0.13) | 3.02(0.12) | 0.99(0.05) | 0.92(0.04) |
| Butane, 2-methyla | Benz | 28 | 1.46 | 28.4 | 8.8 | 1.79(0.18) | 2.07(0.58) | 0.77(0.08) | 0.64(0.16) |
| Ethanethioamidea | Total | 27 | 1.67 | 6.3 | 7.0 | 0.58(0.13) | 1.16(0.27) | 0.21(0.01) | 0.38(0.02) |
4. Discussion
The study found that when comparing all subjects, exhaled VOCs could distinguish people in the COPD group from the healthy control group with an overall accuracy of around 74%, predicting 79% of COPD patients and 64% of controls correctly and with an AUC of 0.79. Prediction of controls was improved to 74% when current smokers were omitted from the study. FS generally tended to increase the overall classification accuracy, particularly for those learning methods that performed poorly prior to selection. This is due to the fact that noisy or misleading or redundant features are removed during the FS process, thus leading to more stable models. A large range of machine learning techniques were applied to the data, yielding a range of results, with differing sensitivities and specificities—highlighting the importance of utilizing a range of different methods. This comprehensive study has ensured that the best result could be leveraged from the data and by employing such a wide and varied number of approaches, it is ensured that the results presented are realistic and not simply a result of chance due to any inherent quirk of a particular method. A benefit of the automated methods used in this paper over traditional statistical techniques is that they do not rely on absolute levels of VOCs, the expression of which will be affected by lung function, and can operate on the individual relationships between combinations of VOCs. The level of accuracy does not permit the technique to be used as a diagnostic tool, as it is inferior to spirometry. There is also concern that some of the VOCs have not been clearly identified and that spurious VOCs can contribute towards discrimination. However, the methodology can potentially contribute towards the understanding of the mechanisms behind lung disease and be improved with enhanced VOC sampling and analysis (GC-MS) techniques.
There is very little data available for COPD for direct comparison; the most comparable study is that by Van Berkel et al [16] who report higher classification accuracy. The total number of VOCs identified was higher than reported in this study [16] as both higher sampling volumes and a more accurate Time-of-flight mass spectrometer were employed. The lower breath sample volume, coupled with the relatively low sensitivity of the mass spectrometer used in this study means that some of the very low concentration VOCs may not be detected. Increasing both sample volume and mass spectrometer sensitivity should yield higher classification accuracy as additional VOCs present in lower concentrations can be compared. However, Van Berkel et al [16] did not balance smoking status, age, gender, BMI or fasting state; all of which can act as confounders [21]. In addition there are a number of problems associated with the validation techniques and manual FS approaches by Van Berkel et al [16]. Initial model generation and validation is performed on a dataset which is very small to begin with (79 subjects). Furthermore, in validating the model the authors go a step further by manually selecting features (without any justification) to fit the independent validation test set. Essentially the selection process involved picking those compounds that result in the 'correct' results for the independent test set. Also, the basis used for the initial subset selection (SVM) is the same as that used for classification, so the compounds selected by the FS method will always return an optimal predictive subset. The study by Fens et al [17] used a different sampling methodology (electronic nose) and applied canonical discriminant analysis but gave lower classification accuracy between COPD subjects and controls than this study. Their relatively small number of instances precludes the useful application of machine learning techniques. From a diagnosis point of view, the results of this study are superior to reports of VOC's ability in differentiating lung cancer patients from controls [9–11].
The research illustrates the effect of smoking on VOCs and how this can dominate any variation due to disease state. This highlights the need to balance diseased and healthy groups in terms of smoking status as without this, the analysis may primarily (and inadvertently) be highlighting a smoking imbalance. This is the first study to validate smoking status in all subjects and although COPD patients have statistically lower resting peripheral oxygen saturations, none were deemed clinically hypoxic with mean oxygen levels well within the normal range. Previous studies by Kischkel et al [21] showed smoking status could be readily detected from breath VOC profiles. The VOCs quoted by Kischkel et al included isoprene, benzene, toluene, butane and hexanal, which were also detected in this study. A study by Van Berkel et al [43] also showed that recent exposure to smoking could be distinguished by breath VOCs. However, finding healthy smokers of an appropriate age is difficult, and the groups were not matched for current smoking status. Compounds such as toluene and benzene, may be markers of smoking while not being exclusive to smokers. Also, the general health effects of smoking may also elevate other VOCs such as isoprene. Smoking history is presumed to affect health and therefore VOC profiles, but it is difficult to account for this in studies. Passive smoking, via a spouse for example, is also not accounted for, nor is smoking history.
The strengths of this study, compared with others, include the sample size and the information obtained for the participants. Screening of medical notes and concurrent spirometry was performed by an experienced respiratory clinician and detailed descriptions of participants were obtained. Groups were matched for age which can affect VOCs presumably through oxidative stress [20] and this study is the first to report controls of similar BMI. If VOCs are fat soluble and follow the pharmacokinetics of adsorption, distribution, metabolism and excretion [44] then BMI and even fat free mass may be important. Alkanes and aldehydes are released in oxidative stress [8, 10, 13, 15, 18, 16, 20] and therefore have a biological basis as useful biomarkers of inflammatory processes such as COPD but are also likely to indicate health, age and smoking history. Examples of alkanes and aldehydes found in this study include butane, nonadecane, hexanal and decanal and the majority of the COPD markers quoted by Van Berkel et al were alkanes [16]. Isoprene was also common to both studies and is linked to cholesterol metabolism [45].
Breath analysis as a diagnostic tool remains hampered by critical issues including difficulties in recruiting sufficient numbers of subjects, knowledge regarding potential confounders but also variation in the approaches used by different groups in terms of the methods of breath collection and subsequent analysis. The chemical content of exhaled breath is also dependent on which area of the lung the breath is sampled from. The highest concentration of endogenous VOCs would be expected to be at the alveolar–capillary interface, the deepest part of the lungs and represented by alveolar breath, which is the last part of the exhaled volume. However, gas exchange is affected by blood supply, alveolar membrane thickness and even the ability to take a deep breath. All these can be affected by disease processes and different types and indeed severity of disease can occur in different parts of the lung in the same individual simultaneously. Various methods for collecting primarily alveolar air include re-breathing from- or repeated breaths to inflate inert (e.g. 5 L Tedlar) bags [16, 17], re-breathing circuits [15], devices to channel exhaled air from multiple breaths on to sorbent tubes [9, 46] and exhaled carbon dioxide monitoring to control alveolar air collection [47]. The breath sampler used in this study offers numerous advantages; firstly it is designed so that dead space air is displaced by alveolar air so there should not be mixed air in the sample. Also the equipment is small, portable, easy to use and commercially available and has previously been used in lung disease studies [10]. This technique also reduces the effect of repeated effort on VOCs. However, these factors need to be balanced against the lower volume of alveolar air collected compared with other methods. There is also concern that the air in the sampler may not be purely alveolar in content, as the effort made by the subject and their ability to exhale may affect the displacement of upper airway breath. Normalization by means of total VOC content may alleviate this problem whilst also removing the need for internal standards. Normalization via batches of benzaldehyde, in order to compensate for drifts in sensitivity, generally produced lower classification accuracy. Each of the methods also resulted in the selection of different feature subsets. It is not clear why this occurs, but any manipulation of the data will alter the contribution of a feature or groups of particular features.
Exogenous VOCs in inspired air pose another potential problem contributing to variability in VOC profiles and may erroneously be attributed to disease processes [21]. In addition there may be a contribution from chemicals entering the body prior to entering the test room; from traffic pollution, cleaning and hygiene products, etc. Some of the frequently occurring VOCs are likely to be from an external source, a common example of which is limonene, a ubiquitous chemical found in toothpaste, deodorant and cleaning products. Although the same room was used for all samples, there will have been day-to-day variation in the air due to activities such as cleaning. To resolve the problem of ambient VOCs, some have suggested subtracting background VOCs from breath VOCs and calculating the so-called alveolar gradient [48]. However, this approach assumes subjects reach equilibrium with current environmental air and also does not account for lingering VOCs from recent environments, exposure to chemicals or short-term variations in pharmacokinetics. COPD patients and healthy controls will also differ in the way they take in, store and express ambient VOCs [21]. The choice was made to neglect background environmental VOCs assuming that any effect should, for the most part, generally be evenly distributed between groups and ambient VOCs should be relatively low in pure alveolar air [10, 13, 15, 17, 21, 43].
GC/MS is regarded as the most sensitive detection method [6, 10, 13, 14, 46, 48]. However it is a cumbersome and expensive way of detecting VOCs, requires specialist laboratories and is not transferable unless exactly the same set-up is used. Furthermore it cannot produce real time measurement. Alternative techniques for VOC detection include mobile ion spectrometry [12], electronic noses [17] and calorimetric sensors [49]. As experience grows and the VOCs indicative of disease are better understood, clinical researchers will aim for portable, (bedside) and cheaper, real-time instruments. With different subject selection criteria, breath collection and analytical techniques it is unlikely that researchers will identify identical VOCs. However, repeated discovery of similar groups of compounds (such as alkanes) by separate teams under different conditions suggests they are important.
In summary, this is the largest study to date on VOCs, applying strict inclusion criteria and matching for more confounders. The large dataset permitted the application of more advanced analytical techniques, but smoking status was not matched and the discriminating compounds may therefore be associated with smoking. In order to act as a diagnostic tool, the groups need to be better balanced. There are insufficient numbers of subjects to adequately analyse the effect of smoking within each group, but this could be achieved with further recruitment of subjects. Although there is scope for improvement, VOCs have the potential to act as non-invasive biomarkers to diagnose and perhaps monitor COPD when used with appropriate machine learning tools. With larger numbers of subjects, VOC profiles can be compared for smoking status, by severity of airflow obstruction and during and after exacerbations and can also include patients with co-morbidities.
Acknowledgments
The authors are indebted to the Probus Club of Llanelli who volunteered many members as controls and Professor Paul Harper at the Health Modelling Centre Cymru for introducing clinicians to mathematicians as well as Dr Dai Hickmann, Fran Griffiths, Dr Alan J Williams and Jamie O'Grady for allowing access to their Primary Care COPD registers. Thanks to Dr Ludmila Kuncheva of the School of Computer Science, Bangor University, Dr Juan Rodríguez of the Department of Civil Engineering, University of Burgos, Spain, Dr Paul Lewis and Dr Jonathan Mullins, Institute of Life Science, Swansea University and Roisin Mullins, Faculty of Arts and Social Studies, University of Wales Trinity Saint David for all their efforts in data processing and machine learning that were not included in this paper. Thanks to Dr Masood Yousef (formerly of Swansea University) for initiating the breath VOC project and Dr Davide Deganello (Swansea University) for his help in data processing. Funding was provided by Hywel Dda R&D Unit for consumables and statistical support. Total grants £10 300. There are no competing interests.