
Abstract
Study design:
Cohort of incident cases from 1955 to 2006.
Objectives:
To analyse acute and long-term mortality, estimate life expectancy and identify survival patterns of individuals experiencing traumatic spinal cord injury (SCI).
Setting:
Specialised SCI unit in Australia.
Methods:
Data for patients with traumatic SCI admitted to a spinal unit in Sydney, Australia between January 1955 and June 2006 were collated and deaths confirmed. Cumulative survival probability was estimated using life-table techniques and mortality rates were calculated from the number of deaths and aggregate years of exposure. Standardised mortality ratios (SMRs) were estimated from the ratio of observed to expected number of deaths. Life expectancy was then estimated using adjusted attained age-specific mortality rates.
Results:
From 2014 persons, 88 persons with tetraplegia (8.2%) and 38 persons with paraplegia (4.1%) died within 12 months of injury, most often with complete C1–4 tetraplegia. Among first-year survivors, overall 40-year survival rates were 47 and 62% for persons with tetraplegia and paraplegia, respectively. The most significant increases in mortality were seen in those with tetraplegia and American Spinal Injury Association Impairment Scale (AIS) grades A–C lesions, with SMRs between 5.4 and 9.0 for people ⩽50 years, reducing with advancing attained age. Estimated life expectancies from 25 to 65 years ranged between 69–64%, 74–65%, 88–91% and 97–96% for C1–4 AIS A–C, C5–8 A–C, T1–S5 A–C and all AIS D lesions, respectively.
Conclusion:
Survival related strongly to extent of neurological impairment. Future research should focus on identifying contextual factors, personal or environmental, that may contribute to the reduced life expectancy after SCI.
Introduction
Accurate prediction of life expectancy and identification of factors contributing to increased mortality following spinal cord injury (SCI) is important for lifetime care planning and case management, development of future service models and targeting health promotion and prevention interventions. Over the last 50 years or so, various researchers have studied survival rates after SCI, reporting factors such as gender, age at time of injury, neurological level and degree of impairment, ventilator dependency, aetiology, decade of injury, and interval between injury and estimation of life expectancy as important predictors.1, 2, 3, 4, 5, 6, 7, 8, 9, 10, 11, 12, 13, 14, 15 Data from the Model Systems in the United States (US Model Systems) remains the largest and most influential source of information internationally from which long-term trends in mortality rates and life expectancies have been estimated.16 DeVivo16 has demonstrated continuing trends over the last 30 years towards improvement in acute survival rates, however, without similar reductions in longer-term mortality.
There have been relatively few other studies that have examined long-term survival and trends in standardised mortality ratios (SMRs) in a cohort over many decades. The current authors previously reported on mortality rates and estimates of life expectancy in a cohort of 1453 individuals with SCI admitted to a specialized spinal cord injury unit (SCIU) over a 40-year period.12 However, several studies have reported longer survival analyses in persons with SCI over a 50-year period in Great Britain11 and Norway.15 Frankel et al.11 reported a 71–82% reduction in mortality over time from the first decade (1943–1952) to the last 8 years (1983–1990), with the most noticeable change being in the proportion of surviving individuals with tetraplegia compared with paraplegia. As well as showing elevated risk ratios reducing over time, consistent with findings based on the data from US Model Systems, Frankel et al.11 also showed a change in ranking of the leading cause of death over time, being related to the urinary tract and renal failure in the early decades compared with respiratory system more recently. Using the same sample of 3178 individuals with SCI injured in Britain between 1943 and 1990, Coll et al.17 proposed a new method to achieve a more homogeneous classification of individuals based on standardized mortality risk ratios than the traditional C1–4, C5–8 and paraplegia, Frankel/American Spinal Injury Association Impairment Scale (AIS) grades A–C and D subgroups. Hagen et al.15 did not demonstrate a reduction over five decades in 1-year mortality after SCI, noting survival of an increased proportion of older and more severely injured more recently.
Therefore, the aims of this current study were (1) to analyse the survival experience and acute and long-term mortality patterns of individuals with traumatic SCI admitted to a specialised SCI unit over a 50-year period; (2) to examine data for temporal trends in mortality rates in Australia; and (3) to calculate life expectancies with prediction of future improvements in survival rates.
Materials and methods
Data collection
Ethical approvals were obtained both from the local area health service Human Research Ethics Committee and from the Australian Institute of Health and Welfare Ethics Committee. A review of all patients who had sustained traumatic SCI between January 1955 and the end of June 2006 and admitted to the SCIU at Royal North Shore Hospital in Sydney, Australia was undertaken. In general, the patients were admitted to the SCIU within ⩽24 h of injury. Details were obtained from a card reference data base in the SCIU and from the Medical Records Department.
The data were reconciled against data similar to that used in the previous study. The former data were used as the base data set with the new data being used to add additional records and fill in any missing information.
Due to ethical concerns, telephone calls were not made to seek further information about patient deaths, unlike the previous study.12 The National Death Index (NDI) was instead used to determine if the patient had died since the previous study (that is, after 31 December 1994). After providing a complete database to the NDI, 15 separate files were obtained containing possible matches for these people. Each of these files represents possible matches based on requiring matching of different combinations of data fields. For example, the first file contains records where a match is obtained based on date of birth, names and sex, the second file requires a match on date of birth, names and sex but where allowance is made for the birth data to be recorded in American format, and so forth. Each pair of records that are compared receives a weight that reflects the quality of the match: the higher the weight, the higher the ‘quality’. The data received from the NDI contained 5423 possible matches for the 3372 records sent. The NDI proposed follow-up with a clerical review of data received, to determine which possible matches to accept, and rules of thumb which provide weightings for each data set supplied, by which the NDI suggests a true match is likely. From the likely matches for person-deaths identified using this methodology for the period 1 January 1995 to 30 June 2006, there were no additional deaths to those already known and recorded in the database.
Excluded from the final data analysis were patients with spinal cord concussion or spinal injury who had recovered by discharge to have no permanent motor-sensory impairment (AIS E), patients who have since moved overseas, patients who visited the spinal units at RNSH and Moorong for follow-up visits only, but whose initial injury admission was elsewhere, and people who moved interstate before the end date of the previous study (31 December 1994). Also excluded were those patients where available information was inadequate for the necessary classification. The methodology using data matching with NDI in this current study allowed inclusion of patients who transferred interstate either on discharge from rehabilitation or at some later time post-injury provided they had been in NSW up until the end of the previous study.
The main characteristics of patients included in the analysis were as follows:
-
Unique identifier (name and unit record number)
-
Date of birth
-
Date of injury
-
Date of death (if applicable)
-
Cause of death (if applicable); and
-
Severity of impairment at discharge following rehabilitation, categorised as illustrated in Table 3.
Data for acute survival was analysed at 12 months post-injury, while long-term mortality and life expectancies were calculated using data for those who survived >12 months post-injury to be consistent with most international studies.
Data analysis
The data were analysed by the Consultant Actuary using the following procedures, similar to those used in the previous study:
-
a)
In all cases, periods were measured exactly in days and all fractions of a year contributed to the totals.
-
b)
All deaths and exposure in the study group within 12 months of injury were tabulated to estimate the acute death rate, but were excluded from the longer-term analysis of SMRs and life expectancy.
-
c)
The acute mortality and long-term mortality groups were further subdivided into multiple groupings, being for patients with tetraplegia and paraplegia separately by a range of factors to allow for comparative tabulations. These included:
-
i)
Severity of impairment: all (tetra and para), AIS grades ABC (high and low tetra and para, with AIS grades ABC grouped together) and combined AIS grade D;
-
ii)
Year of injury: In 10-year bands from 1955–1964 up to 1995–2004;
-
iii)
Age at injury: Less than 20 years, 20–29 years, then 10-year bands to age 89, and 90 years and over. Note that with only 369 females in the data set, and 64 female deaths throughout the duration of the study period, we have not attempted to perform separate analysis by gender.
-
i)
-
d)
For each of these major groupings, the number of deaths (dx) and the aggregate years of exposure (Ex) were tabulated across the period of investigation from date of injury until death, withdrawal alive from the analysis, or 30 June 2006 where ‘x’ took the value of:
-
i)
Current attained age in 10 year bands to measure age-specific mortality; or
-
ii)
Duration after injury—for the first 12 months, second 12 months, 3–5 years, and then 5-year groupings to 40 years to measure duration-specific mortality. The mortality rate for each particular group was then estimated as qx=dx/Ex, using the accepted methodology as described in Lilienfeld and Stolley.18 In the case of the duration-specific investigation, a cumulative survival probability was estimated, using the life-table techniques as described in Cutler and Ederer.19
-
i)
-
e)
For each group, an SMR was calculated, being the ratio of (actual number of deaths observed): (number of deaths expected using population mortality). ‘Population mortality’ was from the Australian Life Tables 1995–97 (ALT 95–97), using 80% male and 20% female mortality, in accordance with the approximate spread of exposure to the risk of death and gender distribution of the sample. A 95% confidence limit was calculated for the SMR of each group. In the case of the survival rate analysis, an expected survival rate was estimated by applying ALT 95–97 survival rates to the study sample.
-
f)
For the projected expectation of life at each attained age, the sequence of observed SMRs over the remaining lifetime was studied, and a curve assumed using the observed values and the surrounding confidence limits. This allowed the derivation of a smooth sequence of attained age-specific mortality rates appropriate to the population using the Australian Life Tables 2005–07 (ALT 05–07). These adopted SMRs were then applied to standard mortality tables to calculate the attained age-specific mortality rate for this group. Figure 1 compares the adopted mortality rates for the C1–C4 ABC grouping to the mortality rate of the general population.
Figure 1 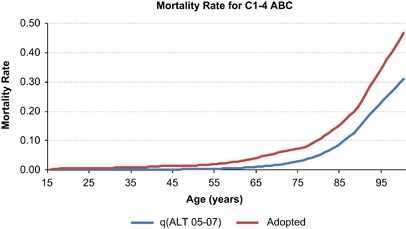
Mortality rate for C1–4 ABC grouping in comparison with the general population.

The expectation of life was then calculated as the sum of cumulative survival probabilities for all future ages and compared with the population expectation of life as shown in Table 1.
The authors were fortunate to have been in personal contact with Professor Michael DeVivo regarding the methodology for estimating life expectancies based on SMRs. As a result of email correspondence, it is concluded that the methodology for conversion of SMRs to life expectancy by age for each group in this study is in agreement with the methodology used by DeVivo et al. However, there is a difference in assumptions regarding SMRs adopted after the attained age of 60 years. While DeVivo et al.’s analysis assumed that SMRs remain constant after age 60, the current analysis has assumed that the SMRs continue to tail off after age 60 years. In these advanced ages, data were insufficient to observe credible SMRs, however, a reducing trend of SMRs were selected to recognise the increasing curve of deaths among the population at these ages, the different mix of cause of death at advanced ages and to recognise standard actuarial practice by the insurance industry in setting annuity rates at advanced ages. In order to demonstrate the effect, this difference in assumptions has on the resulting life expectancy calculations, a scenario is presented where SMRs are kept constant after age 60; this scenario causes the mortality rate to increase at a faster rate after age of 60 years. The impact of this scenario on the mortality curve of the C1–C4 ABC grouping is shown in Figure 2. The paucity of data on persons aged 80 and over with a SCI makes it difficult to prove or disprove either of these options. However, the authors of the current paper are familiar with a number of people aged 90 years and over with these high-level spinal cord injuries, suggesting that the Australian experience does not support a mortality rate of 100% being applied at this age.

Impact of constant SMRs after age 60 years on the mortality rate for C1–4 ABC grouping.
This scenario also decreases the calculated life expectancy of the current study cohort. The impact this assumption would have on the C1–4 ABC grouping is shown in Table 2.
In the analysis presented in the remainder of this paper, adopted SMRs assume reductions from age of 60 years as described above.
Causes of death
The NDI uses the International Classification of Diseases (ICD) to classify causes of death. The ICD encompasses the entire range of disease and injury within chapters that are based on body systems, disease types and external causes of injury. Due to revisions of ICD in the last decade, there are different classifications (ICD-9-CM and ICD-10-AM) in the causes of death data used for this study. In our previous study by Soden et al.,20 causes of death (based on ICD-9-CM) for the study population were grouped into 17 categories. For comparison purposes, the more recent ICD-10 codes were manually matched, where possible, into the 17 categories previously used. In addition, three new categories were created (Infectious and Parasitic, Endocrine and Other), as they did not clinically match the previous 17 categories.
Deaths in people with SCI are often multifactorial and multiple ICD-10 codes have been entered for cause of death. DeVivo and Stover21 have previously defined the underlying cause of death as the cause that initiated the sequence of events that directly led to the person’s death. The underlying cause of death is thus different from the immediate cause of death (for example, cardiorespiratory arrest may be an immediate cause of death whereas pneumonia would be the underlying cause of death). Extrapolating from this, where septicaemia is listed as the cause of death, if information is available with regards to the source, then the source should be the underlying cause of death and septicaemia as the secondary cause of death, unless it is from a pressure ulcer (for which no primary category exists). Bearing these rules in mind, the authors reviewed all the codes in deaths since 1995 together to reach an agreement as to the most likely major factor in the death. The methodology for comparing cause-specific mortality rates for people with SCI compared with the general population was similar to that used to calculate SMR values as described above. Age and cause-specific mortality rates for the general population were obtained from a special data tabulation request of the ABS (Australian Bureau of Statistics) series of Causes of Death publications.
Results
Sample characteristics
From a total of 3372 patients with SCI identified on the data base, 559 patients were excluded from this study because either their injury was non-traumatic in origin or the mechanism of injury was unknown (to be certain that injury was traumatic); 61 were excluded because their injury occurred before 1955 or after 30 June 2006; 505 were excluded because their lesion was unclassified and 49 had no permanent spinal cord deficit (AIS E classification at discharge). A further 184 were excluded because they were attending as an Outpatient only, or had moved Overseas, or Interstate, and hence were lost to follow-up, before 31 December 1994. After these exclusions, 2014 patients remained comprising 1076 persons with tetraplegia and 938 persons with paraplegia.
The mean age (and s.d.) at injury of the study population was 34.0±17.4 years, with a median of 28.3 years (range 0–91 years). The majority of study subjects were male (82%). Motor vehicle accidents were the most common cause of injury among the cohort (53%), followed by falls (19%) and sporting and recreational injuries (18%). In all, 53% of all subjects in the study cohort had tetraplegia, however, with proportionately more people over time surviving with high tetraplegic lesions (for example, the acute death rate for persons with C1–4 AIS A lesions in period between 1995–2006 was 13.5% in comparison to 32.4% for 1975–1984; see Table 4). Other demographic changes over the last 25 years include a greater proportion of new injuries to persons over 65 years of age (12%) and those sustaining incomplete lesions (54%) since 1980, compared with 4 and 37%, respectively, before and including 1980. At the same time, we have seen a significant increase in the proportion of injuries as a result of falls, from 14% before and including 1980 to 24% after 1980, a slight increase in those due to sport and recreation, 16–18%, and offsetting decreases for all other mechanisms of injury.
First-year survival/acute mortality rates
Table 3 shows the distribution of deaths within the study cohort by neurological category.
From the total study cohort of 2014 patients, 88 persons with tetraplegia (8.2%) and 38 persons with paraplegia (4.1%) died within the first 12 months after injury, with the highest death rates occurring in those with complete lesions, particularly in the high tetraplegia (C1–4) subgroup. Table 4 shows temporal trends in acute death rates over five decades between 1955–2006 for persons with tetraplegia and paraplegia, respectively. While the first 4-year bands covers 10 years, for completeness, the last year band covers 11.5 years to 30 June 2006.
While acknowledging that low numbers of admissions and deaths may cause fluctuations in estimates of acute death rates over time, and noting that overall reductions in acute mortality rates are not apparent, there do appear to be trends towards reductions in acute death rates over the last three decades for persons with tetraplegia and AIS A lesions (refer to Table 4). A disproportionately increased mortality rate was also found in the second post-injury year for persons with tetraplegia (2.3% overall), in particular for those with C1–8 AIS A lesions (3.7%) in comparison to C1–8 AIS B/C lesions (2.1%), C1–8 AIS D (0.9%) and all paraplegia (0.9%). This increased mortality risk stabilized thereafter.
Long-term survival
Among first-year survivors, the overall survival rate at 40 years post-injury for persons with tetraplegia is 47% compared with 62% for those with paraplegia. Survival was strongly related to neurological level but also degree of impairment. Figure 3 illustrates age-adjusted survival curves stratified for separate neurological impairment groupings compared with the results of the previous study.12 Note that not all groups have sufficient experience to present valid results beyond 30 years duration.

Rates of survival for persons with different levels and extent of neurological impairment in comparison to the previous study (shown as Tetraplegia (Prev Cervical), Paraplegia (Prev Thoracic)).
The following Figure 4 compares the survival curve for the C1–C4 ABC group to the general population, where the curve for the general population has been age adjusted to be comparable to the age distribution of injuries included in this neurological impairment group, so that the differences in the curves above are driven by the impact of the injuries.

Rates of survival for persons with C1–4 ABC neurological impairment in comparison to age-adjusted general population.
Similarly, in Figures 5, 6, 7, the survival curves for the C5–C8 ABC, T1–S5 ABC and all D groups, respectively, are compared with the general population age adjusted for each neurological impairment grouping.

Rates of survival for persons with C5–8 ABC neurological impairment in comparison to age-adjusted general population.

Rates of survival for persons with T1–S5 ABC neurological impairment in comparison to age-adjusted general population.

Rates of survival for persons with AIS grade D neurological impairment in comparison to age-adjusted general population. Note the worse population survival curve for the AIS Ds is to be expected as the median age at injury for all other groups is between 26 and 27 years of age, compared to a median age of 32 years for the AIS grade D cohort.
Age-specific mortality rates
Results for attained age-specific SMRs shown in Table 5 were used subsequently to estimate long-term extra mortality and project life expectancy for persons experiencing different levels and extents of spinal cord impairment. Analysis of SMRs revealed an increased mortality overall in persons with SCI, generally being greater in persons with tetraplegia (SMR for all ages of 2.2, and 2.9 for aged 20–79 years—with the former number being lowered by the exposure in the over 80s age group for which SMRs are closer to 1) than paraplegia (SMR of 1.7 for all ages, and 1.8 for aged 20–79 years only) and those individuals with the most functional incomplete lesions (AIS grade D). Given the limited exposure in the over 80s age group for both tetraplegia and paraplegia, the 20–79 age grouping represents a reasonable overview of the overall SMR for each neurological impairment group. A consistent trend of reduction in SMR with advancing attained age was evident. For example, SMRs for 20–79 year olds with the highest level of neurological impairment (C1–4 tetraplegia, AIS A–C lesions) were estimated to be 4.5 (95% confidence interval: 3.2–5.9) overall, but range between 5.4 and 9.0 at younger ages (<50 years), reducing to around 4.0 in middle age (50–69 years), 2.0 in 70–79 years age range and 1.1 for ages 80–89 years.
Life expectancy
To estimate life expectancy by age, in the first instance, actuarial modelling techniques were used to derive a smooth curve of SMRs across the life-age spectrum. The SMRs reduced across age groups, blending into a flat extra mortality loading at the oldest ages for each group, where the number of observed deaths was insufficient to determine a specific value. This loading was selected using the observed data to confirm the reducing trend in SMRs at advanced ages. Standard practice among actuaries in loading mortality rates for the underwriting of impaired lives annuities where data are limited was also considered. This methodology is most appropriate in obtaining equity between settlements by liability insurers and the price required of people in purchasing life annuities or structured settlements. Each curve of SMRs was then applied to the most recent general population mortality rates (ALT 05–07) to derive life expectancy by age for each group.
Table 6 shows the amended life expectancy compared with the life expectancy of the general population.
Analysis of the data 10 years post-injury indicate that the increased mortality risk with age for tetraplegia is more related to aging with an injury than getting injured at an older age. In comparison to results reported in our previous study12 (which included persons injured between 1955–1994), exposure in person-years excluding deaths in the first 12 months post-injury for all subjects with AIS grades A–D lesions in the current study (32 698 years) was double. While SMRs were generally similar between the studies, with tighter confidence intervals in all groups, an overall improvement for paraplegia was observed in the current study, which has led to relative improvements in life expectations for all ages in this group.
Causes of death
Categorised causes of death and SMRs for deaths >12 months post-injury and the time period after 1995 following completion of the previous study by Soden et al.20 are shown in Table 7. The leading causes of death in this more recent group of patients with established SCI across all ages were similar to those found previously, being cancer (14.5%), followed by ischaemic heart disease (13.2%), and pneumonia and influenza (12.7%), compared with 12.3, 10.8 and 13.9%, respectively, in previous study.20
Discussion
DeVivo and colleagues13, 16, 21, 22 have shown that while there have been continuing trends over the last 20 years towards improved survival rates in the first year after SCI, unlike the general population similar progress for further reductions in long-term annual mortality rates is not apparent. In fact, after years of progressive improvements, recent data have disturbingly suggested a pattern of slowing or possibly even reversal in the previous trend of diminishing mortality rates and improving life expectancies. On closer examination of the model systems data, however, DeVivo observed that this reversal appeared mostly related to an increased mortality in the second post-injury year and to a lesser extent also in years 3–5 post-injury, whereas mortality rates for 10–20 years post-injury continued to fall slightly. Results of the current study are consistent in general with the findings of these recent studies from the Model Systems in USA demonstrating improved acute survival following SCI, particularly in those more severely injured, presumably reflecting improved pre-hospital retrieval and trauma systems, intensive medical care and rehabilitation management. While a similar pattern of increased mortality persisting into the second post-injury year was observed in the current study, unlike DeVivo et al. we did not observe any trends towards reduction after this period.
SMRs for the current study were also compared with the findings of previous studies by Frankel and his colleagues.11, 17 Using information presented in Frankel et al.,11 we can undertake a detailed exploration of the differences in SMRs by level of lesion and age, including consideration of the confidence intervals of the SMRs. Through personal email correspondence with Professor Michael DeVivo, we also received SMRs based on the previous study by DeVivo and Stover21 recalculated for the level of lesion and injury age groupings presented in Frankel et al.11 These data are presented in Table 8 below.
The second column to the right summarises whether the SMRs calculated using the data in the current paper fall within the confidence limits provided in Frankel et al.11 The experience of the two injury cohorts do not appear to be significantly different for most of the higher impairment grades (and those differences that do exist in the oldest and youngest age bands may be driven by different age distributions within these bands), but the SMRs for the AIS D group are significantly lower in the Australian cohort. Interestingly, these SMRs for the AIS D group are closer to those presented in the data supplied by DeVivo. Some of the differences in SMRs may be attributable to differences in the assumptions and data of the three papers, especially since any differences in the assumed population mortality rates and the ages within each broad age band (for instance, whether the average age of those in the band over 60 years are similar between the papers) cannot be determined from information contained within the Frankel et al. and DeVivo et al. papers or correspondence. These findings, however, do confirm that neurological level and degree of impairment, as well as age, are important prognostic factors to be taken into account when estimating life expectancy. The most significant increases in mortality rates were seen in the group with C1–4 tetraplegia and AIS A–C lesions, with SMRs ranging between 5.4 and 9.0 for the group of people 50 years or younger, and SMRs reducing with advancing current attained age.
Coll et al.17 and more recently Strauss et al.22 have highlighted the importance of distinguishing not only between high and low levels of tetraplegia, but also between complete (AIS grade A) and incomplete (AIS grades B and C) lesions when estimating life expectancy. Results of the current study also support this contention, with relative SMRs ranging between 96 and 144% in comparison to Coll et al.17 for the same impairment groups (shown in Table 9 below). This analysis particularly highlights the substantially worse experience of those with AIS grade A lesions in both the C1–4 and C5–8 groups, compared with the incomplete lesions, and further that the C1–4 group have significantly worse experience than the C5–8 group. In addition, Strauss et al.22 showed that C1–4 incomplete (AIS grades B and C) lesions may also carry a higher mortality risk.
The differences seen in Table 9, suggesting that persons with lower-level tetraplegia and higher-level paraplegia in the Australian cohort have relatively greater risk of death compared with the base reference group than is the case in the United Kingdom, may be explained by dissimilar base reference group SMR experiences in each country (refer to Table 8), as well as different age distributions within groups. Compared with the broad age bands in the Coll et al. paper,17 using information from the Frankel et al.11 paper (which used the same data), persons with higher-level tetraplegia appear younger, the AIS D group are older in general in the current paper and persons with lower-level tetraplegia and persons with higher-level paraplegia are similar in age between the papers.
These various statistics provide a framework within which life expectancy can be considered for each individual. However, care must be taken when applying projections for life expectancy to an individual from grouped data. In applying these estimates of life expectancy, one must be careful not to discount expected improvements in survival of patients who have sustained SCI. In an Australian High Court judgment: Golden Eagle International Trading Pty Ltd v Zhang (2007) HCA 15 (http://www.hcourt.gov.au/media/GoldenEagle_v_Zhang.pdf), the principle of future mortality improvements was accepted and for the purpose of compensation payments, it was determined that life expectancy calculations should use prospective life expectancy tables, not historical tables, both from the ABS. The actual prospective life tables used in this judgment were based on the medium mortality improvement, based on a similar principle to those published later by the ABS in ‘Population Projections Australia 2004–2101’ Cat. No. 3222.0. The application of these prospective life tables would yield, for example, a life expectancy for a person aged 25 with a C1–4ABC level lesion of 45.9 years (compared with 39.8 with no expected mortality improvement), with similar proportionate increases in life expectancy for other groups.
DeVivo and Ivie23 have shown that being ventilator-dependent carries a high risk of acute mortality, as well as a major reduction in life expectancy. Data from the Model Systems in United States demonstrate that around 4–5% of their SCI population still require mechanical ventilation on discharge.16 While few in the current study cohort required permanent ventilator support after discharge, it is likely that some of those persons with high-level tetraplegia, who were only weaned successfully from the ventilator after several months in hospital due to borderline respiratory function, remain at higher risk of premature death due to late respiratory failure.
In our analysis of causes of death after 1995, there was a higher than normal incidence of premature deaths in similar causes to those found in our previous study of deaths before 1995—pneumonia (SMR 17.11) and the urinary system (SMR 6.84). Septicaemia (contained within ‘Other bacterial diseases’ in Table 9 above), a leading cause of death in the previous study, was less so in the current study (SMR 14.53) due to the different mechanism of attributing underlying cause of death. SMRs for suicide and unintentional injuries were also elevated. Again, SMRs were not significantly elevated for causes of death associated with cancer (1.13) and ischaemic heart disease (1.77). This analysis highlights the necessity for regular systems review, with close vigilance to respiratory and urinary health maintenance and psychosocial issues.
Data quality is of utmost importance in a project such as this, thus consideration needs to be made of the fact that in determining actual deaths since the previous study, reliance was placed on data collected in the hospital databases. While the completeness of this methodology were able to be reinforced by matching to the NDI, the standardized mortality rates presented in this paper can be considered to be subject to some further uncertainty due to the method of collection of death records.
Krause et al.24 showed using logistic regression that, after adjusting for demographic characteristics and injury severity, measures of health status, community integration and economic status had small but statistically significant effects on likelihood of death during the next year. These authors along with ourselves12 and others have flagged the need for greater research attention to now be given to contextual factors, either personal or environmental, that may interact with age and impairment to further reduce life expectancy after SCI. In this regard, better understanding is required of the impact of pre-morbid education, health and risk-taking behaviours, pre-existing conditions or co-morbidities, including traumatic brain injury, depression and drug and alcohol use, lifestyle factors including smoking and exercise, as well as psychosocial variables, such as living circumstances, access to care and social support, finances and employment. This information would enable clearer interpretation of cross-sectional group mortality trends and adjustment to an individual taking into account risk-factor profiles, which may be valuable for medico-legal purposes, lifetime care planning, future service development and prevention initiatives. Regular health monitoring and periodic functional review by a multidisciplinary team are recommended as important services for achieving maximum longevity and quality of life after SCI.
Conclusion
It is evident that although there have been improvements in survival and life expectancy over time, most notably in the group with paraplegia in comparison to 10 years ago, mortality rates after SCI remain elevated with life expectancy most significantly reduced in those persons with higher level, more severe impairment. Future improvements will require a greater understanding of and proactive attention to the way in which contextual factors, either personal or environmental, interact with age and impairment to contribute to the reduced life expectancy after SCI.
References
Burke ME, Hicks AF, Rollins M, Kessler H . Survival of patients with injuries to the spinal cord. JAMA 1960; 172: 121–124.
Hackler RHA . 25-year prospective mortality study in the spinal cord injured patient: comparison with the long-term living paraplegic. J Urol 1977; 117: 486–488.
Geisler WO, Jousse AT, Wynne-Jones M, Breithaupt D . Survival in traumatic spinal cord injury. Paraplegia 1983; 21: 364–373.
DeVivo MJ, Stover SL, Black KJ . Prognostic factors for 12-year survival after spinal cord injury. Arch Phys Med Rehabil 1992; 73: 156–162.
Krause J . Survival following spinal cord injury: a fifteen year prospective study. Rehabil Psychol 1991; 36: 89–97.
Whiteneck GG, Charlifue SW, Frankel HL, Fraser MH, Gardner BP, Gerhart KA et alMortality, morbidity, and psychosocial outcomes of persons spinal cord injured more than 20 years ago. Paraplegia 1992; 30: 617–630.
Kiwerski JE . Factors contributing to the increased threat to life following spinal cord injury. Paraplegia 1993; 31: 793–799.
Samsa GP, Patrrick CH, Feusser JR . Long-term survival of veterans with traumatic spinal cord injury. Arch Neurol 1993; 50: 909–914.
Hartkopp PA, Brønnum-Hansen H, Seidenschnur A-M, Biering-Sørensen F . Survival and cause of death after traumatic spinal cord injury: a long-term epidemiological survey from Denmark. Spinal Cord 1997; 35: 76–85.
McColl MA, Walker J, Stirling P, Wilkins R, Corey P . Expectations of life and health among spinal cord injured adults. Spinal Cord 1997; 35: 818–828.
Frankel HL, Coll JR, Charlifue SW, Whiteneck GG, Gardner BP, Jamous MA et alLong-term survival in spinal cord injury: a fifty year investigation. Spinal Cord 1998; 36: 266–274.
Yeo JD, Walsh J, Rutkowski S, Soden R, Craven M, Middleton J . Mortality following spinal cord injury. Spinal Cord 1998; 36: 329–336.
DeVivo MJ, Krause JS, Lammertse DP . Recent trends in mortality and causes of death among persons with spinal cord injury. Arch Phys Med Rehabil 1999; 80: 1411–1419.
O’Connor PJ . Survival after spinal cord injury in Australia. Arch Phys Med Rehabil 2004; 85: 1764–1773.
Hagen ME, Lie SA, Rekand T, Gilhus NE, Gronning M . Mortality after traumatic spinal cord injury: 50 years of follow-up. J Neurol Neurosurg Psychiatry 2010; 81: 368–373.
DeVivo MJ . Trends in spinal cord injury rehabilitation outcomes from model systems in the United States: 1973-2006. Spinal Cord 2007; 45: 713–721.
Coll JR, Frankel HL, Charlifue SW, Whiteneck GG . Evaluating neurological group homogeneity in assessing the mortality risk for people with spinal cord injuries. Spinal Cord 1998; 36: 275–279.
Lilienfeld DE, Stolley PD . Foundations of Epidemiology. Oxford University Press: New York. 1994.
Cutler SJ, Ederer F . Maximum utilisation of the life table method in analyzing survival. J Chron Dis 1958; 8: 699–712.
Soden RJ, Walsh J, Middleton JW, Craven ML, Rutkowski SB, Yeo JD . Causes of death after spinal cord injury. Spinal Cord 2000; 38: 604–610.
DeVivo MJ, Stover SL . Long-term survival and causes of death. In: Stover SL, DeLisa JA, Whiteneck GC (eds). Spinal Cord Injury: Clinical Outcomes from the Model Systems. Aspen Publishers, Inc.: Gaithersburg, MD. 1995 Chapter 14, pp 289–316.
Strauss DJ, DeVivo MJ, Paculdo DR, Shavelle RM . Trends in life expectancy after spinal cord injury. Arch Phys Med Rehabil 2006; 87: 1079–1085.
DeVivo MJ, Ivie CS . Life expectancy of ventilator-dependent persons with spinal cord injuries. Chest 1995; 108: 226–232.
Krause JS, DeVivo MJ, Jackson AB . Health status, community integration, and economic risk factors for mortality after spinal cord injury. Arch Phys Med Rehabil 2004; 85: 1764–1773.
Acknowledgements
We are most grateful to Ros Soden and Obaydullah Marial for assistance with data matching, Laura Hunt and Alan Dam for assistance with data analysis and Professor John Yeo for his continuing encouragement and support of this ongoing work which he started. We also thank Professor Michael DeVivo for sharing data and his expertise to permit comparison of methodologies.
Author information
Authors and Affiliations
Corresponding author
Ethics declarations
Competing interests
The authors declare no conflict of interest.
Rights and permissions
About this article
Cite this article
Middleton, J., Dayton, A., Walsh, J. et al. Life expectancy after spinal cord injury: a 50-year study. Spinal Cord 50, 803–811 (2012). https://doi.org/10.1038/sc.2012.55
Received:
Revised:
Accepted:
Published:
Issue Date:
DOI: https://doi.org/10.1038/sc.2012.55
