Article Text

Abstract
Background Uncertain prediction of outcome in acute respiratory distress syndrome (ARDS) impedes individual patient management and clinical trial design.
Objectives To develop a radiological metric of injurious inflation derived from matched inspiratory and expiratory CT scans, calibrate it in a model of experimental lung injury, and test it in patients with ARDS.
Methods 73 anaesthetised rats (acid aspiration model) were ventilated (protective or non-protective) for up to 4 hours to generate a spectrum of lung injury. CT was performed (inspiratory and expiratory) at baseline each hour, paired inspiratory and expiratory images were superimposed and voxels tracked in sequential scans. In nine patients with ARDS, paired inspiratory and expiratory CT scans from the first intensive care unit week were analysed.
Results In experimental studies, regions of lung with unstable inflation (ie, partial or reversible airspace filling reflecting local strain) were the areas in which subsequent progression of injury was greatest in terms of progressive infiltrates (R=0.77) and impaired compliance (R=0.67, p<0.01). In patients with ARDS, a threshold fraction of tissue with unstable inflation was apparent: >28% in all patients who died and ≤28% in all who survived, whereas segregation of survivors versus non-survivors was not possible based on oxygenation or lung mechanics.
Conclusions A single set of superimposed inspiratory–expiratory CT scans may predict progression of lung injury and outcome in ARDS; if these preliminary results are validated, this could facilitate clinical trial recruitment and individualised care.
- ventilator-induced lung injury\
- acute lung injury
- artificial respiration
- computed tomography
- diagnostic imaging
This is an Open Access article distributed in accordance with the Creative Commons Attribution Non Commercial (CC BY-NC 4.0) license, which permits others to distribute, remix, adapt, build upon this work non-commercially, and license their derivative works on different terms, provided the original work is properly cited and the use is non-commercial. See: http://creativecommons.org/licenses/by-nc/4.0/
Statistics from Altmetric.com
- ventilator-induced lung injury\
- acute lung injury
- artificial respiration
- computed tomography
- diagnostic imaging
Key messages
What is the key question?
Personalised management and selective recruitment to clinical trials is challenging in acute respiratory distress syndrome (ARDS) because conventional parameters do not predict individual responses or outcome; thus, patients are often managed with a simplified and uniform approach.
What is the bottom line?
We used paired inspiratory and expiratory CT images to detect ‘unstable inflation’ in the injured lung, and using quantitative image analysis calibrated this in a well-characterised laboratory model of protective or injurious ventilation; unstable inflation in CT scans from patients in early ARDS was associated with mortality.
Why read on?
These preliminary laboratory and clinical data suggest that early quantitative analysis of paired inspiratory and expiratory CT images may predict progression of lung injury and outcome in ARDS; if validated, this would enhance prognostication and targeted therapy in ARDS.
Introduction
Secondary lung injury initiated by tidal inflation worsens outcome of acute respiratory distress syndrome (ARDS).1 However, because consensus criteria for ARDS select populations of patients with heterogeneous characteristics, predicting the effect of mechanical ventilation on injury trajectory is difficult.2
Diagnosis of ARDS3 is largely based on plain (two-dimensional) chest radiography. A major advance came with the characterisation by CT, of the ventral ‘baby lung’,4 which provided the rationale for use of low tidal volume1 and prone positioning.5 Quantitative study of ARDS using CT has been mostly limited to large regions of lung,6 with limited analysis of inflation at very high resolution.7
An alternative approach to pulmonary CT analysis pairs individual voxels in end-inspiratory (EI, table 1) and end-expiratory (EE) images,8 and images are warped in order to superimpose anatomical structures that may be distorted by respiration or disease progression.9 10 This approach permits detection of hyperinflation (low EI density) and air trapping (low EE density) in emphysematous lungs that is not otherwise detectable.11 We previously reported that the spatial propagation of experimental lung injury was driven by tidal inflation,12 and therefore hypothesised that in early acute lung injury, areas of lung with unstable inflation (detected by superimposed EI and EE CT scans) are ‘at risk’ for injury progression.
List of relevant terms and abbreviations
We first characterised the analysis of paired EI–EE CT scans in laboratory experiments (anaesthetised rats). We then used serial CT scans in rats and confirmed that areas of lung with the greatest differences in paired EI–EE aeration at baseline (potentially representing atelectrauma and local strain) corresponded to the areas of maximum progression of injury. Finally, we used paired EI–EE CT images from a small group (n=9) of patients with ARDS who were studied early in their disease, and found that EI–EE aeration was associated with survival.
Methods
Animal preparation
The experiments were performed on male Sprague-Dawley rats (n=73) following a protocol approved by the local Institutional Animal Care and Use Committee, fully described in our previous work12 and in the online supplementary material 1 (please see also the list of definitions in table 1). Following general anaesthesia and intubation, hydrochloric acid (HCl, pH 1.25) was injected into the trachea, followed by stabilisation for 1 hour and mechanical ventilation for up to 4 hours (or until death). To increase variability of injury progression, animals received ranges of HCl doses (1–4 mL/kg), and were ventilated with one of several options (not randomised) of positive end-expiratory pressure (PEEP, 3–10 cmH2O) and tidal volume (VT, 6–12 mL/kg). In a preliminary analysis, these strategies were aggregated for overall comparison into two groups with higher versus lower propensity to injury progression: one group ventilated non-protective settings and one receiving protective ventilation (table 2). Gas exchange, peak inspiratory pressure (PIP), driving pressure,13 mechanical power of inspiration14 and dynamic compliance (Cdyn) were monitored.
Imaging and physiological characteristics of two subgroups of rats ventilated with protective versus non-protective ventilation after HCl aspiration
Animal imaging
CT scans were acquired every hour at EI and EE, without changing ventilator settings. Image analysis (summarised in figure 1 and described in the online supplementary material 1) identified regions in which injury subsequently progressed. To achieve this, all EI and EE images were superimposed on each other and all voxels were aligned on the first image after HCl (with high anatomical accuracy using a method developed by our group)15 (see online supplementary figures 1 and 2). Lung outlines were semiautomatically separated from surrounding tissue,9 and the image alignment did not distort major anatomic landmarks (online supplementary figure 3), preserved lung density distributions (online supplementary table 1), and accurately reproduced tidal lung deformation (online supplementary figure 4).

General workflow of the methodology used to spatially correlate unstable inflation with later injury progression in rats ventilated after acid aspiration. Step 1: all EI and EE image pairs are superimposed on each other and aligned to the first EI image (time 0) following acid aspiration: EI(0). Then, the outline of the lungs is separated from surrounding non-pulmonary tissue. Because all images are superimposed, each individual voxel (see points A and B as an example) can be tracked in EI/EE image pairs and longitudinally over time. Step 2: plotting EI and EE densities against each other, each pair of EI/EE images generates one PRM: points in the PRM indicate the densities at EI and EE of the corresponding voxels, unmasking unstable inflation; the relative frequency of voxels in the PRM is displayed by the colour scale. Individual voxels A and B are now traceable in the consecutive PRMs: as the density of voxel B increases over time, its position in the PRM changes, while voxel A is more stable. Step 3: tracking all points of each PRM, we identified a high-risk density range (in red) where voxels had the highest probability of further increasing their density between consecutive PRMs, reaching a predefined severe injury range (blue area). Here, time 0 PRM is gridded, showing that point B(0) is located in the high-risk range, while A(0) is not. Step 4: the voxels in the high-risk and severe injury ranges of the PRM are now back-tracked to the corresponding baseline CT image. Step 5: a statistical model is created to predict the distribution of lung CT densities after 4 hours, starting from the density distributions at time 0. EE, end-expiratory; EI, end-inspiratory; PRM, parametric response map.

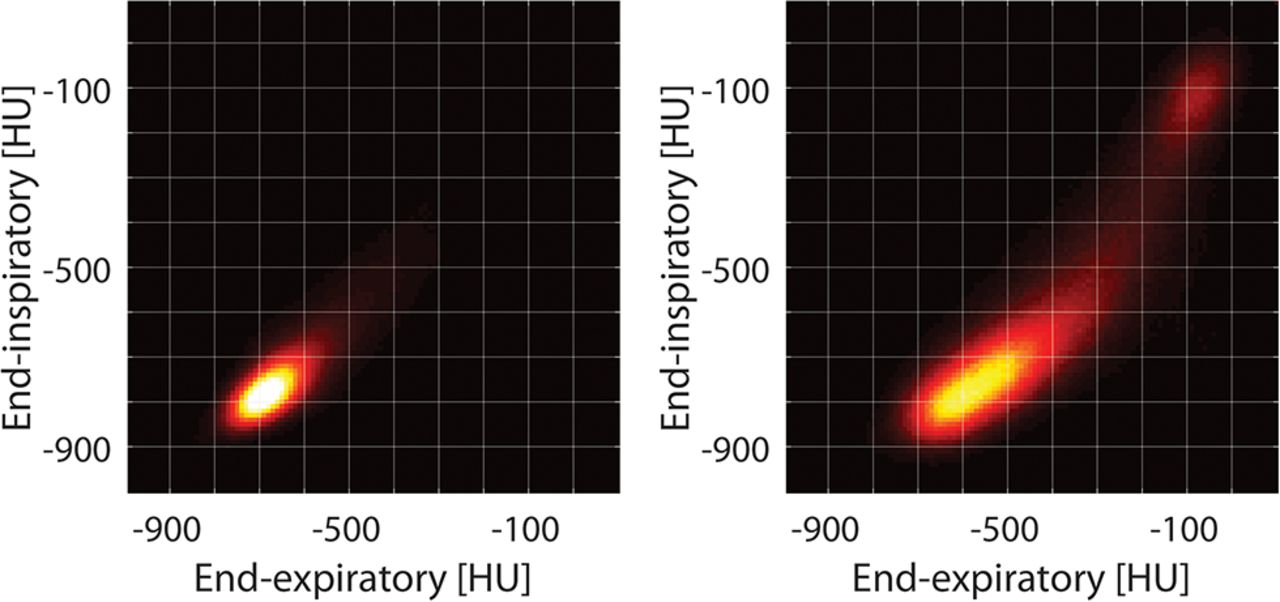
Inspiratory and expiratory density distributions in the parametric response maps of a healthy versus injured rat (imaged early after HCl). The typical behaviour of normal voxels is clearly shown: they are clustered in a region where density is low (<−700 HU) and stable with inflation. In contrast, lungs after HCl display a new region with unstable inflation, with relatively high expiratory density (−100 to −500 HU) and low-intermediate inspiratory density (−500 to −700 HU). The severe injury region (stable density >−300 HU) is visible in the right upper corner.

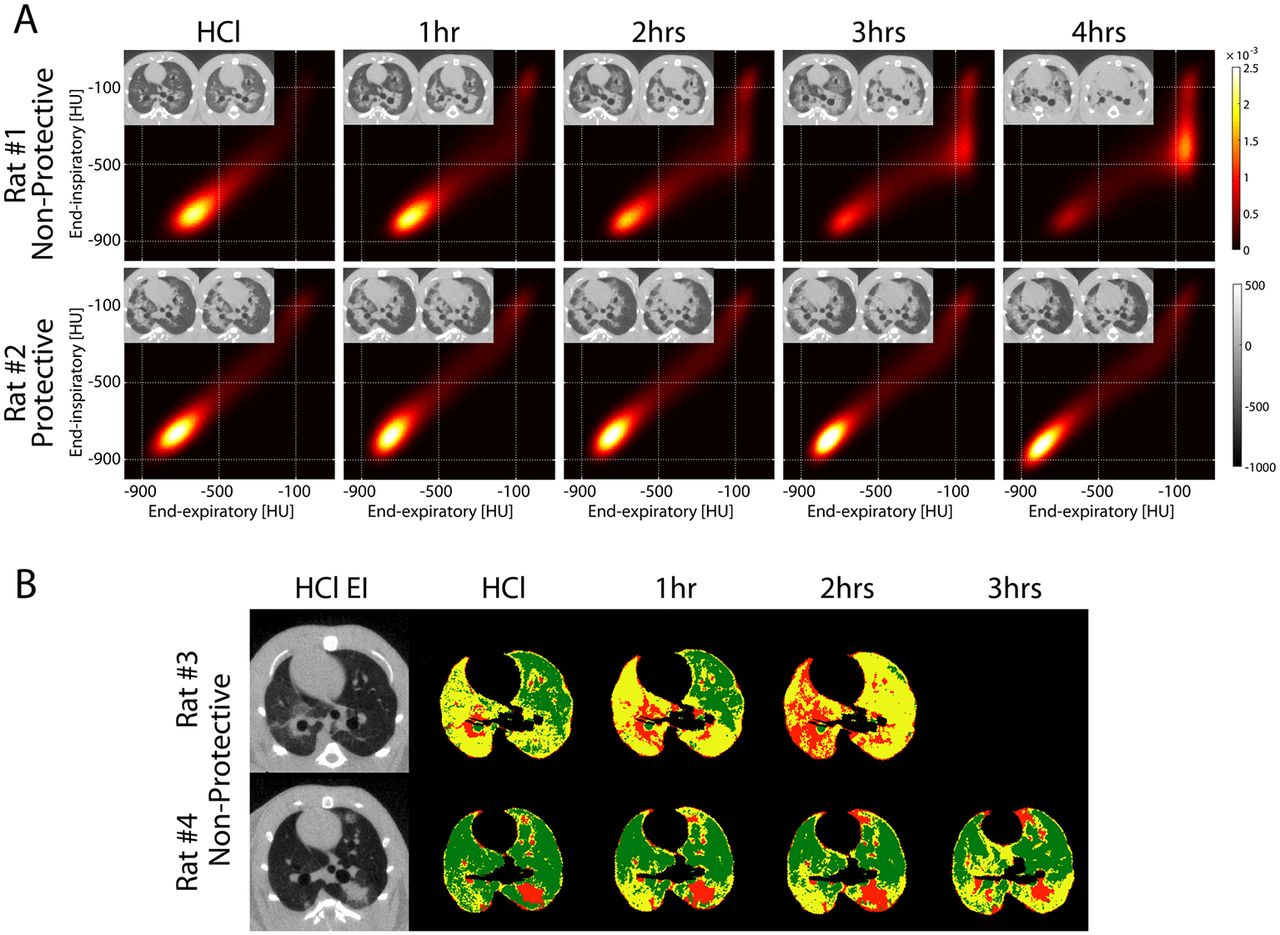
(A) PRM obtained at baseline after HCl aspiration and hourly until the end of the experiment in two rats ventilated with non-protective ventilation (top: VT 12 mL/kg, PEEP 5 cmH2O) versus protective ventilation (bottom: VT 6 mL/kg, PEEP 10 cmH2O). The corresponding EI and warped EE images are shown in the inserts for each PRM and show more severe propagation in the animal with non-protective ventilation versus more contained injury in the rat with protective ventilation settings. In the rat with more propagation (top), the distribution of paired EI and EE density values in the PRM evolved over time, with increased fraction of voxels in the high EI and EE density range (>−300 HU), indicating oedema and/or non-reversible atelectasis (severe injury). In the rat with less propagation, voxel distributions were more stable over time. (B) Voxels that fell in the high-risk (yellow) and in the severe injury (red) domains of the PRMs were plotted in the corresponding EI images for each time point of the experiment in two rats, both ventilated with non-protective ventilation. Areas in green indicate voxels that fell in all remaining areas of the PRM. The inserts show the original baseline (after HCl) EI images. Severely injured regions progressively replaced the regions at risk. The rat with more propagation had a larger fraction of high-risk tissue at baseline and died before the 3-hour time point. EE, end-expiratory; EI, end-inspiratory; HCl, hydrochloric acid; PEEP, positive end-expiratory pressure; PRM, parametric response map; VT, tidal volume.

(A) CT density distributions predicted by the model were compared with the true values measured in the corresponding images. In the second stage of model building, we tested the ability of baseline density distributions to predict the quota of severely injured tissue at the last time point of the experiment. (B) Bland-Altman plot showed minimal bias and acceptable dispersion between predicted and measured values of severely injured tissue the end of the experiment. (C) The percentage of high-risk voxels at baseline (after acid aspiration) predicted the change in compliance during the remaining duration of the experiment. Red circles: non-protective ventilation group; blue circles: protective ventilation.
Parametric response mapping
Lung inflation was analysed in parametric response maps (PRM)11 created by plotting EI and EE densities of all paired CT voxels against each other on a bi-dimensional matrix with range between −1000 and 100 Hounsfield units (HU) (figure 1). The position of each point in the PRM describes EI and EE aeration of the corresponding voxel, showing normal versus abnormal inflation patterns.11 Examples of PRM in healthy versus injured rats are shown in figure 2. The left lower region with low EI and EE density (<−500 HU) indicates stable normal aeration.6 Voxels in the top right corner, where both EI and EE densities are >−300 HU, indicate permanent decrease of aeration and more severe inflammation12; these were categorised as ‘severe injury’.
Risk quantification
After superimposing all sequential images, evolving density of individual voxels was tracked over time. Injury progression was a binary outcome and was defined by an increase of both EI and EE densities to above the −300 HU cut point (‘severe injury’) in subsequent images (figure 1). In the earlier images, voxels with higher probability of later progression were considered ‘high risk’. We measured such probability by analysing range-wise receiver operating characteristic (ROC)16 between consecutive PRMs: values of sensitivity and specificity for observed progression were calculated for voxels of each bin (online supplementary figure 5). Using multivariate linear regression in a two-stage approach (see online Supplementary material), we created a statistical model to predict the future distribution of lung CT densities and the worsening of Cdyn, starting from the percentage of voxels which, in earlier images, fell into the high-risk and the ‘severe injury’ density ranges.

PRM maps on nine patients with ARDS imaged within 7 days from injury. The three patients who died in ICU or within 28 days from onset are shown on top. Voxels in the high-risk (yellow), severely injured (red) and normal density (green) domains are plotted in the corresponding images. Individual amounts of severely injured (I) and high-risk (R) tissue are shown for each patient as percent of total parenchyma. ARDS, acute respiratory distress syndrome; ICU, intensive care unit; PRM, parametric response map.
Human imaging
We used EI and EE CT images from patients who were included in a previously published study.17 Image acquisition and patient characteristics are described in the online supplementary material and in table 3. Of 13 patients in the study, we included a priori the nine subjects with early ARDS, that is, who were imaged within 7 days following intubation. EI and EE images were aligned as for the animal scans and, after confirming stability of anatomical landmarks (online supplementary figure 6), were analysed with PRM. CT densitometry was also used as described in the original publication.17

Scatter plots of individual values (with mean and SD) of high-risk and severely injured tissues, PEEP, PaO2/FiO2, inspiratory driving pressure and compliance (all measured at the time of CT scan). PaO2/FiO2, ratio of partial pressure arterial oxygen and fraction of inspired oxygen; PEEP, positive end-expiratory pressure.
Clinical characteristics of the nine patients included in the study
Statistical analysis
The studies were not randomised and no a priori sample size calculation was made. The primary outcome of the analysis was the increase of the fraction of ‘severe injury’ voxels observed during mechanical ventilation. Comparisons between measured and predicted variables were performed using linear regression and Bland-Altman plots.18 Analysis of variance with Bonferroni correction was used for comparisons between rats ventilated with protective versus non-protective ventilation and to compare image landmarks. Image analysis was performed using Matlab R2013a software (Mathworks) applications developed in the authors’ laboratory; statistical analysis was performed using ‘R’ (R Foundation for Statistical Computing, Vienna, Austria, http://www.R-project.org). An α value of 0.05 was used. All data are expressed as mean±SD.
Results
Experimental data—identification of ‘at-risk’ tissue
Concentric propagation of radiological opacities developed from the sites of initial injury; this was apparent from serial CT images and from the PRM (figure 3A). In the PRM, the distribution of paired EI and EE density values evolved, with more voxels developing in the severe injury domain. In contrast, where injury progression was limited, the voxel distribution was more stable (figure 3A).
Identification of high-risk voxels (online supplementary figure 5) was through capture at EE of voxels of higher density (0 to −600 HU) that were closer to normal at EI (−300 to −700 HU); this was assumed to represent lung tissue with unstable inflation. Such high-risk voxels comprised 33.6%±21.0% of all lung voxels in experimental animals (averaged across all animals) and 4.7%±1.0% in healthy animals (online supplementary table 2). Voxels were backtracked to the original EI images and colour labelled to visualise their distribution. The high-risk voxels (figure 3B, yellow) were predominantly distributed in areas surrounding foci of severe injury (figure 3B, red), and propagation was characterised by progressive replacement of ‘at-risk’ tissue with frank injury.
Experimental data—calibration of injury prediction
There was substantial progression of injury (and high mortality) in rats ventilated with non-protective settings (table 2). In contrast, all animals ventilated with protective ventilator settings (higher PEEP, lower VT) survived for at least 3 hours and demonstrated stability in voxel distribution (figure 3A) and had minimal deterioration in respiratory mechanics or gas exchange (table 2).
In the first stage of model building, each image was used to correlate high-risk and severely injured voxels with the voxel distribution at the subsequent time points (ie, at 1-hour intervals; online supplementary figure 7). This model was then used to predict the quotas of severe injury voxels at the end of the experiment, starting from baseline values (R=0.77, p<0.01; figure 4A, B). Finally, the baseline percent of ‘high-risk’ tissue predicted the degree of reduction in Cdyn (figure 4C) and the increase in driving pressure between the beginning and the end of the experiment (see online supplementary figure 8).
Human data
Parametric response maps of human subjects are shown (figure 5). In the three non-survivors, voxel distribution was skewed towards intermediate density. By contrast, in the six survivors, there was higher representation of low-density regions. ‘High-risk’ and ‘severe injury’ voxels in patient images were identified by applying the density domains from the experimental images. The spatial distribution of high-risk voxels is shown (figure 5), and the non-warped EI and EE images are shown also (online supplementary figure 9).
Scatter plots demonstrate that the fraction of ‘severe injury’ voxels was similar in survivors and non-survivors, but the ‘high-risk’ voxels were more abundant in non-survivors (figure 6). High-risk voxels occupied >28% of the total number of segmented voxels in all non-survivors compared with ≤28% of the total in all survivors. In contrast, standard parameters including oxygenation, respiratory mechanics (figure 6), severity of illness score (SAPS II) (table 3), tidal recruitment, lung weight and gas volume (obtained by CT density analysis) (online supplementary table 3) overlapped between survivors versus non-survivors.
Discussion
These data suggest that a novel analysis of CT images may identify lung tissue at risk of further damage in experimental injury and might potentially predict outcome in patients with ARDS. Superimposing EI and EE images across the whole lung11 identified areas of unstable inflation that appear to represent lung at increased risk of local strain (possibly atelectrauma) when ventilator settings are injurious; such areas are foci for the propagation of lung injury. This three-dimensional approach covers the whole lung, and because it involves voxel-wise assessment, it provides very high resolution (eg, 1 mm3 in humans). These features are in contrast to conventional plain radiography (two-dimensional)3 and standard CT (three-dimensional), which are used to generate single inflation images and with focus restricted to large lung regions.
Parameters for identifying severity of ARDS include oxygenation (PaO2/FiO2 ratio),3 plain chest radiography, compliance19 and ‘driving pressure’ (the difference between plateau and EE pressure).13 The presence of unstable inflation may quantify risk of regional disease progression in experimental injury; and the current patient data suggest that it may potentially also predict outcome in ARDS. In animals, unstable inflation accurately mirrored the topographic/spatial development of secondary lung injury (figure 4); and in the retrospective patient series, a larger proportion (high-risk fraction >28%) of high-risk tissue at baseline was associated with mortality in ARDS (figure 6).
Beyond higher resolution, the imaging approach implemented here offers important potential advantages over previous CT approaches. In experimental injury, we used repeat CT to identify the imaging characteristics that mirror the trajectory of lung injury; this was enabled by image alignment,9 15 which allowed tracking of individual voxels as sequential, superimposed EI–EE images over time. We thereby co-localised baseline unstable inflation with subsequent injury progression. This approach to scanning differs from a recently introduced method correlating ARDS survival with inflation heterogeneity in static CT images, but without EI–EE analysis.7 Others have found correlations between CT imaging and ARDS outcomes, measuring the quota of tissue with recruitable atelectasis,6 percent diseased lung20 and evidence suggesting early fibroproliferative changes.21 However, our methodology is unique in that it builds outcome prediction on the quantitative correlation between imaging and later injury progression, this allowed us to detect ‘high-risk’ tissue in areas of the lung with unstable inflation versus other states of aeration. Furthermore, this approach may unmask subtle inflation patterns that would not be noticed on conventional CT images (online supplementary figure 9).
Experimental variability was important in order to generate a range of injury severity and outcome, permitting calibration of the imaging. We modified a previous approach12 in which moderate VT and low PEEP resulted in severe injury in about 50% of experiments, by using a spectrum of doses of HCl (aspiration) in the setting of protective or non-protective ventilation. In addition, our imaging approach in this design allowed investigation of the relationship among a spectrum of inflation abnormalities and subsequent development of injury. Finally, average (whole-lung) measures of lung density or tidal recruitment were not associated with outcome in a similar experimental model12 or in the patients in this study (online supplementary table 3).
The combination of reduced gas content and of locally unstable inflation was closely associated with progression of experimental injury. This unstable inflation partially overlaps—but does not coincide—with tidal recruitment of atelectasis and elevated local strain. There are multiple mechanisms that can explain why this is closely associated with disease progression. First, voxels with unstable inflation may reflect the presence of reversible atelectasis, possibly atelectrauma.22 Second, the high-risk regions contained voxels with intermediate gas content, mixed aeration that represents pathological alveolar inflation,23 airspace flooding by oedema24 and sparse microscopic atelectasis. Third, in areas where ventilated, collapsed and/or flooded airspaces coexist, CT yields an averaged greyscale7 and cannot resolve a ‘single’ inflation state. Moreover, alveolar interdependence results in focal augmentation of stretch,25 a concept supported by studies using in vivo MRI with inhaled hyperpolarised gas.23 Finally, flooding potentiates ventilator-induced injury26 and studies in humans7 and animals27 indicate that voxels with heterogeneous inflation are clustered among regions of fixed airspace filling and aerated lung. In summary, areas of unstable inflation concentrate local lung stress and potentiate topographic propagation of ventilator-induced injury.12
Lung micromechanics can be directly assessed using techniques such as intravital microscopy,28 optical coherence tomography29 and real-time fluorescence microscopy.26 However, these approaches do not permit whole-lung (or patient) assessment. While MRI provides more accurate functional information,23 30 CT is more accessible and easier to use. Furthermore, ARDS is clinically under-recognised and undertreated31 and further refinement of conventional criteria (ie, plain radiography and oxygenation) is not likely to provide substantial improvement. However, the detection of high-risk tissue with unstable inflation using CT might, if validated, offer additional future options in properly screened patients.32 For example, image analysis could help identify subjects at high risk of deterioration, perhaps where unstable inflation is not reversible by ventilator adjustment. In such a setting, this information could inform treatment decisions, especially where costly or high-risk management (eg, extracorporeal therapy)33 is being considered. In addition, the information could be used to enrich clinical trials of interventions in ARDS, perhaps ensuring that only patients with a high (but not overwhelming) probability of poor outcome are recruited.2 34 In the future, measurement of high-risk tissue might enable determination of choices of (or responses to) specific therapies such as open lung ventilation, neuromuscular blockade35 or prone positioning.5
There are important limitations. The current results are preliminary, and translation is limited by interspecies anatomical differences.36 Furthermore, the human data are retrospective with a small sample size; thus, prospective human studies will be required to better calibrate the methodology for human microanatomy and to verify the prognostic value. Because our images were static, we likely underdetected viscoelastic and recruitment behaviours that affect dynamic inflation.37 The study design was intended to correlate baseline imaging characteristics with variable injury progression using an observational design similar to that used in our previous study.12 Rats received different ventilator settings without randomisation, because our aim was to induce variability in injury trajectory rather than to test treatment strategies. We could not separate the effects of baseline injury severity from those of ventilator management because both PEEP and VT each affect CT images, and these were not standardised during imaging. We chose this design because colocalisation with future injury requires that inflation is measured with ventilation settings identical to those being employed; future studies will address the predictive independence of high-risk inflation. The experimental model, acid aspiration, involves direct epithelial injury38 and intratracheal injection, which could explain the centrifugal injury propagation.12 The study is also limited by the short duration of the experiments and by the fact that injury progression was assessed through deterioration of imaging, Cdyn and oxygenation, but lung inflammation was not directly measured. However, histology confirmed disseminated injury in rats with severe radiological and functional worsening, in our previous rat study following a similar injury protocol.12 Furthermore, deterioration of lung compliance indicates the onset of ventilator-induced injury.39
The correlation between high-risk inflation and mortality in the patients could be related to the ‘pulmonary’38 source of ARDS in seven of nine subjects (table 3) and may be different in other patterns of injury (eg, sepsis), where bacterial spreading, endothelial damage38 or systemic inflammation may affect propagation. We selected patients who were imaged once within a week of endotracheal intubation, aiming to study early ARDS,40 in whom ventilator settings were not standardised during or after imaging; thus, the impact on unstable inflation of a shorter (or longer) duration and the effects of ventilator management after imaging are unknown. Finally, extrapulmonary factors may explain patient mortality, although this seems unlikely given the similarity of the severity of illness scores between survivors and non-survivors (table 3).
The characterisation of lung injury as ‘severe’ using a threshold of −300 HU is arbitrary; indeed, other studies chose different thresholds (eg, −100 HU) to indicate fixed loss of aeration due to oedema and/or non-recruitable atelectasis.6 However, we chose an empiric approach in animals, aiming to indicate locally worse disease in the context of relatively mild early injury.12 In addition, the methodology relies on the accuracy of image alignment, which is problematic in ARDS due to significant tidal deformation.9 Image warping may distort the lungs and lead to overestimation of a density range at the expense of another. Misaligning the border between inflated and non-inflated regions can thereby introduce bias increasing the prominence of unstable inflation. However, our measurements of percent aeration distribution were virtually identical in warped and non-warped images (online supplementary table 1), and this suggests limited bias. Furthermore, the image warping technique seems adequate to maintain positions of major airway landmarks in animals and humans (online supplementary figures 3 and 6) and to generate realistic displacement maps (online supplementary figure 4); nonetheless, validation is required to further develop our methodology.
In conclusion, we have developed a method that topographically links unstable inflation, regional trajectory of lung injury and outcome. If validated by others as an independent predictor in larger populations, a single set of paired EI–EE CT images in early ARDS may predict outcome and responses to mechanical ventilation, may enable enrichment of clinical trials and may facilitate personalised care.
References
Footnotes
Contributors MC and YX share lead authorship role in this work. MC, YX, HH, SK, JCG, BPK and RRR: study conception and design; MC, YX, GB, LG and NM: acquisition of data; MC, YX, HH, SK, JR, NT, JG, BPK and RRR: analysis and interpretation of data; MC, YX, HH, SK, JR, JC and BPK: drafting of manuscript; MC, YX, GB, HH, SK, JC, BPK and RRR: critical revision.
Funding This work was supported by NIH (Bethesda, Maryland, USA) grants R01$HL116342 and R01$HL124986. Maurizio Cereda was supported by a grant from the Foundation for Anesthesia Education and Research (Schaumburg, Illinois, USA) and from the Society of Critical Care Anesthesiologists (Park Ridge, Illinois, USA), and by the Transdisciplinary Awards Program in Translational Medicine and Therapeutics (Philadelphia, Pennsylvania, USA). Brian P. Kavanagh is supported by operating funds from the CIHR (Ottawa, Ontario, Canada) and holds the Dr. Geoffrey Barker Chair in Critical Care Medicine.
Competing interests None declared.
Ethics approval Ethical committee of University of Milan-Bicocca.
Provenance and peer review Not commissioned; externally peer reviewed.
Linked Articles
- Airwaves