Article Text

Abstract
129Xe MRI red blood cell to alveolar tissue plasma ratio (RBC:TP) abnormalities have been observed in ever-hospitalised and never-hospitalised people with postacute COVID-19 syndrome (PACS). But, it is not known if such abnormalities resolve when symptoms and quality-of-life scores improve. We evaluated 21 participants with PACS, 7±4 months (baseline) and 14±4 months (follow-up) postinfection. Significantly improved diffusing capacity of the lung for carbon monoxide (DLCO, Δ=14%pred ;95%CI 7 to 21, p<0.001), postexertional dyspnoea (Δ=−0.7; 95%CI=−0.2 to –1.2, p=0.019), St George’s Respiratory Questionnaire-score (SGRQ Δ=−6; 95% CI=−1 to –11, p=0.044) but not RBC:TP (Δ=0.03; 95% CI=0.01 to 0.05, p=0.051) were observed at 14 months. DLCO correlated with RBC:TP (r=0.60, 95% CI=0.22 to 0.82, p=0.004) at 7 months. While DLCO and SGRQ measurements improved, these values did not normalise 14 months post-infection. ClinicalTrials.gov NCT04584671.
- COVID-19
- Imaging/CT MRI etc
This is an open access article distributed in accordance with the Creative Commons Attribution Non Commercial (CC BY-NC 4.0) license, which permits others to distribute, remix, adapt, build upon this work non-commercially, and license their derivative works on different terms, provided the original work is properly cited, appropriate credit is given, any changes made indicated, and the use is non-commercial. See: http://creativecommons.org/licenses/by-nc/4.0/.
Statistics from Altmetric.com
Introduction
In patients with postacute COVID-19 syndrome (PACS), fatigue, chest pain, brain fog and dyspnoea are common and contribute to poor quality of life (QoL).1 2 Recent studies showed that 7%–30%1 3 of people with PACS remain symptomatic 1–6 months postinfection. Unfortunately, the underlying mechanisms and pathologies responsible for PACS are not well understood.
Chest CT measurements of abnormal pulmonary vascular blood distribution4 and fibrosis5 have been reported in patients following recovery from COVID-19 infection. Hyperpolarised 129Xe MRI has also revealed alveolar gas-transfer abnormalities in PACS,6 7 7 including in never-hospitalised people up to 41 weeks postinfection.8 However, longitudinal 129Xe measurements have not been reported and previous studies did not have access to pre-COVID-19 imaging to inform on potential mechanisms linking symptoms and gas-exchange abnormalities.7 8 Here, we endeavoured to determine whether 129Xe MRI gas-transfer measurements normalised over time in people with PACS and if such changes occurred in concert with improved QoL and DLCO measurements.
Methods
We obtained written-informed consent from participants 18–80 years of age for this prospective study. Participants with a previous positive PCR COVID-19 test and ongoing symptoms were recruited from a local COVID-19 clinic. Study visits were planned for 3±1 months (baseline) and 15±3 months (follow-up) post-COVID-19+ test. Participants underwent 129Xe ventilation MRI, 129Xe gas-transfer MRI, spirometry, diffusing capacity of the lung (DLCO) measurement, fraction of exhaled nitric oxide (FeNO) measurement, 6 min walk test (6MWT) and the St. George’s Respiratory Questionnaire (SGRQ). The 129Xe MRI red blood cell (RBC) to alveolar tissue plasma (TP) ratio was the primary endpoint. SPSS (SPSS Statistics V.27.0; IBM) was used for all statistical analyses. Data were tested for normality using Shapiro-Wilk tests and nonparametric tests were performed for non-normally distributed data. Correlations were evaluated using Pearson (r) and Spearman (ρ) correlations. Pearson and Spearman correlations at baseline and follow-up were compared using the Fisher’s z-score. Repeated measures were tested using paired t-tests. Results were considered statistically significant when the probability of making a type I error was <5% (p<0.05). Detailed methods are provided in online supplemental file 1. Baseline results were previously reported.8
Supplemental material
Results
At baseline, we enrolled 34 participants8 and 21 of these (7 female, age=56±15 years) returned for follow-up. For these 21 participants with PACS, the baseline visit occurred 7±4 months post-COVID-19 infection with positive tests occurring during the period March 2020 to April 2021, which was prior to the population-based vaccination initiatives in our local area. The follow-up visit occurred 14±4 months post-COVID-19 infection. Participant demographics are detailed in online supplemental e-Table 1. Nine of these participants were hospitalised due to COVID-19 infection, and one required intubation during a 4-week intensive care unit admission. Five participants were diagnosed with pulmonary embolism (via CT angiogram) during their COVID-19 infectious period. Medications are summarised in online supplemental e-Table 2.
Figure 1 summarises baseline and follow-up clinical, QoL and imaging measurements in tabular format and spaghetti plots for DLCO, SGRQ and 129Xe MRI measurements. There were no significant differences in spirometry, 6MWD (Δ=22;95% 95% CI=0 to 44, p=0.084) and FeNO (Δ=−3; 95% CI=−6 to –1, p=0.084) between visits; FeNO measurements were normal across visits. DLCO (Δ=14; 95% CI=7 to –21, p<0.001), SGRQ-total (Δ=−6; 95% CI=−1 to –11, p=0.044) and symptom-score (Δ=−11; 95% CI=−2 to 20, p=0.032) significantly improved at follow-up. There was also significantly improved postexertional dyspnoea (measured using the modified Borg Dyspnoea Scale post-6MWT, Δ=−0.7; 95% CI=−0.2 to –1.2, p=0.019) but not 129Xe RBC:TP (Δ=0.03; 95% CI=0.01 to 0.05, p=0.051), 129Xe RBC:gas (Δ=0.06; 95% CI=0.02 to 0.10, p=0.055) or FeNO (Δ=−3; 95% CI=0 to –6, p=0.084) at 14 months. At baseline, two participants desaturated (ΔSpO2=−9%, −7%) following the 6MWT while at follow-up, no participants desaturated.
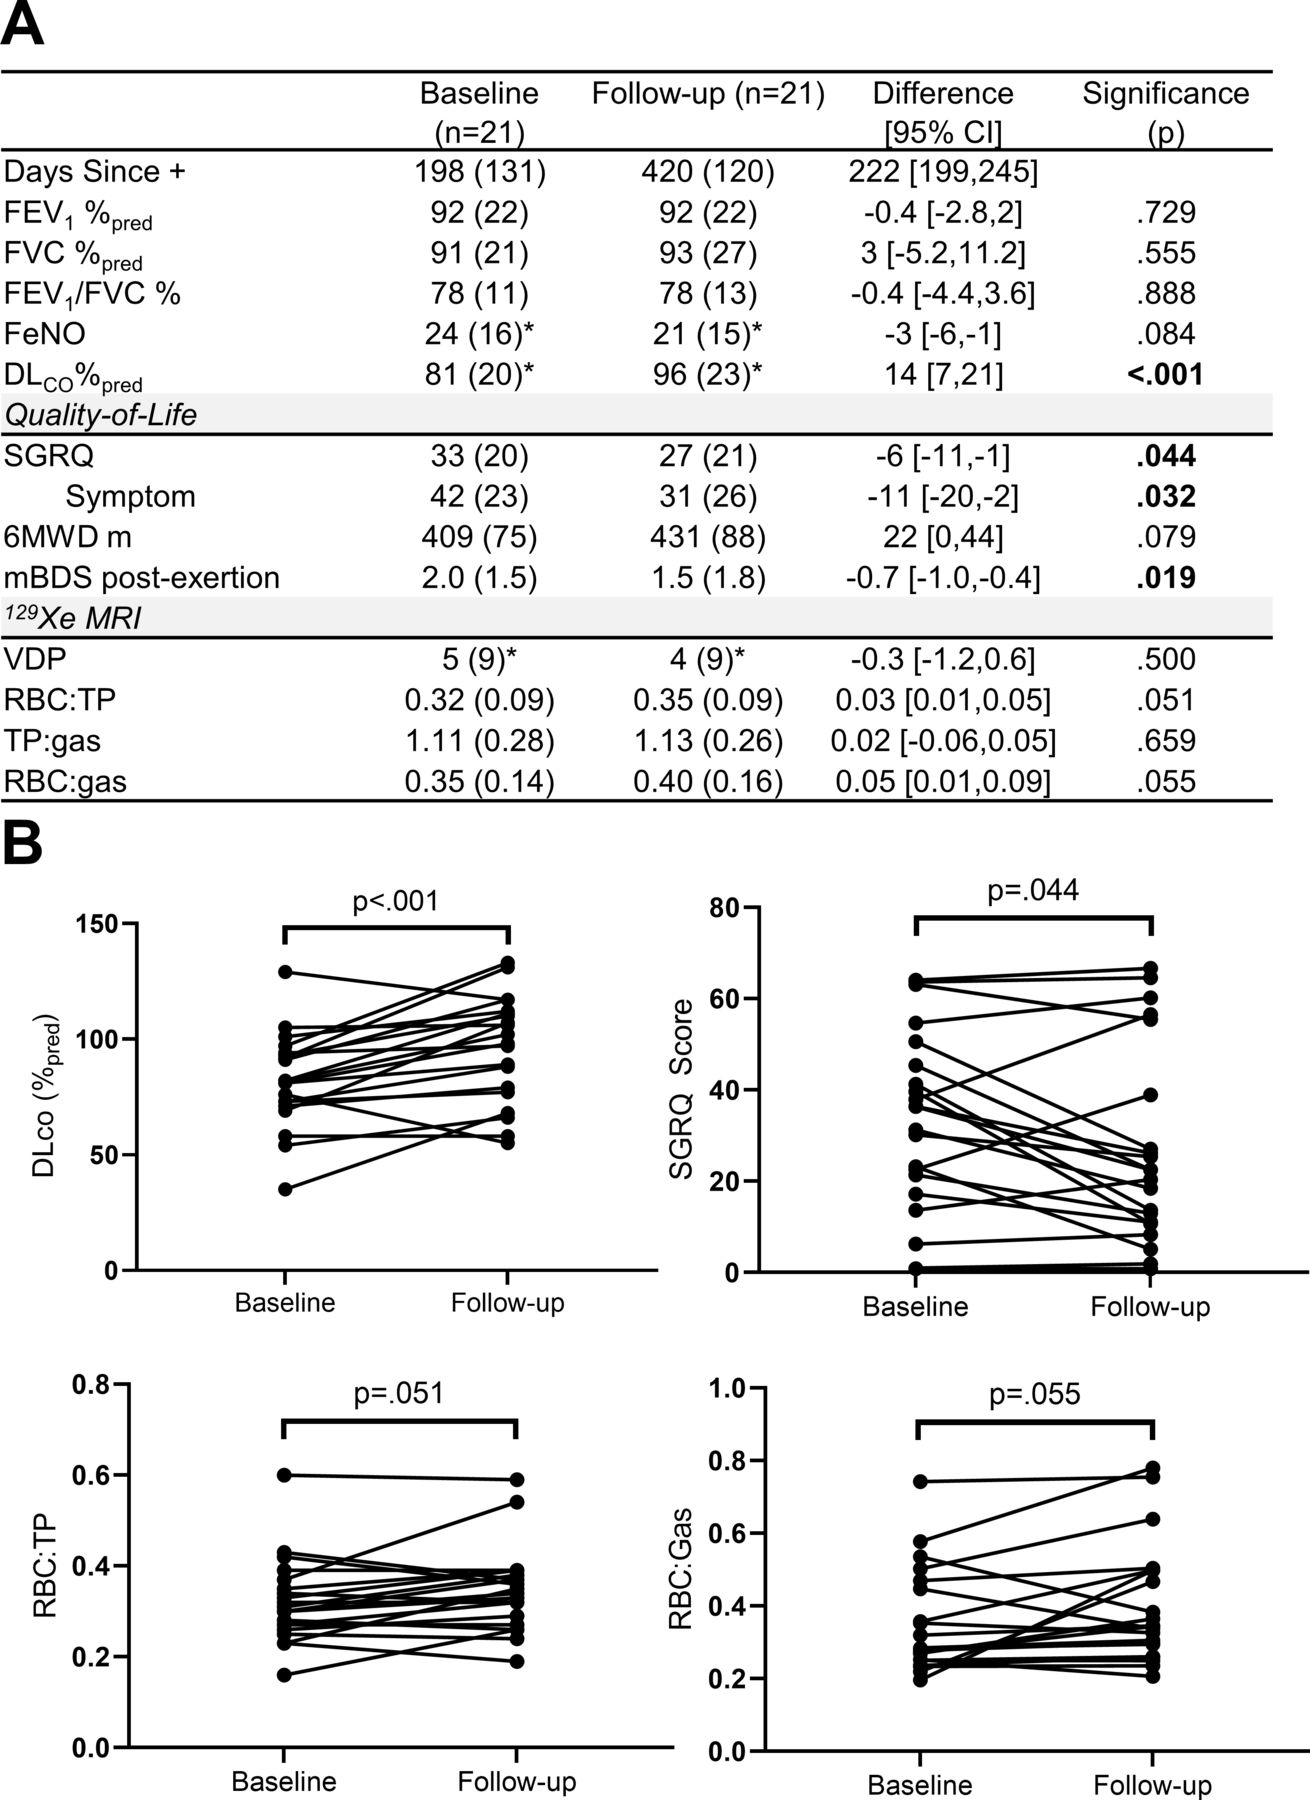
Clinical, quality of life and imaging measurements at baseline (7±4 months since PCR test) and follow-up (14±4 months since PCR test). (A) shows tabulated baseline and follow-up measurements. (B) provides spaghetti plots for DLCO, SGRQ score, 129Xe MRI RBC:TP and RBC:gas measurements at baseline and follow-up. Differences were analysed for significance using paired t-tests. *n=20. 6MWD, 6 min walk distance; DLCO, diffusing capacity of the lung for carbon monoxide; FEV1, forced expiratory volume in 1 s; %pred, per cent of predicted value; FVC, forced vital capacity; FeNO, fractional exhaled nitric oxide; mBDS, modified Borg Dyspnoea Scale; RBC, red blood cell; SGRQ, St. George’s Respiratory Questionnaire; TP, tissue plasma.
Figure 2 shows representative three-dimensional 129Xe MRI RBC maps coregistered with the corresponding segmented CT vessel tree for a single 31-year-old male participant at baseline and follow-up. 129Xe MRI RBC map focal defects were obvious in the left and right lower lobes at baseline (shown in the insets) and this was coincident with an SGRQ total score of 23, postexertional breathlessness score of 3 and RBC:TP ratio of 0.37. At follow-up, shown in the right panel, the RBC defects visually improved and this was coincident with clinically relevant improvements9 in SGRQ total score of 5, postexertional breathlessness score of 1 and improved RBC:TP ratio (0.54). Online supplemental e-Figure 1 shows multiple slices of ventilation and two dimensional raw RBC component of the dissolved phase images at both baseline and follow-up for additional participants.
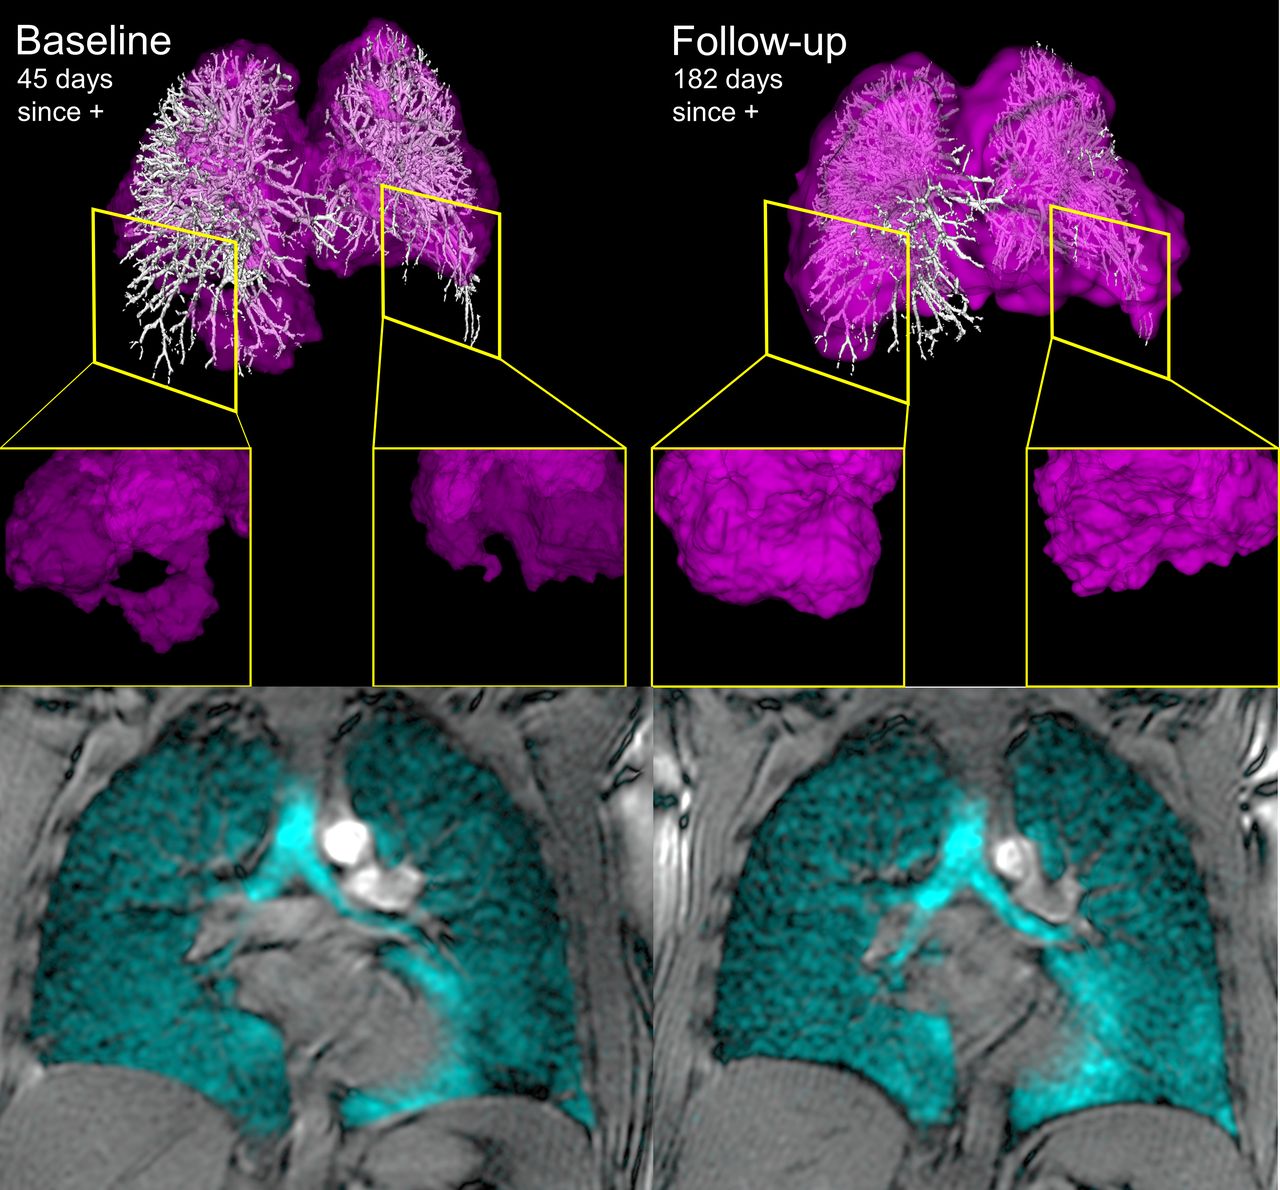
129Xe MRI and coregistered pulmonary vascular tree CT at baseline and follow-up. Left and right panels show 129Xe MRI RBC map (pink) coregistered with CT pulmonary vascular tree (white) and bottom panels show 129Xe ventilation images (cyan) for a previously healthy participant hospitalised with COVID-19 symptoms and pulmonary embolism. At baseline, 45 days post-COVID-19 positive test, RBC:TP ratio was abnormally low (0.37) and insets provide examples of RBC map defects. At follow-up the RBC:TP ratio improved (0.54) as did the lower lobe red blood cell map defects shown in the right panel inset. DLCO (baseline=93%pred, follow-up=110%pred) and total SGRQ score. (baseline=23, follow-up=5) also improved at follow-up. DLCO, diffusing capacity of the lung for carbon monoxide; RBC, red blood cell; SGRQ, St George’s Respiratory Questionnaire.
Figure 3A shows weak-to-moderate correlations for DLCO and 129Xe MRI RBC:TP (r=0.60 95% CI=0.22 to 0.82, p=0.004) and RBC:Gas (ρ=0.48, 95% CI=0.04 to 0.76, p=0.029) at baseline. Figure 3B shows DLCO correlations at follow-up (RBC:TP r=0.47, 95% CI=0.04 to 0.76, p=0.035; RBC:Gas, ρ=0.57, 95% CI=0.16 to 0.81, p=0.009). The correlations for DLCO and RBC:TP at baseline (r=0.60, p=0.004) and follow-up (r=0.47, p=0.03) were not significantly different (z score=0.51, p=0.609). Online supplemental e-Figure 2 shows significant correlations for the change in SGRQ at follow-up with the change in DLCO (r=−0.55, CI=−0.14 to −0.80, p=0.012) and postexertional Borg dyspnoea (r=0.68, 95% CI=0.35 to 0.86, p=0.001).

Correlations between DLCO and 129Xe MRI measurements. At baseline and follow-up, there were weak to moderate, significantcorrelations between DLCO and 129Xe MRI RBC:TP and RBC:gas ratios. (Participants with DLCO measurement n=20). DLCO, diffusing capacity of the lung for carbon monoxide; RBC, red blood cell; TP, tissue plasma.
Discussion
Previous work revealed the presence of 129Xe gas-transfer abnormalities in people with PACS,7 8 and showed that these abnormalities were related to dyspnoea and exercise limitation.8 We examined a small group of 21 participants with PACS to measure SGRQ, DLCO and 129Xe MRI gas-exchange measurements, 7 months after a baseline visit and observed: (1) significant improvements in DLCO, SGRQ scores and postexertional dyspnoea, (2) persistently abnormal 129Xe MRI RBC:TP values, (healthy volunteer RBC:TP=0.41±0.10)8 and (3) positive correlation for DLCO with 129Xe MRI RBC measurements, negative correlation for the change in DLCO with the change in SGRQ and a positive correlation for the change in DLCO with postexertional dyspnoea at follow-up. Whether this snapshot in time, 14±2 months postinfection reflects a slow, ongoing recovery or permanent impairment, remains to be ascertained.
Previous work8 detected a significant correlation between DLCO and 129Xe RBC:TP in PACS and here, we observed that this correlation persisted over time. This suggested that 129Xe RBC:TP detected abnormal alveolar gas-exchange that remained abnormal in people with PACS, long after the infection had resolved. We also observed a correlation between postexertional dyspnoea and DLCO on SGRQ-score, underscoring the impact of dyspnoea and gas-exchange improvements on QoL improvements in PACS.
Together, these data suggest gas-exchange abnormalities at least partially resolved during a period of 7 months (and 14 months postinfection). While we do not know the precise cause of abnormal RBC:TP in these participants, a recently published study that evaluated postmortem COVID-19 lungs described vasculo pathologies including vascular congestion, perivascular inflammation, thromboemboli and infarcts unique to COVID-19 that could explain ongoing pulmonary vascular abnormalities.10
To our knowledge, this is the first longitudinal 129Xe gas-transfer MRI study of PACS. This study was limited by small sample size. 129Xe spectroscopy had not previously been performed at our site and this study was, therefore, not powered for spectroscopy measurements. The sample size was also limited by incomplete retention of the original cohort of study participants. Retention difficulties stemmed from a number of reasons including the fact that fully recovered participants were less inclined to return for a follow-up visit during the COVID-19 pandemic and because of institutional requirements for fully vaccinated participants at follow-up. We also note that measurements were not available in these participants prior to infection and this makes it difficult to distinguish abnormalities due to PACS or other sources. In particular, seven patients had pre-existing asthma and one had pre-existing COPD, which may have impacted gas-exchange measurements.
We measured improved SGRQ, DLCO and postexertional dyspnoea 14 months as compared with 7 months postinfection. Taken together, these findings provide hypothesis-generating insights, which may help target future research on the mechanisms of gas-exchange abnormalities in people with PACS.
Ethics statements
Patient consent for publication
Ethics approval
This study involves human participants and was approved by Western University Health Science Research Ethics Board #113224. Participants gave informed consent to participate in the study before taking part.
Acknowledgments
The authors acknowledge the support of the London Health Sciences Centre (London Canada) COVID-19 clinic and Middlesex London Health Unit London Canada (which provided all COVID-19 testing and reporting) as well as the participants who participated in this longitudinal study.
Supplementary materials
Supplementary Data
This web only file has been produced by the BMJ Publishing Group from an electronic file supplied by the author(s) and has not been edited for content.
Footnotes
Contributors AMM, MJM and HKK were responsible for data acquisition and analysis. AMM was responsible for preparing the first draft of the manuscript. ID and JN were responsible for recruiting study participants and providing clinical input and interpretation of the data. MA, MSA, AO and SS supported the study design development and interpretation of the data. GP was responsible for study design, data analysis and interpretation as well as being the guarantor of study data integrity. All authors had an opportunity to review and revise the manuscript and approved its final submitted version.
Funding This study was funded by the Ministry of Health and Long-Term Care, Ontario CANADA. AMM is supported by a Natural Sciences and Engineering Research Council (Canada) doctoral scholarship. GP and SS are supported by the Canada Research Chair Program.
Competing interests SS has received honoraria for speaking engagements from AstraZeneca, Novartis and Polarean, personal fees from Arrowhead Pharma and received study funding from Cyclomedia, none of which was related to this work. JN has received honoraria from AstraZeneca, Horizon Therapeutics and Vertex outside the submitted work. GP has received research support and consulting fees from Novartis and AstraZeneca and personal fees for speaking engagements from AstraZeneca and Polarean Imaging. AMM, MJM, HKK, MA, MSA, ID and AO have no conflicts to declare.
Provenance and peer review Not commissioned; externally peer reviewed.
Supplemental material This content has been supplied by the author(s). It has not been vetted by BMJ Publishing Group Limited (BMJ) and may not have been peer-reviewed. Any opinions or recommendations discussed are solely those of the author(s) and are not endorsed by BMJ. BMJ disclaims all liability and responsibility arising from any reliance placed on the content. Where the content includes any translated material, BMJ does not warrant the accuracy and reliability of the translations (including but not limited to local regulations, clinical guidelines, terminology, drug names and drug dosages), and is not responsible for any error and/or omissions arising from translation and adaptation or otherwise.