Article Text

Abstract
Background The QCovid algorithm is a risk prediction tool that can be used to stratify individuals by risk of COVID-19 hospitalisation and mortality. Version 1 of the algorithm was trained using data covering 10.5 million patients in England in the period 24 January 2020 to 30 April 2020. We carried out an external validation of version 1 of the QCovid algorithm in Scotland.
Methods We established a national COVID-19 data platform using individual level data for the population of Scotland (5.4 million residents). Primary care data were linked to reverse-transcription PCR (RT-PCR) virology testing, hospitalisation and mortality data. We assessed the performance of the QCovid algorithm in predicting COVID-19 hospitalisations and deaths in our dataset for two time periods matching the original study: 1 March 2020 to 30 April 2020, and 1 May 2020 to 30 June 2020.
Results Our dataset comprised 5 384 819 individuals, representing 99% of the estimated population (5 463 300) resident in Scotland in 2020. The algorithm showed good calibration in the first period, but systematic overestimation of risk in the second period, prior to temporal recalibration. Harrell’s C for deaths in females and males in the first period was 0.95 (95% CI 0.94 to 0.95) and 0.93 (95% CI 0.92 to 0.93), respectively. Harrell’s C for hospitalisations in females and males in the first period was 0.81 (95% CI 0.80 to 0.82) and 0.82 (95% CI 0.81 to 0.82), respectively.
Conclusions Version 1 of the QCovid algorithm showed high levels of discrimination in predicting the risk of COVID-19 hospitalisations and deaths in adults resident in Scotland for the original two time periods studied, but is likely to need ongoing recalibration prospectively.
- COVID-19
- clinical epidemiology
Data availability statement
All code, metadata and documentation for this project is publicly available at https://github.com/EAVE-II/Qcovid-validation. A data dictionary is available at https://github.com/EAVE-II/EAVE-II-data-dictionary. Most of the data that were used in this study are highly sensitive and will not be made available publicly.
This is an open access article distributed in accordance with the Creative Commons Attribution Non Commercial (CC BY-NC 4.0) license, which permits others to distribute, remix, adapt, build upon this work non-commercially, and license their derivative works on different terms, provided the original work is properly cited, appropriate credit is given, any changes made indicated, and the use is non-commercial. See: http://creativecommons.org/licenses/by-nc/4.0/.
Statistics from Altmetric.com
Key messages
What is the key question?
Does the QCovid algorithm accurately predict the risk of COVID-19 hospitalisation and death in Scotland?
What is the bottom line?
The algorithm performed well according to a number of metrics we evaluated.
Why read on?
It is important to validate the QCovid risk prediction algorithm because it is being used in the UK to inform shielding and vaccine prioritisation policies.
Introduction
In December 2019, a novel coronavirus (SARS-CoV-2) emerged in Wuhan, China.1 WHO declared the outbreak a public health emergency of international concern on 30 January 2020, and then a pandemic on 11 March 2020. As of 15 September 2021, WHO has reported more than 225 million confirmed cases globally and over 4.6 million deaths.1
Rapid, large-scale observational epidemiological studies have been used to identify the characteristics of people who are at greatest risk of COVID-19 hospitalisation and death, and to develop risk scoring systems.2–5 These studies have been used to guide policy for public health interventions, for example, lockdown measures, patient shielding and prioritisation for vaccination.6 The QCovid algorithm is one such risk scoring system that predicts the probability of COVID-19 hospitalisation and death. It was commissioned by the chief medical officer for England on behalf of the UK government. Version 1 of the algorithm was trained using data from 1205 general practices (n=10.5 million patients) in England using data drawn from the QResearch database for the period 24 January 2020 to 30 April 2020.2 This period covers the ‘first wave’ of the pandemic in the UK, where testing and treatments for the disease were limited. Candidate predictor variables were selected on the basis of clinical plausibility, association with outcomes in other respiratory diseases and availability. A model selection process was followed that included removing variables with associated HRs close to 1, and variables whose predicted effect were clinically counterintuitive. The QCovid algorithm has been used by the UK government to inform policies on shielding and vaccine prioritisation for England.7
Following a request from the Scottish Government, we sought to externally validate the QCovid algorithm for the adult population resident in Scotland.
Methods
Study design
Approximately 99% of the residents of Scotland were registered with primary care facilities that provide a comprehensive array of healthcare services. During the acute phase of the pandemic, community based COVID-19 hubs (a general practitioner (GP)-led service designed to segment patients and reduce the risk of nosocomial infections) were established. We developed retrospective cohorts drawn from patients registered with any primary care practice in Scotland from the period 1 March 2020 to 24 October 2020.
Datasets
We used data from all 940 Scottish primary care practices. Clinical data collected by primary care practitioners in Scotland have consistently been shown to be of high quality (90% completeness and accuracy8) and of great utility in epidemiological research.9–12 These were linked to the Electronic Communication of Surveillance in Scotland (national database for all virology testing including NHS (National Health Service) and UK Government test centre data), the Scottish Morbidity Record (record of hospitalisation data), and National Records Scotland (death certification) data as part of the Early Pandemic Evaluation and Enhanced Surveillance of COVID-19 (EAVE II) platform.3 A more detailed description of the data can be found in our cohort profile.13
Selection criteria
Any individual in the relevant linked dataset between the ages of 19 and 100 was included. Individuals who had an outcome event (COVID-19 hospitalisation or death) in the first period (1 March 2020–30 April 2020) were excluded from any analysis in the second period (1 May 2020–30 June 2020) (figure 1).

Study design. GP, general practitioner.
Exposures
Exposure variables were those used in the final selection of version 1 of the QCovid algorithm.2 These are detailed in box 1. All variables were taken as the most recent recorded value prior to the index date in the relevant dataset wherever available.
Predictor variables in the QCovid algorithm
Age in years (continuous).
Townsend deprivation score (continuous).
Accommodation (neither homeless nor care home, care home or nursing home).
Ethnicity in 10 categories (Bangladeshi, Black African, Black Caribbean, Chinese, Indian, Mixed, Pakistani, White British, White Other, Other, Unknown).
Body mass index (kg/m2).
Chronic kidney disease (CKD)—(no CKD, CKD3, CKD4, CKD5, unknown).
Learning disability (no learning disability, Down’s syndrome, other learning disability).
Chemotherapy in last 12 months (none, chemotherapy group A, B, C, unknown).
Respiratory cancer.
Radiotherapy in last 6 months.
Solid organ transplant.
Prescribed immunosuppressant medication by general practitioner.
Prescribed leukotriene or long-acting beta blockers.
Prescribed regular prednisolone.
Sickle cell disease.
Diabetes.
Chronic obstructive pulmonary disease.
Asthma.
Rare pulmonary diseases.
Pulmonary hypertension or pulmonary fibrosis.
Coronary heart disease.
Stroke.
Atrial fibrillation.
Congestive cardiac failure.
Venous thromboembolism.
Peripheral vascular disease.
Congenital heart disease.
Dementia.
Parkinson’s disease.
Epilepsy.
Rare neurological conditions.
Cerebral palsy.
Severe mental illness (bipolar disorder, schizophrenia, severe depression).
Osteoporotic fracture.
Rheumatoid arthritis or systemic lupus erythematosus.
Cirrhosis of the liver.
Outcomes
The primary outcomes were time to COVID-19 hospitalisation (hospitalisation with reverse-transcription PCR (RT-PCR) positive COVID-19 test within 28 days prior to admission and up to 2 days after admission, or admission with ICD-10 codes for COVID-19) and time to COVID-19 death (all-cause certified death 28 days postpositive RT-PCR test from National Records Scotland).
Missing data
Chemotherapy data were not available, so all individuals in the cohorts were assigned to the ‘none’ category for this variable. We also did not have data available indicating whether the individual had a bone marrow or stem cell transplant in the last 6 months, whether they had received radiotherapy in the last 6 months, and whether they had received a solid organ transplant. The values of these variables (chemocat, p_marrow6, p_radio6 and p_solidtransplant) were set to ‘none’ in the cohorts. For all other comorbidities/treatments, a missing value was taken to indicate absence of that comorbidity/treatment.
Ethnicity data were not available, and all individuals in both cohorts were assigned to ‘white British’. The most fine-grained residential location information available in our dataset was data zone, which is a geographical designation comprising of groups of UK Census output areas. Output areas typically consist of ~300 people, whereas data zones typically consist of 500–1000 people.14 Townsend Deprivation Scores (TDS)15 for each output area were obtained from the 2011 UK census.16 We took the median value of TDS for the output areas comprising each data zone in order to get a deprivation score for each data zone. Missing values for TDS were replaced with the mean value for the cohort. Missing values in the housing category variable were taken to indicate the individual was neither homeless, nor resident in a care home.
We used ordinary least squares regression with all other independent variables included as predictors to impute missing values for body mass index (BMI). There is some evidence of an association between higher BMI and lower levels of socioeconomic status in developed countries.17 Sex is known to be associated with BMI, as is coronary artery disease and diabetes.18 19
There were no missing values for any of the other independent variables.
Model validation
We applied version 1 of the QCovid algorithm to males and females in the validation dataset and computed Harrell’s Concordance,20 the Brier scores, Royston’s D,21 R2 21 and observed-expected ratio for the two time periods 1 March 2020 to 30 April 2020, and 1 May 2020 to 30 June 2020. Harrell’s Concordance is a performance metric that characterises the tendency for people with higher risk scores to have earlier events. The Brier score is a measure of forecast accuracy that is equal to the mean squared prediction error. Royston’s D is a measure of ‘separation’ between survival curves for individuals with different characteristics. R2 is a measure of the proportion of variation in survival time explained by the model. Observed-expected ratio is the number of observed events divided by the expected number of events predicted by the model. We made plots of observed vs expected risk by vigintiles of predicted risk. We recalibrated the algorithm in the second time period by scaling predicted risks by a multiplicative constant so that expected total number of events predicted was equal to observed total number of events.
Reporting
This study is reported in accordance with the Transparent reporting of a multivariable prediction model for individual prognosis or diagnosis guidelines.22
Results
Characteristics of the study population
The total number of people in our dataset was 5 384 819, representing 99% of the entire population (5 463 300) estimated to be residing in Scotland in 2020.
After applying selection criteria, there were 4 392 014 individuals in the first time period cohort, and 4 382 281 individuals in the second time period cohort.
There were 5519 COVID-19 hospitalisations and 2693 COVID-19 deaths in the first time period. There were 5446 COVID-19 hospitalisations and 1300 COVID-19 deaths in the second time period. Hospitalisation and mortality tended to be positively associated with age and comorbidities (online supplemental tables 1 and 2).
Supplemental material
Performance statistics
Table 1 shows Harrell’s C, R2, Royston’s D, Brier score and observed-expected ratio for the QCovid algorithm in predicting COVID-19 hospitalisations and deaths in our dataset for males and females in the first and second periods, respectively. Overall, the algorithm performed well according to these metrics. For predicting the risk of COVID-19 death in females in the first period, their values were: R2 0.72 (95% CI 0.71 to 0.73); Royston’s D 3.28 (95% CI 3.20 to 3.37); Harrell’s C 0.95 (95% CI 0.94 to 0.95); Brier score 0.0022 (95% CI 0.0008 to 0.0035); Observed-expected ratio 1.94. For predicting the risk of COVID-19 hospitalisation in females in the first time period, we found R2 0.47 (95% CI 0.46 to 0.49); Royston’s D 1.93 (95% CI 1.87 to 2.00); Harrell’s C 0.81 (95% CI 0.80 to 0.82); Brier score 0.0011 (95% CI 0.0009 to 0.0013); Observed-expected ratio 1.13. The performance metrics for males were mostly of a similar magnitude. The high values for Harrell’s C, and low values for the mean squared prediction error (Brier score) are particularly notable. Figure 2 shows Harrell’s C stratified by sex, period and age group. Concordance was relatively high, with 95% CIs tending to get smaller as age increased, likely due to the larger number of events. The calibration plots in figure 3 overall showed good agreement between observed and predicted risks, particularly in the first period, but with a tendency to overpredict hospitalisation and death for those at higher predicted risk in the second period, as reflected in the low observed-expected ratios (table 1). Figure 4 shows the results after recalibrating in the second time period. Agreement between observed and predicted risk improved markedly, though risk in the highest vigintile was underpredicted.
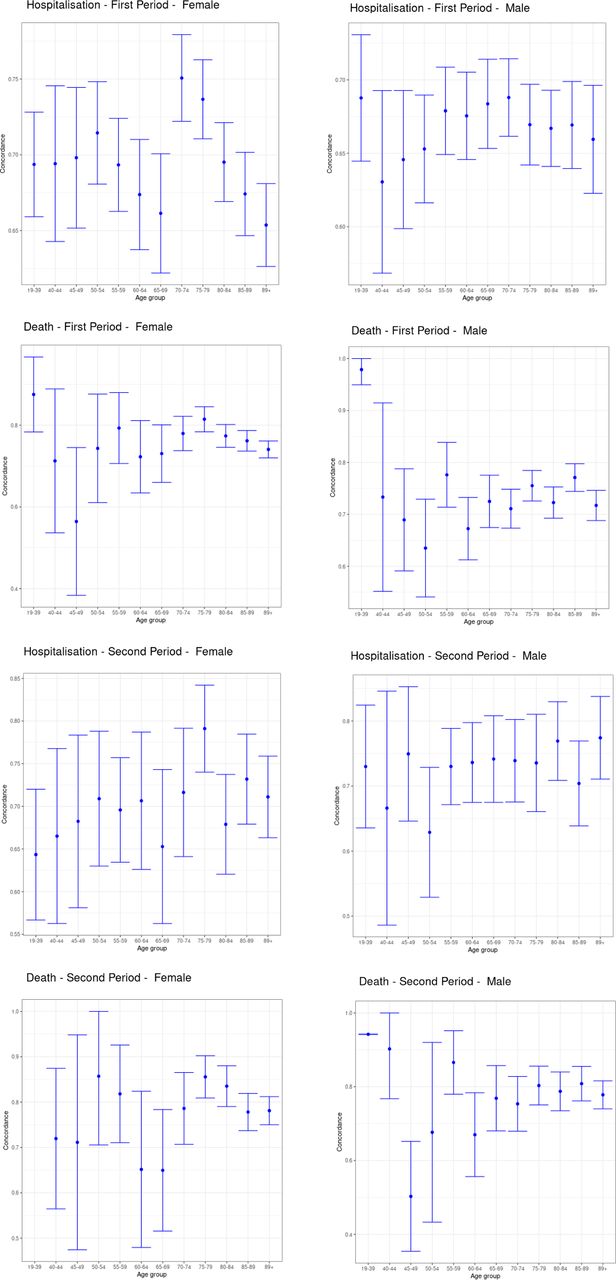
Harrell's C stratified by age, sex and period.
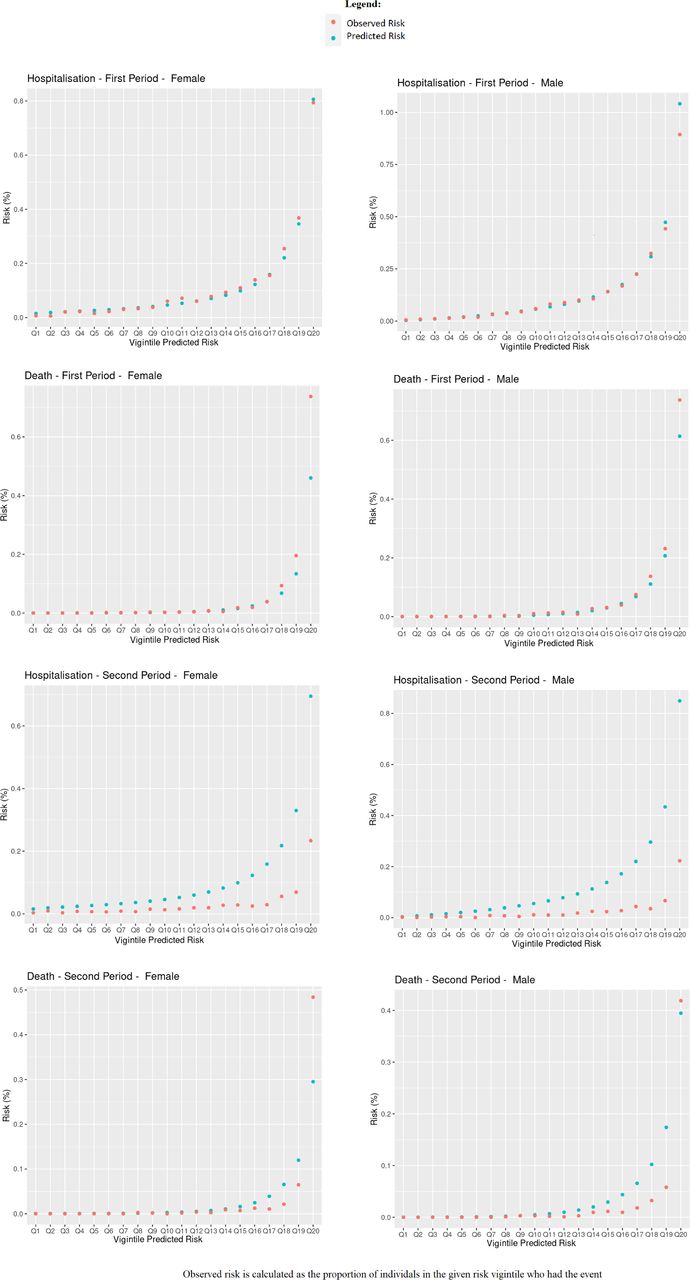
Observed and predicted risk.

Observed and predicted risk in second period, recalibrated.
Performance metrics for COVID-19 hospitalisation by sex and time period
Discussion
This is the first national external validation of the QCovid algorithm for both COVID-19 hospitalisations and deaths. We found that the algorithm performed well against a range of performance metrics in males and females resident in Scotland for both the time periods under investigation. The algorithm showed good calibration in the first time period, and was improved in the second time period after recalibrating.
The QResearch database was used to train the QCovid algorithm.23 It links together primary and secondary healthcare records, RT-PCR testing results and mortality records. As of April 2020, 1205 general practices in England were contributing to the QResearch, with coverage of ~10.5 million patients. The QResearch database has been used extensively to develop risk prediction algorithms across the NHS (National Health Service).
Overall, the cohort used in the derivation of the QCovid algorithm and the validation cohorts used in this paper were statistically quite similar with respect to the marginal distributions of patient characteristics used in the algorithm. A notable exception is BMI; ~62% of the derivation cohort had BMI in the 18.5–30 range, whereas only ~32% of the validation cohort used in this paper had a BMI in the same range. There are also likely to be significant differences in ethnic background; 64.51% of the derivation cohort had ‘white’ ethnicity, whereas ~96% of the population of Scotland have ‘white’ ethnicity according to the 2011 Scottish census.14
Our study had a number of important strengths. We developed a unique linked dataset covering 99% of the population resident in Scotland. The EAVE II database3 is one of the few national individual patient-level linked research databases in the world.24 We evaluated the performance of the QCovid algorithm according to all metrics used in the original paper1 and for identical time periods to facilitate comparison of results. We used binned plots for the Brier score and observed-expected ratio as our chosen measures of calibration because we believe they are pragmatic and informative for policy-makers.
However, our work has several limitations. We did not have data available for chemotherapy treatment, bone marrow or stem cell transplants, and solid organ transplants. The values of these variables were set to ‘none’ for all individuals. We believe this was reasonable for evaluating the overall performance of the algorithm because these treatments were extremely rare in the original derivation cohort.2 These conditions are associated with slightly higher predicted risk of COVID-19 hospitalisation and death in the QCovid algorithm. Therefore, individuals with these conditions had slightly lower predicted risk than if this information was available. We also did not have access to ethnicity data, so all individuals were set to ‘White British’. We believe modal substitution for ethnicity was reasonable because the most recent Scottish census indicated that 96% of the residents of Scotland identified their ethnicity as ‘white’. We believe that minority ethnicities are more likely to have their ethnicity recorded by GPs in our dataset compared with white ethnicity and therefore missing values in the ethnicity field are likely to be disproportionately white compared with the population. Ceteris paribus, QCovid predicts slightly higher risk of hospitalisation and death for individuals of non-white ethnicity. Members of ethnic minority groups whose ethnicity was not recorded in our dataset will therefore have been assigned a slightly lower predicted risk of COVID-19 hospitalisation and death than if their ethnicity had been available. There was significant missingness in the BMI data, with 2 289 759 (52.1%) missing values in the 1 March 2020–30 April 2020 cohort, and 2 114 639 (48.3%) missing values in the 1 May 2020–30 June 2020 cohort. We used ordinary least squares regression to impute these missing values for BMI. We considered multiple imputation, but decided against it because it would not have been feasible given the high degree of missingness and the compute resources available to us. We believe that the average of multiple imputations would likely be similar to the mean predicted by OLS. We did not expect this to significantly affect the results of this validation exercise. The most fine-grained residential location information available in our dataset was data zone, which typically consists of multiple 2011 UK census output areas. We took the median value of the TDS for the output areas comprising each data zone in order to get a deprivation score for each data zone. Missing values of TDS were replaced with the average value for the cohort. Higher levels of deprivation as measured by TDS was associated with increased predicted risk of COVID-19 hospitalisation and death in the QCovid algorithm. The direction of the effect of having more finely grained residential location data available would have on QCovid predicted risk of COVID-19 hospitalisation and death is dependent on whether the TDS for an individual’s output area is higher or lower than the median TDS in the output areas comprising their data zone. The algorithm had a tendency to overpredict risk of hospitalisation and death for those at higher predicted risk in the second time period. However, after recalibration there was good agreement between observed and predicted risk. This suggests that while QCovid risk scores showed good levels of discrimination of outcome, risk predictions from the QCovid algorithm may require recalibration in clinical practice.
QCovid has been used by the UK government to identify the clinically extremely vulnerable for shielding advice and to inform vaccine prioritisation policies in determining priority groups, in particular for those in Joint Committee on Vaccination and Immunisation category 6.6 Other potential applications of the algorithm include deciding who should be prioritised for treatments or boosters. QCovid is a ‘living’ risk prediction algorithm, in the sense that it can be trained on new data as these become available, and should show responsiveness to changing circumstances. The time period we studied corresponds to the ‘first wave’ of the pandemic in the UK during which treatments were limited. Availability and use of treatments have since improved. Since the period of study in this paper, several new SARS-Cov-2 variants have emerged, vaccines have seen widespread roll out in the UK, and policies on non-pharmaceutical interventions have evolved over time. Versions 2 and 3 of the algorithm are currently under development. Vaccination status and evidence of prior infection are planned to be used as predictors in version 3. The findings from this validation work have been communicated to the Scottish government.
Data availability statement
All code, metadata and documentation for this project is publicly available at https://github.com/EAVE-II/Qcovid-validation. A data dictionary is available at https://github.com/EAVE-II/EAVE-II-data-dictionary. Most of the data that were used in this study are highly sensitive and will not be made available publicly.
Ethics statements
Patient consent for publication
Ethics approval
Ethical permission for this study was granted from South East Scotland Research Ethics Committee 02 (12/SS/0201). The Public Benefit and Privacy Panel Committee of Public Health Scotland, approved the linkage and analysis of the deidentified datasets for this project (1920-0279).
Acknowledgments
The authors would like to thank staff at Public Health Scotland, Albasoft Ltd, the general practices that contributed data to the study and the EAVE II Collaborators. AS, JM and CR serve on The Scottish Government’s COVID-19 Chief Medical Officer’s Advisory Group and the New and Emerging Respiratory Virus Threats Advisory Group (NERVTAG) Risk Stratification Subgroup.
References
Supplementary materials
Supplementary Data
This web only file has been produced by the BMJ Publishing Group from an electronic file supplied by the author(s) and has not been edited for content.
Footnotes
Twitter @DrAzizSheikh
Contributors AS and JH-C conceptualised the study. CR carried out the formal analysis. CRS wrote the initial draft of the manuscript. SK and EM assisted with the statistical analysis. SK wrote later versions of the manuscript. All authors assisted with review and editing. CR, EM and EV have verified the underlying data. CR is the guarantor for this work.
Funding Medical Research Council (MR/R008345/1), National Institute for Health Research Health Technology Assessment Programme, funded through the UK Research and Innovation Industrial Strategy Challenge Fund Health Data Research UK.
Competing interests JH-C reports grants from MRC, grants from Wellcome Trust, grants from NIHR, during the conduct of the study; other from ClinRisk, outside the submitted work. AS reports grants from NIHR, grants from MRC, grants from HDR UK, during the conduct of the study.
Provenance and peer review Not commissioned; externally peer reviewed.
Supplemental material This content has been supplied by the author(s). It has not been vetted by BMJ Publishing Group Limited (BMJ) and may not have been peer-reviewed. Any opinions or recommendations discussed are solely those of the author(s) and are not endorsed by BMJ. BMJ disclaims all liability and responsibility arising from any reliance placed on the content. Where the content includes any translated material, BMJ does not warrant the accuracy and reliability of the translations (including but not limited to local regulations, clinical guidelines, terminology, drug names and drug dosages), and is not responsible for any error and/or omissions arising from translation and adaptation or otherwise.