Article Text

Abstract
Background Knowledge of the pathophysiology of COVID-19 is almost exclusively derived from studies that examined the immune response in blood. We here aimed to analyse the pulmonary immune response during severe COVID-19 and to compare this with blood responses.
Methods This was an observational study in patients with COVID-19 admitted to the intensive care unit (ICU). Mononuclear cells were purified from bronchoalveolar lavage fluid (BALF) and blood, and analysed by spectral flow cytometry; inflammatory mediators were measured in BALF and plasma.
Findings Paired blood and BALF samples were obtained from 17 patients, four of whom died in the ICU. Macrophages and T cells were the most abundant cells in BALF, with a high percentage of T cells expressing the ƴδ T cell receptor. In the lungs, both CD4 and CD8 T cells were predominantly effector memory cells (87·3% and 83·8%, respectively), and these cells expressed higher levels of the exhaustion marker programmad death-1 than in peripheral blood. Prolonged ICU stay (>14 days) was associated with a reduced proportion of activated T cells in peripheral blood and even more so in BALF. T cell activation in blood, but not in BALF, was higher in fatal COVID-19 cases. Increased levels of inflammatory mediators were more pronounced in BALF than in plasma.
Interpretation The bronchoalveolar immune response in COVID-19 has a unique local profile that strongly differs from the immune profile in peripheral blood. Fully elucidating COVID-19 pathophysiology will require investigation of the pulmonary immune response.
- viral infection
- respiratory infection
- pneumonia
- COVID-19
Data availability statement
The data that support the findings of this study are available from the corresponding author, AS, upon reasonable request.
This is an open access article distributed in accordance with the Creative Commons Attribution Non Commercial (CC BY-NC 4.0) license, which permits others to distribute, remix, adapt, build upon this work non-commercially, and license their derivative works on different terms, provided the original work is properly cited, appropriate credit is given, any changes made indicated, and the use is non-commercial. See: http://creativecommons.org/licenses/by-nc/4.0/.
Statistics from Altmetric.com
Key messages
What is the key question?
What is the local immune composition during late-stage COVID-19 and how does this relate to the systemic peripheral blood immune response?
What is the bottom line?
In severe COVID-19, the peripheral blood immune response strongly differs from the bronchoalveolar immune profile, wherein fatal COVID-19 associated with T cell activation in blood but not in bronchoalveolar lavage fluid.
Why read on?
This study is the first to describe the local immune composition during late-stage COVID-19 using bronchoalveolar lavage and associated the local with the peripheral immune response that has frequently been used as surrogate to study COVID-19 immunity.
Introduction
SARS-CoV-2 causes COVID-19 and is responsible for the current pandemic. At the time of writing, 94.1 million confirmed cases with over 2.03 million deaths have been reported in 223 countries.1 The majority of infected individuals experiences no to mild symptoms, but 14% of infected persons develop severe and 5–6% critical life-threatening disease.1 2 From the hospitalised patients, 20–30% require respiratory support in the intensive care unit (ICU), with an average of 6–8 weeks until clinical recovery,2 leading to an unprecedented strain on healthcare systems.1
Using the receptor binding domain (RBD) of the spike protein, SARS-CoV-2 infects host cells to ultimately induce cell death by pyroptosis,3 the most immunogenic form of cell death that induces a strong inflammatory response.4 The resulting wave of pro-inflammatory cytokines recruits other immune cells, mostly monocytes and T cells that act to clear the infection.3 5 6 It is hypothesised that both cytotoxic and humoral adaptive responses are necessary to efficiently control SARS-CoV-2 infection.6 Virus-specific T cells are observed in most patients,7 8 and we previously reported that the magnitude of antigen-specific T cell responses is unrelated to disease severity.9 In some patients, however, excessive release of cytokines is induced, for reasons that are currently unknown, giving rise to a cytokine storm that leads to severe lung damage and acute respiratory distress syndrome (ARDS).3 5 6 Ultimately, in 70% of fatal cases death is caused by respiratory failure due to ARDS, whereas 28% of fatal cases is due to sepsis-like cytokine storm associated multi-organ failure.10
Our understanding of the immune response to SARS-CoV-2 is limited by the fact that most studies until now have used plasma and blood cells. As characteristics of systemic immunity in ARDS differ strongly from responses in the bronchoalveolar compartment,11 these studies may fail to elucidate the main pathological feature of COVID-19: development of severe and progressive lung damage. Bronchoalveolar lavage fluid (BALF) of patients with COVID-19 appears to be enriched in transcripts of CCL2/MCP-1 and CCL7, chemokines involved in recruiting inflammatory CCR2+ monocytes.12 Inflammatory monocyte-derived macrophages were the dominant cell type in the lungs during severe and critical COVID-19 in a study using single-cell RNA sequencing.13 In patients with severe COVID-19, these inflammatory macrophages seemed less abundant, primarily due to clonal expansion of CD8 tissue-resident T cells (Trm). Using bulk RNA sequencing of blood and BALF mononuclear cells (BALFMCs) from patients with COVID-19, another study showed striking differences in expression of some of the tested genes in these different body compartments.14 However, these studies did not allow for definitive conclusions,13 14 and reports on immune cell profiling in the lungs of patients with COVID-19 based on protein expression are lacking and our knowledge thus remains limited regarding immunity during COVID-19 at the site of infection. Consequently, an urgent need still exists to further our understanding of the pulmonary immune response in COVID-19.
The current study aimed to decipher the bronchoalveolar immune response during late-stage severe COVID-19 disease and to compare this with the systemic peripheral blood immune response. To this end, we isolated mononuclear cells from both BALF and blood of patients with COVID-19 suffering from persistent ARDS. Combining spectral flow cytometry with measurements of soluble inflammatory mediators, we provide a comprehensive overview of the pulmonary and systemic immune response during late-stage COVID-19.
Materials and methods
Subjects
The current study was part of the ArtDECO-1 Study, a cohort study of patients with COVID-19 with persistent ARDS, that included all patients from whom BALFMCs were available. Left over biological samples were stored in anonymised Amsterdam UMC COVID-19 biobank (#2020-182). Informed consent was deferred until discharge from the ICU. In case of death, informed consent was requested from the patient’s relatives (see online supplemental methods for additional information).
Supplemental material
Isolation of BALF, plasma, peripheral blood mononuclear cells (PBMCs) and BALFMCs
Prior to diagnostic bronchoalveolar lavage in patients with COVID-19, which was performed once weekly when patients did not show signs of clinical improvement, venous blood was drawn in EDTA and heparin tubes. EDTA blood was centrifuged for 10 min at 1800g and supernatant plasma was collected and stored at −80°C; heparin blood was used for cell separation. During bronchoscopy, lungs were instilled with 2×20 mL 0·9% NaCl for diagnostics and remaining 3–20 mL was centrifuged. Supernatant was stored at −80°C and cell pellets were suspended in 2 mM dithiotreitol (Sigma, Zwijndrecht, the Netherlands) (see online supplemental table 2 for BALF cell composition). BALFMCs and PBMCs were isolated using Ficoll isolation and cryopreserved. BALF was collected from healthy subjects by instilling 8×20 mL aliquots 0·9% NaCl, aspirated with low suction, according to recommendations.15 Fractions 3–8 were pooled, centrifuged and supernatant was stored at −80°C.
Spectral flow cytometry
After thawing, cells were stained with live/dead stain, and monoclonal antibodies were added sequentially: CCR7, ƴδ T cell receptor, all non-brilliant (ultra) violet (BV/BUV) or non-brilliant blue (BB) labelled markers and finally all BV, BUV and BB labelled antibodies (see online supplemental table 1). Cells were measured using a five laser Aurora system (Cytek Biosciences, Fremont, California, USA) and data analysed with SpectroFlo (Cytek Biosciences, Fremont, California, USA) and OMIQ (OMIQ, Santa Clara, California, USA). PBMC samples were only included if a paired BALF sample was available with >2000 viable CD45+ cells. CD3+ and CD3− cells were analysed separately in each compartment and to cater for the different yield of viable CD45+ cells in cluster analyses, a maximum of 45 000 PBMCs (both CD3+ or CD3−) and 10 000 CD3+ and 30 000 CD3− BALFMCs were included from each sample. Manual gating strategy is depicted in online supplemental figure 1 (PBMCs) and online supplemental figure 2 (BALFMCs) and an overview of T cell subsets is presented in online supplemental table 3.
Measurements of soluble immunological mediators
Cytokines and chemokines were measured using Human Magnetic Luminex Assay (#LKTM014, R&D systems, Minnesota, USA). Anti-RBD and anti-NP IgG antibodies were measured in EDTA plasma samples at 100–1200 fold dilutions using ELISA as previously described.9
Statistical analysis
To investigate the differences between blood and BALF, effect of ICU stay and mortality on cell compositions and levels of inflammatory mediators, multiple analyses were performed. First, frequencies of immune cell subsets were compared in PBMCs and BALFMCs, and soluble mediators in plasma and BALF, collected from healthy controls and patients with COVID-19. From each patient only one sample was included. PBMC populations were associated with BALFMC populations using non-linear regression and spearman correlations. Correlations are represented using hierarchical edge bundling plot generated using the circlize package in R as previously described.16 Second, to investigate the effect of ICU stay on cell compositions and inflammatory marker levels, samples were stratified in ICU stay ≤14 days and >14 days (see online supplemental methods and figure 3 for more detail on sample selection), wherein only one sample per patients was included per stratification. Third, association of cell composition and soluble mediators with ICU mortality was investigated in both peripheral blood and BALF. See online supplemental methods for more information what statistical tests have been used in each analysis. Analyses and presentation were performed in R (V.4.0.1, Vienna, Austria), Graphad Prism V.7.01 (GraphPad Software, San Diego, California, USA) and Adobe Illustrator CC V.22.1 (Adobe, San Jose, California, USA).
Results
Patient population
Blood and BALF samples were obtained from 17 critically ill patients with COVID-19, 1 to 31 days after a median ICU stay of 15 days (IQR: 9–19.5) (online supplemental figure 3A provides information on time of sampling and number of samples per patients). ICU mortality was 23.5% (4 of 17) and 90-day mortality 29.4% (5 of 17). Patient characteristics are listed in table 1. One patient used hydrocortisone prior to development of COVID-19 for adrenal insufficiency.
Baseline characteristics and outcome (n=17)
Immune phenotyping in blood and bronchoalveolar lavage
Paired PBMC and BALFMC samples were clustered unsupervised with overlaid colours of manual gates (figure 1A,B) or staining intensity (online supplemental figures 4, 5). CD3+ T cells—taking into account their high abundance and plethora of subpopulations—were clustered separately throughout the manuscript to aid interpretation and facilitate more detailed analysis. The expression of lineage, activation and exhaustion markers by the different cell populations is displayed in heat maps (figure 1C,D). Compared with blood monocytes, monocyte-like cells in BALFMCs (further depicted as monocyte-like macrophages (Mo/MQs)) had a completely different expression of molecules such as CD38, CD1c, CD141 and CD11b. Fas receptor (CD95) was highly expressed on all, except naïve, T cell subsets in both PBMCs and BALFMCs. CD57, a marker for end-stage T cell exhaustion, was expressed in PBMCs on (terminally) differentiated effector memory T cells (EM) 3, EM4 and RA+ effector memory T cells (TEMRA) CD4 and CD8 T cells, while CD57 expression was low in BALFMCs, which may suggest that TEMRA CD8 T cells in BALF are of the functional CD57− phenotype, while in circulation exhausted CD57+ TEMRA CD8 T cells were present.17

BALF predominantly comprises T cells and monocyte-derived and alveolar macrophages. PBMCs and BALFMCs isolated from patients with COVID-19 admitted to the ICU were measured using spectral flow cytometry (n=17) with the dotted line separating data obtained from PBMCs and BALFMCs. (A, B) Unsupervised analysis using OMIQ is presented in optSNE plots wherein colours are applied to clusters after manual gating (see online supplemental figures 1,2). CD3+ and CD3− negative cells are depicted in separate optSNE plots. (C, D) Expression of lineage and exhaustion markers are depicted for all cell subsets using heat maps. (E–J) Quantification of general immune cell populations (E), T cell subsets (F) and monocyte/macrophages subsets (G) as well as their HLA-DR expression levels (H) in PBMCs and BALFMCs. HLA-DR expression on antigen presenting cells in BALFMCs (I). Statistical significance was tested after multiple testing correction for differences in cell populations or HLA-DR expression using Kruskal-Wallis (control vs patient PBMCs) or Friedmans test (patient PBMC vs BALFMC) and cytokine levels with Mann-Whitney U test (healthy vs COVID-19) or Wilcoxon signed-rank test (COVID-19 plasma vs BALF). *p<0.05, **p<0.01, ***p<0.001, ****p<0.0001. αβ, αβ T cell receptor; ƴδ, ƴδ T cell receptor; Alt, alternative; Alv, alveolar; BALFMCs, bronchoalveolar lavage fluid mononuclear cells; cDC, conventional DC; Clas, classical; CM, central memory T cells; DC, dendritic cell; DN, double negative; EM, effector memory T cells; HLA-DR, Human Leukocyte Antigen–-DR isotype; ICU, intensive care unit; ILC, innate lymphoid cells; Int, intermediate; Mo/MQ, monocyte-like macrophage; MQ, macrophage; NK, natural killer cells; PBMCs, peripheral blood mononuclear cells; pDC, plasmacytoid DC; SCM, stem cell-like memory T cells; TEMRA, RA+ effector memory T cells; Treg, regulatory T cells; Trm, tissue-resident memory T cell.
In line with prior reports of lymphopenia in severe COVID-19 cases,6 18 peripheral blood lymphocyte counts were low: 0.88 (0.74, 1.40)×106/L (median, IQR) (table 1). In general, PBMC cell frequencies were within normal ranges,19–22 and comparable to control PBMCs (figure 1E). Cell composition in BALF, however, varied widely between patients, wherein macrophages and T cells were the most abundant and variable populations (46.7±25.0% and 42.5±23.9%; mean±SD; figure 1D). BALF CD4/CD8 ratios ranged from 0.1 to 2.8 and BALFMCs displayed remarkably high percentages of double-negative (DN) αβ T cells (8.5±6.8%) and ƴδ T cells (22.2±17.7%; normal range 2–10%23) (figure 1F). While the distribution of circulating monocytes was not different between control and patient (figure 1G), human leukocyte antigen-DR isotype (HLA-DR) expression on patient monocytes was significantly reduced (figure 1H). Remarkably, monocytes isolated from BALF had a vastly different HLA-DR expression pattern compared with PBMC monocytes (figure 1H). All circulating DC subsets had reduced HLA-DR expression in patients (figure 1I).
General inflammatory markers linked to COVID-19, (ie, IL-6, C-X-C motif chemokine (CXCL)-10/IP-10, C-C motif ligand (CCL)-2/MCP-1),3 5 6 in both plasma and BALF and also anti-viral interferon-α (IFN-α) plasma levels were significantly increased of patients with COVID-19 compared with healthy controls (figure 1K). Interestingly, levels of IL-6, CCL-2/MCP-1 and IL-10, but not CXCL10/IP-10, were higher in BALF than in plasma. All patients had developed an IgG antibody response targeting RBD of the spike protein and nucleocapsid protein (N) SARS-CoV-2 (figure 1K), the two dominant immunogenic proteins of SARS-CoV-2.9
T cell differentiation and phenotypes in PBMCs and BALFMCs
Differentiation of T cells using CD95, CD28, CD27, CCR7 and CD45RA (see online supplemental table 2 for details) revealed a high prevalence of central memory CD4 T cells and terminally differentiated CD8 T cells (TEMRA) in PBMCs (figure 2A,D). In BALFMCs, however, (terminally differentiated) effector memory T cells were dominant wherein CD4 T cells were mainly EM2 and EM3 (figure 2A,D). In both plasma and BALF levels of interleukin (IL)-4, IL-17A and IFN-ƴ were all below or around detection limit (figure 2I,J, IFN-ƴ below detection limit), precluding conclusions on T cell skewing. Granzyme B levels were highly upregulated in both plasma and BALF relative to values in control samples, and in patients BALF levels were higher than plasma levels (figure 2K). Effector CD8 T cells mainly had a Trm, EM4 and TEMRA phenotype. Based on CD38 and HLA-DR expression (gating strategy in online supplemental figures 1, 2), naïve and stem-like T cells did not show any activation (data not shown), while pronounced activation was observed in the other T cell subsets (figure 2B,E). Activated BALF T cells had an even higher programmad death-1 (PD-1) expression than PBMCs. Secretion of the PD-ligand 1 (soluble PD-L1) was significantly upregulated in both BALF and plasma of patients with COVID-19. IL-2 and IL-7, both stimulating T cell proliferation and differentiation,20 24 were upregulated in patients with COVID-19 as compared with healthy control and IL-2 levels were higher in COVID-19 BALF as compared with COVID-19 plasma. Remarkably, plasma TNF-related apoptosis-inducing ligand (TRAIL) were reduced while BALF levels were increased in patients with COVID-19 as compared with healthy controls.

BALF T cells comprise predominantly effector memory CD4 and CD8 T cells and CD8 Trm. PBMCs and BALFMCs isolated from patients with COVID-19 admitted to the ICU were measured using spectral flow cytometry (n=17). T cells were phenotyped (see online supplemental table 3 for all subsets) using CD27, CD28, CCR7 and CD45RA and CD95 in naïve (CD45RA+CD27+CD28+CD95−), stem cell-like memory (SCM; CD45RA+CD27+CD28+CD95+), effector memory-1 (EM1) (CD45RA−CD27+CD28+CCR7−), EM2 (CD45RA−CD27−CD28+CCR7+), EM3 (CD45RA−CD27−CD28+CCR7−), EM4 (CD45RA−CD27−CD28−CCR7−), effector memory Ra+ (TEMRA; CD45RA−CD27+CD28+CCR7−), central memory (CM; CD45RA−CD27+CD28+CCR7+), tissue-resident memory (Trm; CD103+CD28−; only for BALFMCs) and regulatory T cells (Treg; CD25+CD127−; only for CD4 T cells) (A, F). Activation (ie, HLA-DR+CD38+) is presented for different CD4 and CD8 T cell subsets (only for populations with >250 events) (B, F). Representation of PD-1 expression on different T cells subsets (C, G) in PBMC and BALFMC with concomitant quantification of total PD-1 expression (D, H,). Levels of IL-4 (I), IL17-a (J), granzyme B (K), IL-2 (L), IL-7 (M), IL-10 (N) and soluble PD-L1 (O) are presented in plasma and BALF. Box plots represent median±IQR. anti-N, anti-nucleacapsid; anti-RBD, anti-receptor binding domain of spike protein; BALF, bronchoalveolar lavage fluid; DN, double negative; ICU, intensive care unit; PBMC, peripheral blood mononuclear cells; PD-1, programmad death-1; PD-L1, programmed death-ligand 1. Statistical significance was tested with multiple testing correction using Kruskal-Wallis (A, B, E, F: control vs patient PBMC), Friedmans test (A, B, E, F: patient PBMC vs BALFMC), Wilcoxon signed-rank test (D, H, I–O: COVID-19 plasma vs BALF) or Mann-Whitney U test (I–O: healthy vs COVID-19). *p<0.05, **p<0.01, ***p<0.001, ****p<0.0001.
Correlation cell populations bronchoalveolar lavage with peripheral circulation
Lymphopenia is a frequently reported phenomenon in COVID-19, which may either be caused by massive T cell migration into the lungs or activation-induced apoptosis.3 6 18 If lymphopenia would be caused by massive migration of a specific T cell subset, relative T cell numbers and CD4/CD8 ratios in PBMCs should inversely correlated with BALFMCs. However, relative T cell numbers in blood and BALF did not show any correlation (rho=−0.01, p=0.96), while CD4/CD8 ratios correlated significantly between blood and BALF (rho=0.65, p=0.0071) (figure 3A). CD4/CD8 ratios were lower in BALF, which shows a relative higher abundance of CD8 T cells in BALF. To gain insight in immune cell migration and the peripheral immune system versus pulmonary, PBMC subsets were correlated to BALFMC subsets (figure 3B). When comparing PBMCs to BALFMCs, the activation status of peripheral CM CD4 T cells correlated positively with conventional T cells and negatively with Mo/MQs in BALF (figure 3C), which may be caused by activation induced proliferation of CM CD4 T and subsequent migration, causing higher T cell numbers in BALF (and consequently other cells will be less abundant). Furthermore, peripheral Tregs negatively correlated with DN T cells in BALF, which may indicate impaired induction of Fas-mediated T cells apoptosis by Tregs what has been shown to cause accumulation of DN T cells.25

Correlations between cell populations in PBMCs and BALFMCs. The bronchoalveolar and systemic immune response were compared by correlating αβ-T cells and CD4/CD8 in PBMC and BALFMC (A) and comparing plasma and BALF cytokine levels (B). Cytokines are ordered in ‘implicated in COVID-19 cytokine storm’ (IL-6, CXCL10/IP-10 and CCL2/MCP-1) and ‘anti-viral responses’ (IFN-α, IFN-β, anti-RBD IgG and anti-N IgG) with box plots displaying median±IQR. All PBMC populations obtained using manual gating were correlated to BALFMC populations using spearman correlation. All significant correlations with a Rho >0.6 are depicted in a circus plot wherein red depicts a positive correlation and blue depicts a negative correlation and line thickness resembles the goodness-of-fit (ie, Rho) (C). The four populations with the strongest correlation are presented in dot plots (D). αβ, αβ T cell receptor; ƴδ, ƴδ T cell receptor; Alt, alternative; Alv, alveolar; BALFMC, bronchoalveolar lavage fluid mononuclear cells; cDC, conventional DC; Clas, classical; CM, central memory T cells; DC, dendritic cell; DN, double negative; EM, effector memory T cells; ILC, innate lymphoid cells; Int, intermediate; Mo/MQ, monocyte-like macrophage; MQ, macrophage; NK, natural killer cells; PBMC, peripheral blood mononuclear cells; pDC, plasmacytoid DC; SCM, stem cell-like memory T cells; TEMRA, RA+ effector memory T cells; Treg, regulatory T cells; Trm, tissue-resident memory T cell.
Influence of duration of ICU stay on bronchoalveolar and systemic immune responses
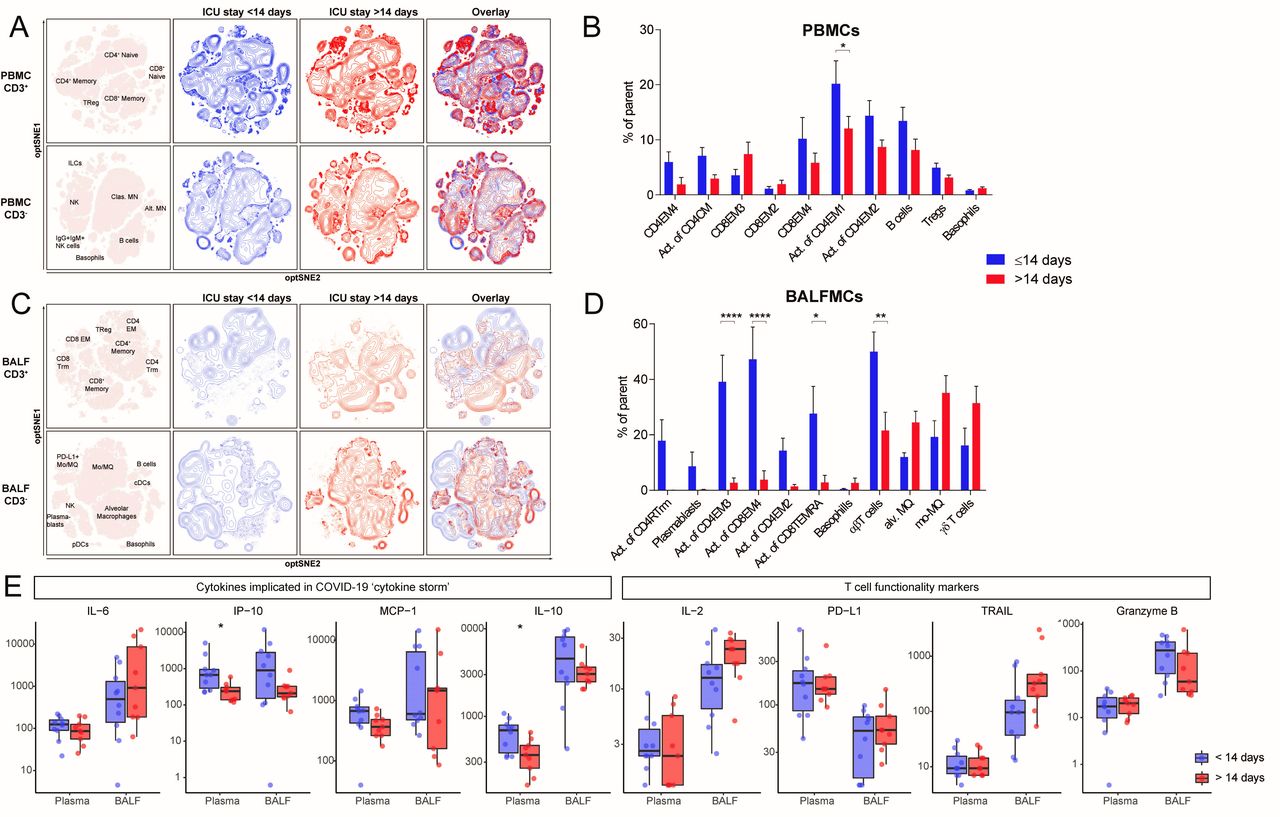
To investigate the change in cellular composition of the immune system during prolonged ICU stay, samples were grouped according to ICU stay with a cut-off of 14 days (<14 days: n=9, 9 days (8–12.5); >14 days: n=9, 18 days (17–22.5); median (IQR)) (see online supplemental table 4 for patient characteristics). We included only one sample per patient in each group (see online supplemental figure 3B). Unsupervised clusters clearly showed a significant effect of ICU stay on immune cell composition, especially in T cells in BALF (figure 4). The differences in BALF T cells mainly resulted from lower activation of multiple T cell subsets in the ICU stay >14 days group: CD4 EM2 (1.4±0.7% vs 14.3±4.5% of CD4 EM2), CD4 EM3 (2.7±1.8% vs 39.1±9.6% of CD4 EM3), CD8 EM4 (3.8±3.2% vs 47.3±11.6% of CD8 EM4), CD8 TEMRA (2.8±2.6% vs 27.7±9.8% of CD8 TEMRA) (figure 4D). Furthermore, conventional (ie, αβ) T cells were less abundant (50.0±7.1% vs 21.5±6.6%), whereas the frequencies of alveolar macrophages, Mo/MQs and ƴδ T cells tended to be higher after prolonged ICU stay. PBMCs isolated after >14 days ICU stay also exhibited an overall trend towards lower frequencies of activated T cell subsets, but the differences were less pronounced than in BALFMCs. Plasma levels of CXCL10/IP-10 were lower with extended ICU stay, while in BALF ICU stay did not significantly affect any cytokine levels (figure 4E). IL-6, CCL-2/MCP-1, IL-2, PD-L1 and granzyme B remained stable during extended ICU stay.

Reduced T cell activation in both BALF and peripheral blood of patients with an ICU stay of >14 days. samples were stratified based on moment of sampling in ≤14 days (n=8) and >14 days (n=9). Only one sample per patient was included per group. Immune cell population from PBMCs (A) and BALFMCs (C) were clustered using omiq unsupervised clustering and presented as optSNE plots. The ten populations with biggest relative differences (sorted from left to right) are depicted for PBMC (B) and BALFMC (D). cytokine levels in plasma and BALF, as measured using Luminex, were compared ≤14 days and >14 days of ICU stay wherein box plots represent median ±interquartile range (E). Alv, alveolar; BALFMC, bronchoalveolar lavage fluid mononuclear cells; cDC, conventional DC; CM, central memory T cells; DC, dendritic cell; EM, effector memory T cells; ICU, intensive care unit; ILC, innate lymphoid cells; MN, monocyte; Mo/MQ, monocyte-like macrophage; NK, natural killer cells; PBMC, peripheral blood mononuclear cells; pDC, plasmacytoid DC; TEMRA, RA+ effoctor memory T cells; Treg, regulatory T cells; Trm, tissue-resident memory T cell. Statistical significance was tested with multiple testing correction using two-way analysis of variance (ANOVA) (B, D) or Mann-Whitney U test (E). *p<0.05, **p<0.01, ***p<0.001, ****p<0.0001.
Association of fatal COVID-19 with bronchoalveolar and systemic immune responses
To dissect which immunological profile associates with mortality, patients were stratified according to survival (13 survivors and 4 non-survivors). Peripheral lymphocyte counts did not differ between survivors (0.85 (0.74, 1.31)×106/L) and non-survivors (1.53 (0.69, 2.77)×106/L, p=0.40) (see online supplemental table 5 for additional patient characteristics). Samples were obtained 15.5 (12.5–17) days or 16 (9–22) days (median (IQR)) after ICU admission, respectively (see online supplemental figure 3C). Clustering surviving and deceased patients separately revealed large differences in both CD3− and CD3+ unsupervised clusters of BALFMCs (figure 5A,D). Activation of different T cell subsets in blood was increased in non-surviving patients as compared with surviving patients: CD4 EM4 (32.7±4.3% vs 16.1±2.9% of CD4 EM4), CD4 EM3 (35.3±6.0% vs 18.2±2.5% of CD4 EM3) and CD8 TEMRA (31.2±6.9% vs 17.3±2.6% of CD8 TEMRA) (figure 5B). In contrast, activation of different T cells subsets in BALF tended to be reduced in non-surviving patients as compared with surviving patients: CD8 TEMRA (2.9±2.8% of CD8 TEMRA vs 17.3±7.6% of CD8 TEMRA), CD4 Trm (3.5±3.5% vs 11.8±6.0% of CD4 Trm), CD8 EM4 (12.3±11.7% vs 27.3±10.3% in CD8 EM4), and CD4 EM3 (12.2±10.9% vs 23.3±8.3% of CD4 EM3) (figure 5D). Although hampered by low sample size, the frequency of plasmablasts and ƴδ T cells tended to be reduced in BALF of fatal cases as compared with surviving cases, while basophils were high in some fatal cases (5.1±3.9% vs 0.6±0.1%), which may be interesting to study further given the strong IgA response,26 and profound complement activation in COVID-19,25 both capable of stimulating histamine release.27 28 The levels IL-6, CXCL10/IP-10, CCL2/MCP-1, anti-SARS-CoV-2 IgG antibodies, granzyme B, IL-2 and TRAIL were not significantly different in both plasma and BALF of non-surviving compared with surviving patients.

Contrasting patterns of T cell activation in BALF and peripheral blood between survivors and non-survivors. Samples were stratified based on ICU mortality (n=4 non-survivors (blue) vs n=13 survivors (red)). Only one samples per patient was included in each group N. (A, C) Immune cell population from PBMCs (A) and BALFMCs (C) were clustered using omiq unsupervised clustering and presented as optSNE plots. (B, D) The 10 populations with biggest relative differences (sorted from left to right) are depicted for PBMC (B) and BALFMC (D). Cytokine and antibody levels in plasma and BALF, as measured using Luminex and ELISA, respectively, were compared in fatal and non-fatal COVID-19 cases and presented in box plots as median±IQR (E) BALFMC, bronchoalveolar lavage fluid mononuclear cells; cDC, conventional DC; CM, central memory T cells; DC, dendritic cell; EM, effector memory T cells; ICU, intensive care unit; ILC, innate lymphoid cells; MN, monocyte; Mo/MQ, monocyte-like macrophage; NK, natural killer cells; PBMC, peripheral blood mononuclear cells; pDC, plasmacytoid DC; TEMRA, RA+ effoctor memory T cells; Treg, regulatory T cells; Trm, tissue-resident memory T cell. Statistical significance was tested with multiple testing correction using two-way analysis of variance (ANOVA) (B, D) or Mann-Whitney U test (E). *p<0.05, **p<0.01, ***p<0.001, ****p<0.0001.
Discussion
Although a tremendous global effort of the scientific community has greatly improved our understanding of COVID-19, the exact pathophysiology remains to be unravelled. Some studies have reported overactivation of the immune system, whereas others have shown T cell exhaustion, dysfunction and/or apoptosis.3 6 7 29 Importantly, however, these earlier investigations were restricted to immune responses in blood, while SARS-CoV-2 infections are located in the lungs. The present study shows a highly diverse immune response in patients with COVID-19 admitted to the ICU, with significant differences between immune cells isolated from blood and BALF. The strongest correlation between PBMCs and BALFMCs was the activation status of peripheral CM CD4 T cells, which positively correlated with conventional T cells and negatively with monocyte-like macrophages in BALF. In patients with COVID-19, proportions of macrophages and T cells were highly variable in BALF. Although blood T cells were skewed to effector memory phenotypes in COVID-19 compared with controls, as previously reported,30 31 this skewing to effector memory phenotypes was much more pronounced in BALF T cells, which also had a significantly higher PD-1 expression. These results indicate that obtaining cells from the lungs is pivotal in order to fully understand COVID-19 pathophysiology.
Despite previous reports of significant lymphopenia in patients with COVID-19 on admission,3 6 18 32 lymphopenia of ICU-admitted patients with COVID-19 was only mild in our study, which may be due to late sampling, as lymphocyte numbers are reported to recover in a subset of patients.32 Severe lymphopenia is hypothesised to be caused by activation-induced cell death or massive migration of T cells to the site of infection.6 Here we show that relative peripheral T cell numbers do not inversely correlate with relative T cell numbers in BALF, which renders massive migration of T cells into the lungs an unlikely explanation for lymphopenia in prolonged critically ill patients with COVID-19. On the other hand, Fas expression, which has previously been correlated to the extent of peripheral lymphopenia,5 was high on all T cells in blood, except naïve T cells, suggesting apoptosis is a more likely cause of T cell lymphopenia in COVID-19. In line with previous reports,6 7 31 33 PD-1 expression on activated peripheral blood T cells was high in our study, but PD-1 expression was even higher in BALFMCs, reaching over 95% positivity in most samples. This, combined with a lower Fas expression, may indicate that T cells in the bronchoalveolar space are more exhausted than those in blood but less vulnerable to Fas-mediated apoptosis, or simply reflects recently activated polyfunctional antigen-specific T cells, which has been shown to also display high PD-1 expression.33
To induce a functional adaptive immune response targeting COVID-19 in patients with mild disease, a balanced type I IFN response—that peaks initially and then gradually decreases—has been shown to be important. In patients with severe disease however, type I IFNs were either absent or persistently high for multiple weeks after disease onset.34–36 While we also observed persistently high plasma levels of type I IFNs, BALF levels were all below detection limit. Reduced HLA-DR expression on circulating monocytes, as previously reported,34 36 further hampers the ability to mount an effective adaptive immune response and has been associated with immune suppression.37 Although we also observed reduced HLA-DR expression on circulating monocytes, and also DCs, in patients with COVID-19, this reduced expression was not observed in BALFMCs, suggesting these cells are perfectly capable of presenting antigens. Another potential mechanism to eliminate virus infected cells is to induce apoptosis via TRAIL-mediated signalling.38 39 TRAIL levels were significantly elevated in BALF of patients with COVID-19, but were reduced in plasma. As overactive TRAIL signalling can lead to chronic lung diseases38 39 and induction of CCL20—a chemokine that is highly expressed in the lungs of mechanically ventilated patients with COVID-19 and may be important in T cell migration to the lungs40—it would be worthwhile to investigate whether distorted TRAIL levels drive COVID-19 pathophysiology.
CD8 Trm T cells were recently associated with moderate disease, while the inflammatory Mo/MQs were more abundant in critical cases.13 In the present study, however, we did not observe a positive correlation of CD8 Trm with survival. If anything, Mo/MQs were lower in fatal COVID-19. There are multiple possible explanations for these diverging observations: used techniques, low sample sizes, different clinical comparisons (ie, disease severity in all patients with COVID-19 vs mortality in critical cases only), and time of sampling relative to disease onset (4–10 days after hospital admission13 compared with 1–30 days after ICU admission).
During COVID-19 a significant differentiation of peripheral blood CD4 and CD8 T cells into an effector memory phenotype has been reported,30 31 but little is known about T cell phenotypes at the primary site of infection, the lungs. The present study shows that differentiation in BALF is even more skewed, with a striking 89.6% of CD4 and 96.1% of CD8 T cells in BALF having an effector memory phenotype. T cell activation in both blood and BALF diminished with prolonged ICU stay (ie, >14 days), which is consistent with suggestions of exhausted T cells in COVID-19. Remarkably however, while activation of T cells in the lungs seemed reduced in fatal COVID-19, peripheral T cell activation was increased, including activation of EM3 T cells. These cells have a high cytolytic activity with corresponding high granzyme B production,41 and granzyme B was increased in both BALF and plasma when compared with uninfected controls, which may drive inflammation-induced tissue damage as observed in COVID-19. T cell activation in surviving patients however, seemed located predominantly in the lungs with limited peripheral activation. The contrast in T cell activation in surviving versus non-surviving patients could theoretically result from a systemic activation of T cells, or a failure of activated T cells to migrate into the lungs in fatal COVID-19 cases, but this requires further investigation.
By investigating inflammatory markers as well as mononuclear immune cells in both peripheral blood and the lungs, our study provides an extensive overview of the immune response in late-stage critically patients with COVID-19. More importantly, this in-depth comparison of the peripheral blood and pulmonary compartments revealed stark differences in immune responses (eg, T cell activation or monocyte HLA-DR expression) that must be taken into account when using peripheral blood cells as a surrogate for the entire COVID-19 immune response. Moreover, while previous investigations have reported on a so-called systemic cytokine-storm in COVID-19,3 5 6 our study shows that the BALF levels of many cytokines are higher than their plasma levels (in spite of the dilution caused by the BAL procedure), indicating that a local rather than systemic cytokine storm is at play during late-stage COVID-19, which is in line with one of the few other studies that investigated lung material from patients with COVID-19.42 The present study is limited by its relatively low sample size—due to a rapidly declining incidence of SARS-CoV-2 infections after governmental measures were introduced—and variation in time of sampling, and due to potential confounding factors these limitations necessitate caution when drawing conclusions.
In conclusion, immune composition in the lungs of patients with COVID-19 admitted to the ICU was substantially different than in peripheral blood. BALF mainly comprised macrophages and T cells, with high percentages of inflammatory monocyte-like macrophage and ƴδ T cells especially after prolonged ICU stay. Both CD4 and CD8 T cells expressed higher levels of PD-1 in BALF as compared with PBMCs. Surprisingly, total CD8 T cell activation was lower in BALF than in peripheral blood. Reduced CD4 and CD8 T cell activation associated with extended ICU stay, especially in BALF, while peripheral activation of T cells (CD4 EM3 and EM4 as well as CD8 TEMRA) associated with mortality.
Data availability statement
The data that support the findings of this study are available from the corresponding author, AS, upon reasonable request.
Ethics statements
Ethics approval
Per clinical protocol obtained left over biological samples were stored in the anonymized research Amsterdam UMC COVID-19 biobank for which study procedure was approved by the Review Committee Biobank of the Amsterdam UMC (approval number: 2020-065). Controls for BALF were recruited in explorative RILCA and RILCO (Dutch ethical committee study numbers: NL48912.018.14 & NL53354.018.15) trials and control PBMCs were recruited in the ELDER-BIOME project (ClinicalTrials.gov identifier: NCT02928367). These studies are in accordance with the declaration of Helsinki and approved by ethical committees.
Acknowledgments
The authors would like to specifically thank Dorien Wouter, Selime Avci and Mariska van der Wal for their help with isolating samples and Regina de Beer, Barbara Dierdorp, Tamara Dekker and Theo Rispens for helping with measurements of soluble mediator.
Supplementary materials
Supplementary Data
This web only file has been produced by the BMJ Publishing Group from an electronic file supplied by the author(s) and has not been edited for content.
Supplementary Data
This web only file has been produced by the BMJ Publishing Group from an electronic file supplied by the author(s) and has not been edited for content.
Footnotes
TvdP and JJGV contributed equally.
Collaborators On behalf of the ArtDECO consortium: Esther J. Nossent, Janwillem Duitman, Anno Saris, Heder De Vries, Lilian J. Meijboom, Lieuwe D. Bos, Siebe G. Blok, Alex R. Schuurman, Tom D.Y. Reijnders, F. Hugenholtz, Juan J. Garcia Vallejo, Hetty Bontkes, Alexander P.J. Vlaar, Joost Wiersinga, René Lutter, Tom van der Poll, Harm Jan Bogaard, Leo Heunks and the Amsterdam UMC COVID study group (S. de Bruin, A.R. Schuurman, R. Koing, M.A. van Agtmael, A.G. Algera, F.E.H.P. van Baarle, D.J.C. Bax, M. Beudel, H J Bogaard, M. Bomers, L.D.J. Bos, M. Botta, J. de Brabander, G.J. de Bree, M. Bugiani, E.B. Bulle, O. Chouchane, A.P.M. Cloherty, P.E. Elbers, L.M. Fleuren, S.E. Geerlings, B.F. Geerts, T.B.H. Geijtenbeek, A.R.J. Girbes, A. Goorhuis, M.P. Grobusch, F.M.J. Hafkamp, L.A. Hagens, J. Hamann, V. C. Harris, R. Hemke, S.M. Hermans, L.M.A. Heunks, M.W. Hollmann, J. Horn, J.W. Hovius, M.D. de Jong, N. van Mourik, J.F Nellen, F. Paulus,T.D.Y. Reijnders, E. Peters, T. van der Poll, B. preckel, J.M. Prins, s.j.raasveld, M. Schinkel, M.J. Schultz, K. Sigaloff, M.R. Smit, C. Stijnis, W. Stilma, C.E. Teunissen, P. Thoral, A.M. Tsonas, M. van der Valk, d.p.veelo, H. de Vries, M. van Vugt, D. Wouters, A.H. Zwinderman, M.C. Brouwer, W.J. Wiersinga, A.P.J. Vlaar, D. van de Beek). Funders were not in any way involved in study design or writing the manuscript.
Contributors AS, EN, LH, HB and TvdP designed research and included patients SB collected and analysed patient information. AS and RL isolated samples and AS, JD, JV, SvA, LP performed experiments. AS, JV, SvA, JJGV performed spectral flow analysis. AS, TDYR and ARS analysed inflammatory markers. AS wrote the manuscript. TDYR, EN, LP, ARS, SvA, HB, TvdP and JJGV critically reviewed the manuscript. All authors reviewed and approved the manuscript.
Funding AS and TDYR were funded in part by NACTAR (grant number 16447) of the Dutch research council (NWO) and JWD was supported by a personal grant of the NWO (VENI grant 016.186.046).
Competing interests None declared.
Provenance and peer review Not commissioned; externally peer reviewed.