Article Text

Abstract
Background It is current practice to use a single diagnostic sleep study in the diagnostic workup of obstructive sleep apnoea (OSA). However, a relevant night-to-night variability (NtNV) of respiratory events has been reported.
Methods We evaluated the NtNV of respiratory events in adults with suspected or already diagnosed OSA who underwent more than one diagnostic sleep study. Data sources were PubMed, Cochrane and Embase up to 23 January 2019. Random-effects models were used for evidence synthesis. For moderator analysis, mixed-effects regression analysis was performed. The study was registered with PROSPERO (CRD42019135277).
Results Of 2143 identified papers, 24 studies, comprising 3250 participants, were included. The mean Apnoea-Hypopnoea Index (AHI) difference between the first and second night was −1.70/hour (95% CI −3.61 to 0.02). REM time differences (first to second night) were significantly positive associated with differences in mean AHI (β coefficient 0.262 (95% CI 0.096 to 0.428). On average, 41% (95% CI 27% to 57%) of all participants showed changes of respiratory events >10/hour from night to night. Furthermore, 49% (95% CI 32% to 65%) of participants changed OSA severity class (severity thresholds at 5/hour, 15/hour and 30/hour) at least once in sequential sleep studies. Depending on the diagnostic threshold (5/hour, 10/hour or 15/hour), on average 12% (95% CI 9% to 15%), 12% (95% CI 8% to 19%) and 10% (95% CI 8% to 13%) of patients would have been missed during the first night due to single night testing.
Conclusion While there was no significant difference between mean AHI in two sequential study nights on a group level, there was a remarkable intraindividual NtNV of respiratory events, leading to misdiagnosis and misclassification of patients with suspected OSA.
- sleep apnoea
Statistics from Altmetric.com
Key messages
What is the key question?
Is there evidence for night-to-night variability of respiratory events in patients with obstructive sleep apnoea (OSA)?
What is the bottom line?
Although there is no evidence for a relevant night-to-night variability of respiratory events on a group level, there is a remarkable intraindividual night-to-night variability among OSA patients affecting diagnostic accuracy and treatment decisions.
Why read on?
This is the first comprehensive systematic review and meta-analysis summarising every available evidence about a topic of high clinical relevance in sleep medicine.
Introduction
Obstructive sleep apnoea (OSA) is a common form of sleep-disordered breathing affecting up to 23.4% of middle-aged women and 49.7% of middle-aged men.1 OSA is characterised by recurring episodes of partial or complete collapse of the upper airway during sleep, resulting in intermittent hypoxia, fragmented sleep, fluctuations in blood pressure and increased sympathetic nervous system activity.2
Current guidelines recommend to perform a single-night polysomnography (PSG) or home sleep apnoea testing (HSAT) in uncomplicated patients with clinically suspected OSA.3 The Apnoea-Hypopnoea Index (AHI) provides the number of obstructive respiratory events of the upper airway per hour and is the main sleep study parameter used to diagnose or exclude OSA and to define disease severity. There is a considerable number of studies assessing night-to-night variability (NtNV) of respiratory parameters like AHI,4 Oxygen Desaturation Index (ODI)5 or Respiratory Disturbance Index (RDI).6 While some studies reported only mild NtNV of respiratory events,7 others suggested high variability raising the question whether a single-night sleep study is inaccurate for diagnosis and treatment recommendations.5 There are conflicting data regarding intraindividual variability of respiratory parameters from night to night, which reported missed OSA diagnosis in 0%–55% of patients comparing one versus multiple sleep studies.8–10
Undiagnosed and untreated OSA is associated with daytime sleepiness, decreased quality of life, increased risk for motor vehicle accidents, hypertension and possibly cardiovascular events—particularly stroke.2 11–15 In addition, the costs for diagnostic evaluation for OSA as well as for undiagnosed OSA are substantial,16 making a better understanding of NtNV of respiratory parameters imperative. There is also an increasing number of intervention studies in the field of OSA research which assess the effect of pharmacological or device-based interventions on respiratory parameters.17 The natural course of respiratory parameters from night to night should be considered in the design of interventional studies. However, solid evidence on NtNV is missing.
Several pathomechanisms and clinical predictors of increased NtNV of respiratory parameters have been discussed so far. Numerous studies demonstrated an association between the extent of NtNV of respiratory parameters and the severity of OSA.10 18–21 Sleep position and sleep stage could play an important role, since supine position and rapid eye movement (REM) sleep reduce the effectiveness of compensatory mechanisms to counteract upper airway collapse in OSA.22 While nasal congestion10 and states of increased body fluid23 have been reported to rise NtNV, sex,24 body mass index (BMI),25 and age8 had no influence in previous studies.
We conducted a systematic review and meta-analysis to summarise all available evidence about NtNV of respiratory events in patients with suspected or diagnosed OSA. Our methods also allowed us to explore possible moderators that could have influenced this variability. To our knowledge, this is the first comprehensive review addressing this important topic in sleep medicine.
Methods
Search strategy and selection criteria
We evaluated the NtNV of respiratory events in adults with suspected or already diagnosed OSA who underwent more than one diagnostic sleep study. The studies were identified through a search of PubMed, Cochrane and Embase by a medical data analyst specialised in systematic literature search. We also searched the ClinicalTrials.gov registry. The appendix provides all prespecified search terms used for each electronic database (online supplementary appendix table S1). We included articles in English, German and French. We also hand searched bibliographies of eligible papers to detect literature that might have been missed by the electronic database search (online supplementary appendix table S1). Two independent researchers separately assessed eligibility of the studies (MR and MB).
Supplemental material
Characteristics of the 24 included studies
We included every prospective and retrospective study published before the 23 January 2019 that assessed NtNV of respiratory parameters in OSA if they: were original articles published in a journal; measured and reported variability of respiratory parameters (AHI, ODI or RDI) while off any OSA treatment; used an observational or interventional study design, the latter reporting NtNV of respiratory sleep parameters data of the control arm; provided data derived from PSG, respiratory polygraphy or a validated HSAT device (inclusive pulse oximetry); and provided data of at least two sleep studies. Studies were excluded if they: were case reports; included patients with only self-reported OSA; used non-validated devices to assess NtNV of respiratory sleep parameters; did not use the same diagnostic device within the same trial or reported time spans greater than 6 months between sleep studies. Only study reports on humans aged ≥18 years were considered eligible. We used only data reported in the articles and did not contact the authors for missing information because such data cannot be verified by the readers.
In case of disagreement between the ratings of the independent researchers, consensus was reached by discussion or by a third researcher (MK).
Data analysis
From every eligible study, two investigators (MR and MB) independently extracted all predefined data, using a standardised electronic spreadsheet according to the study protocol. Descriptive statistics were calculated on study level, that is, studies reporting on more than one study arm were entered only once. Publication year was given as range. All other continuous variables (eg, mean BMI or mean age) were reported with mean and SD. The number of patients was given as median and IQR because patient numbers varied considerably between studies. Categorical variables on study level (eg, sex) were presented as numbers and percentages of total.
The outcome measures of this study included the assessment of NtNV of respiratory events reported on a group—or intraindividual level. The meta-analysis of the mean AHI difference between the first and second sleep study in the same participants was the main outcome of this study. A subgroup analysis analysed the differences in AHI values for in-hospital and home sleep studies. In those publications where mean and SD of AHI values were not reported, but instead median and IQR were reported, a formula proposed by Wan et al 26 was used for recalculation of mean and SD. If AHI values were reported in subgroups, the total mean and SD was calculated with weighted means.26 AHI differences between two study nights other than between the first and the second study night were not analysed.
The intraindividual variability was addressed in the secondary outcomes as followed: we performed a meta-analysis of the proportion of patients having changed their OSA severity class, with severity thresholds of 5/hour, 15/hour and 30/hour. If more than two sleep studies were reported, we used the first night as reference to describe the following changes over multiple nights. The analysis was threefold: (1) the proportion of patients with a general change in severity class in any direction was meta-analysed (treat the worst approach). Then, the proportion of patients changing into a (2) less severe OSA class or patients changing into a (3) more severe OSA class was meta-analysed. Furthermore, we meta-analysed the proportion of patients for whom an OSA diagnosis would have been missed in the first sleep study using three different AHI thresholds for OSA diagnosis (≥5/hour, ≥10/hour and ≥15/hour). Additionally, we performed a meta-analysis on the reported proportion of patients with AHI changes higher than 10 between multiple sleep studies.
For the primary outcome assessment, mean differences between first and second night were meta-analysed assuming the correlation between repeated measurements to be 0.5 in the same patients across two nights. This assumption and its effect on the results was addressed in a sensitivity analysis, in which we let the correlation vary between 0.4 and 0.6. Furthermore, a sensitivity analysis was conducted, in which for the primary outcome, the summary estimate was obtained while excluding studies with high risk of bias.
For all binary outcomes, meta-analyses of proportions were calculated by dividing the number of patients with a certain condition by the total number of patients analysed. For pooling, logit transformed proportions were used, with subsequent back-transformation to the original scale. Meta-analyses were carried out if at least three studies reporting on the same outcome could be identified. We used random effects models for all meta-analyses.27
A prespecified list of moderators was evaluated one at a time regarding their effect on the estimated difference between the first and second sleep study with respect to AHI using mixed-effects meta-regression methods.27 The list of moderators included the variables sleep study location, study design, difference in total sleep time from first to second night, difference in total REM time between first and second night, BMI, percentage of female sex, mean age and mean AHI in first night.
The test statistic and the p value of Cochrane’s Q test were reported for all meta-analyses, assessing whether residual heterogeneity was larger than would have been expected based on sampling variability alone. A p<0.05 of the heterogeneity tests suggested that there was evidence for heterogeneous outcomes. In each of the meta-analyses, we calculated Cochrane’s Q test for heterogeneity with the corresponding p value, total heterogeneity over total variability(I2), and total variability over sampling variability(H2). Finally, to address funnel plot asymmetry, a rank correlation test was used, as proposed by Begg and Mazumdar.28
All analyses were carried out with R (R Core Team (2019)), V.3.6.0, and meta-analyses were carried out with the R package metafor.
Bias assessment was performed independently by two authors (TG and ST) using the National Institutes of Health’s study assessment ‘Quality of Observational Cohort and Cross-Sectional Studies’.29 Disagreements in bias assessment between investigators were resolved by discussion and consensus. Reporting of the study was performed according to the Preferred Reporting Items for Systematic Reviews and Meta-Analyses checklist30 and MOOSE (meta-analysis of observational studies in epidemiology)31 guideline (online supplementary appendix table S10 and S11).
Results
The systematic search identified 2142 manuscripts. After deduplication, two independent researchers (MR and MB) assessed 1232 studies for eligibility and ultimately included 24 studies,4–9 19 23 32–47 comprising 3250 participants (2446 analysed), for review and meta-analysis (figure 1). Subsequently, 16 and 19 studies underwent quantitative analysis regarding group mean changes and intra-individual variability of respiratory events from night to night, respectively. Demographic characteristics of included patients and methodological features of included studies are presented in table 1.

Flow diagram of the studies included in the review and meta-analysis. n, number of studies; NtNV, night-to-night variability; OSA, obstructive sleep apnoea; PSG, polysomnography.
While 14 studies were prospective observational studies, eight followed a retrospective observational design and two were randomised controlled trials reporting only data from the control group. The number of participants analysed in the original study ranged from 15 to 1091 patients. On average, participants were mean (SD) 50 years (13.2) old and obese (mean (SD) BMI of 31.2 kg/m2 (3.1)). They presented with increased subjective daytime sleepiness (mean (SD) ESS 11.8 (2.4)) and the majority were men. Further information about the study populations on study level are available in the appendix (online supplementary appendix table S3–S7). In 17 studies, PSG devices were used to assess NtNV and eight studies recorded more than two nights. All sleep study-related information—for example, used recording device, used scoring guidelines and time spans between sleep studies—are available in the online supplementary appendix table S8.
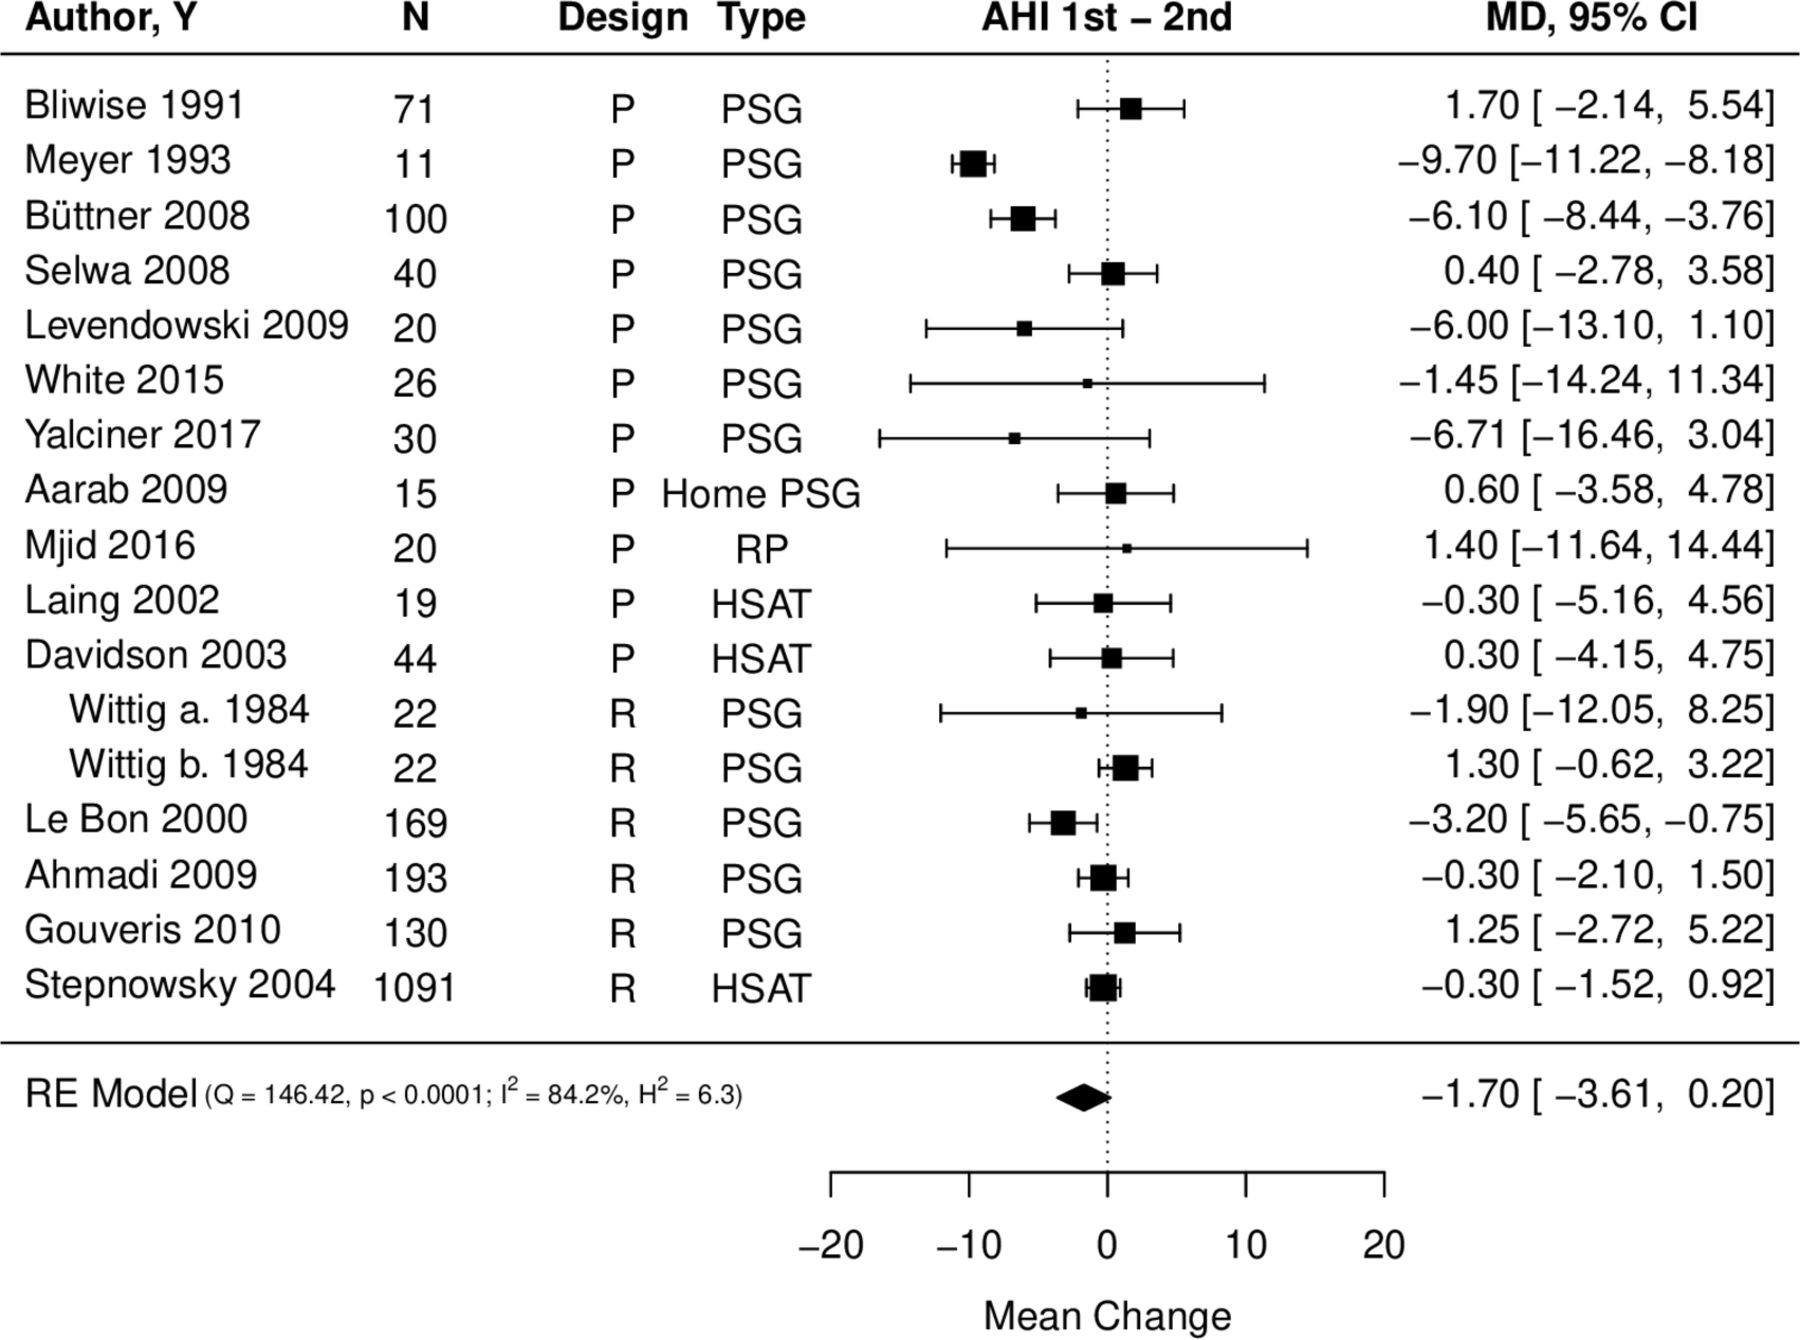
Sixteen studies reported data of mean AHI in two sleep studies.4 6 8 9 19 23 33 35 38 39 41–43 45–47 On average, AHI values were lower in the first night as compared with the second night with an estimated mean change of −1.70/hour (95% CI −3.61 to 0.20) (figure 2). There was no evidence that this effect was different from zero. Heterogeneity was large in this meta-analysis, as indicated by a large I2 value (84.2%) and also by a small p value in the Cochrane’s Q test (p<0.001). The assumed correlation between the first and the second night in the same patients was 0.5 for this analysis. In a sensitivity analysis, the correlation was allowed to vary between 0.4 and 0.6, to assess whether the results would be robust to changes in the assumed correlation. The results were −1.73/hour (95% CI −3.67 to 0.22) for an assumed correlation of 0.4 and −1.68/hour (95% CI −3.54 to 0.18) for an assumed correlation of 0.6. Therefore, we conclude that the results can be considered robust. The risk of bias assessment resulted in three studies with high risk of bias. For the summary estimate of the primary outcome, two of these studies were originally included. The sensitivity analysis of the summary estimate without these two studies resulted in an estimate of −1.78, with 95% CI −3.89 to 0.34, indicating robustness of the results (online supplementary appendix figure S1).

Forest plot of mean AHI change between the first and the second night. Kendall’s τ=−0.265, p=0.151. AHI, Apnoea-Hypopnoea Index; HSAT, home sleep apnoea testing; n, number of analysed patients; PSG, polysomnography; p, prospective study design; Q, Cochrane’s Q test; R, retrospective study design; RE, random-effect; RP, respiratory polygraphy; Wittig a., part of the study by Wittig et al 41 referring to a subgroup of patients showing more than 100 apnoeas; Wittig b., part of the study by Wittig et al 41 referring to a subgroup of patients showing less than 100 apnoeas; Y, year.
The subgroup analysis between different sleep study locations (ie, in hospital vs at-home) revealed that mean AHI differences between two sleep studies were greater in the in-hospital setting (mean change −2.33 (95% CI −4.77 to 0.12) than in the at-home setting where it was −0.20 (95% CI −1.19 to 0.79) (online supplementary appendix figure S2 and S3).
Of all moderators analysed, only for REM sleep differences (1st–2nd night), there was evidence for an association with mean AHI differences between two nights (β coefficient 0.262 (95% CI 0.096 to 0.428)). Even though the sleep study location in the hospital showed a clinically relevant negative association with mean AHI differences (β coefficient −2.386 (95% CI −6.671 to 1.900)), statistical significance was not reached. Since only a limited number of studies reported data on sleep position and total sleep time, these possible moderators were not included in moderator analysis. Table 2 lists the results of all evaluated moderators.
Moderator analysis
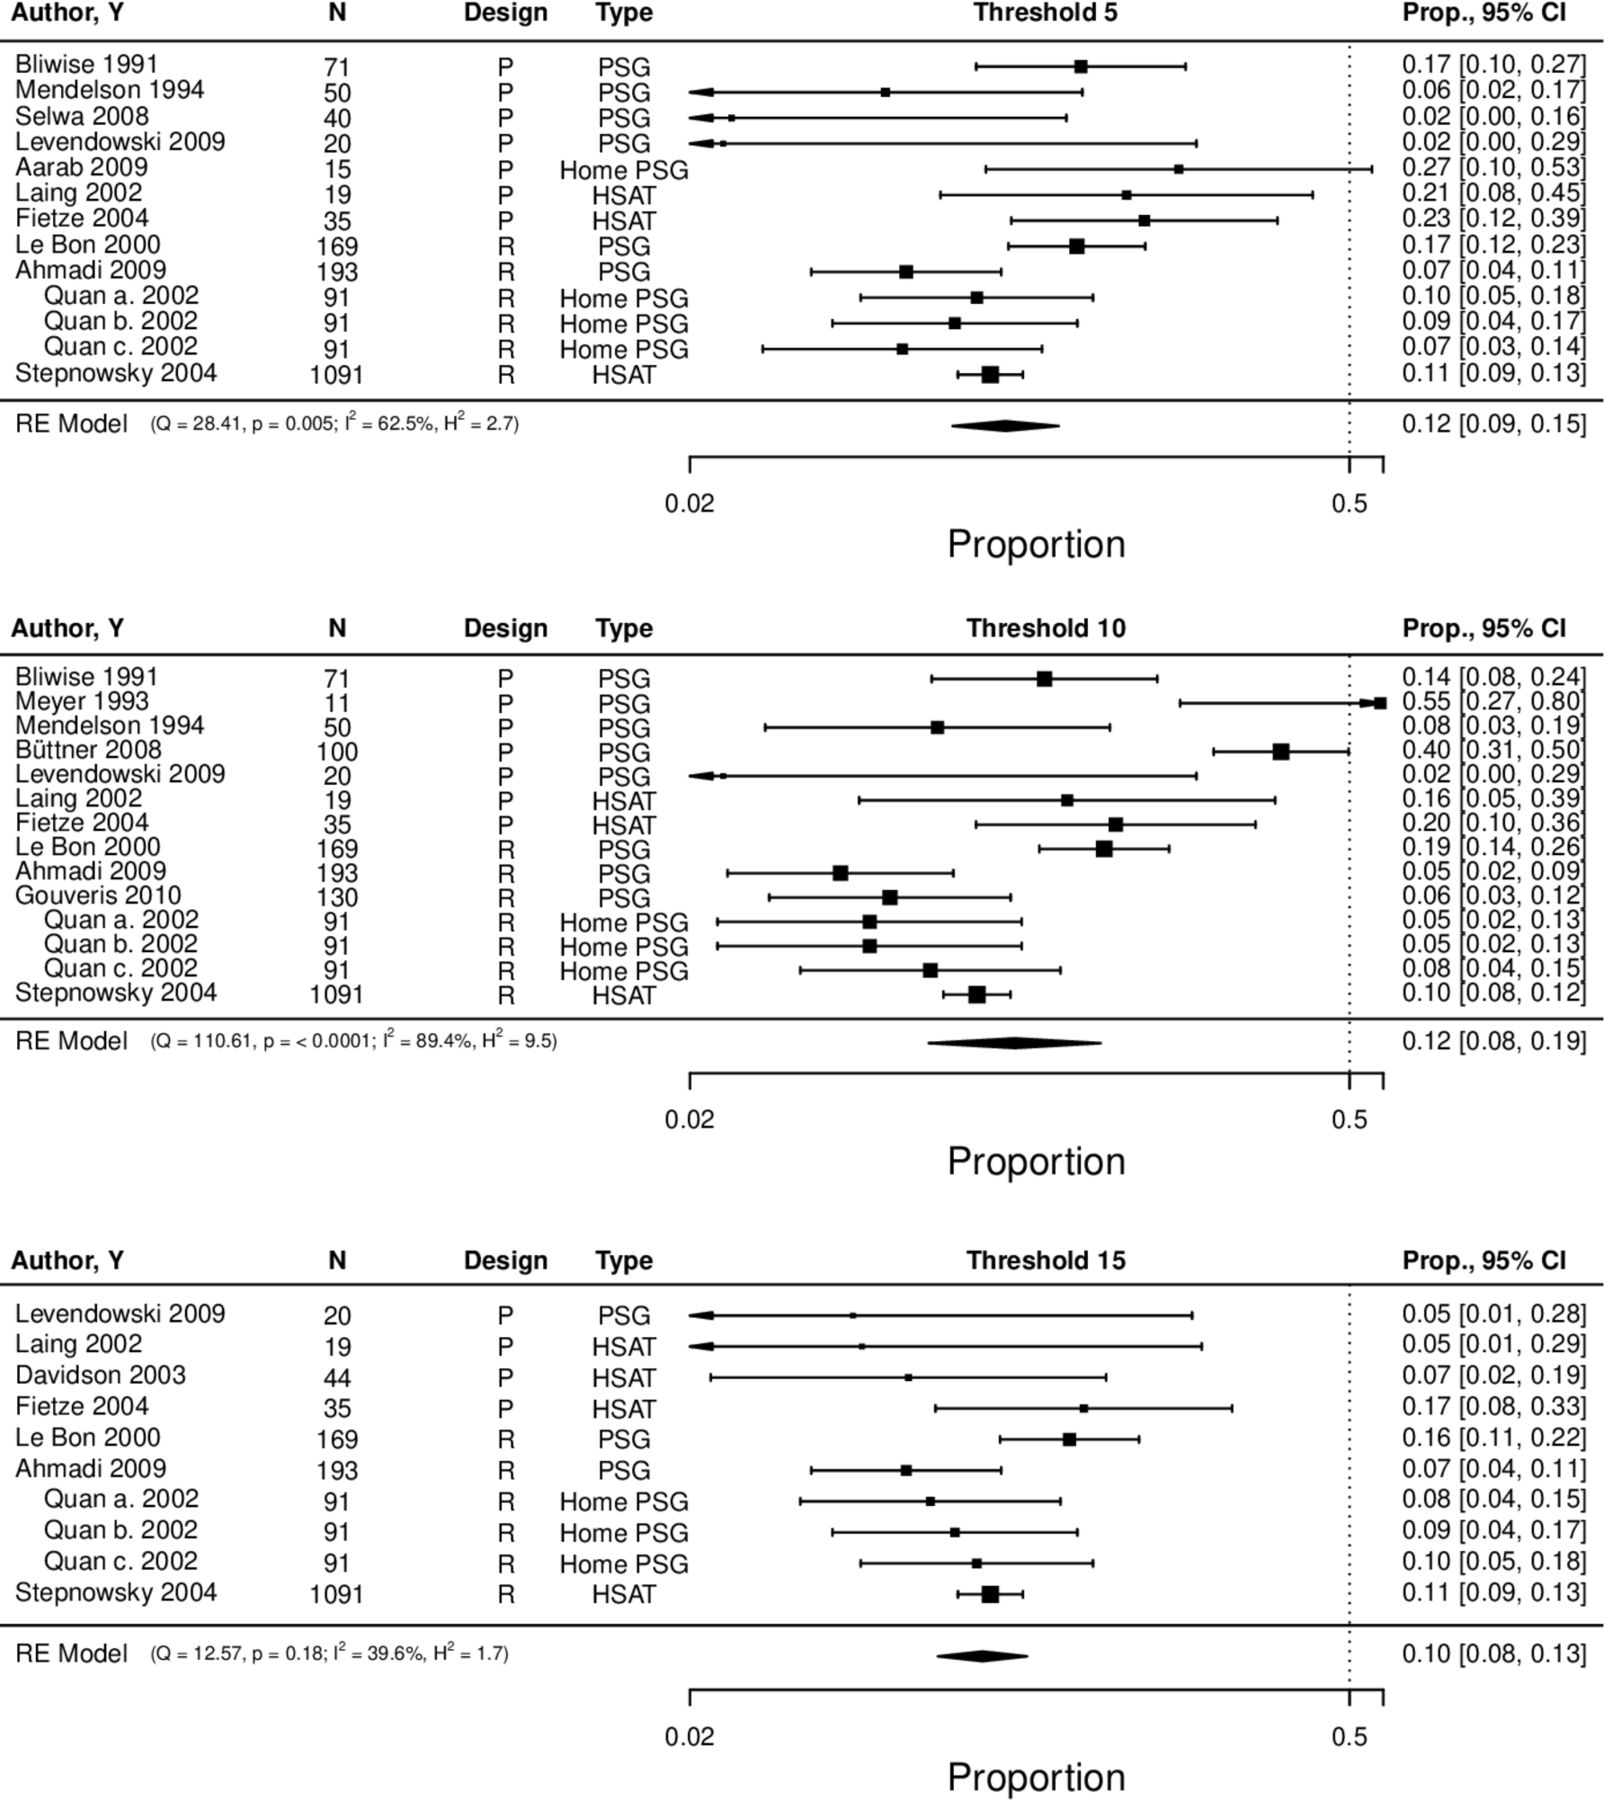
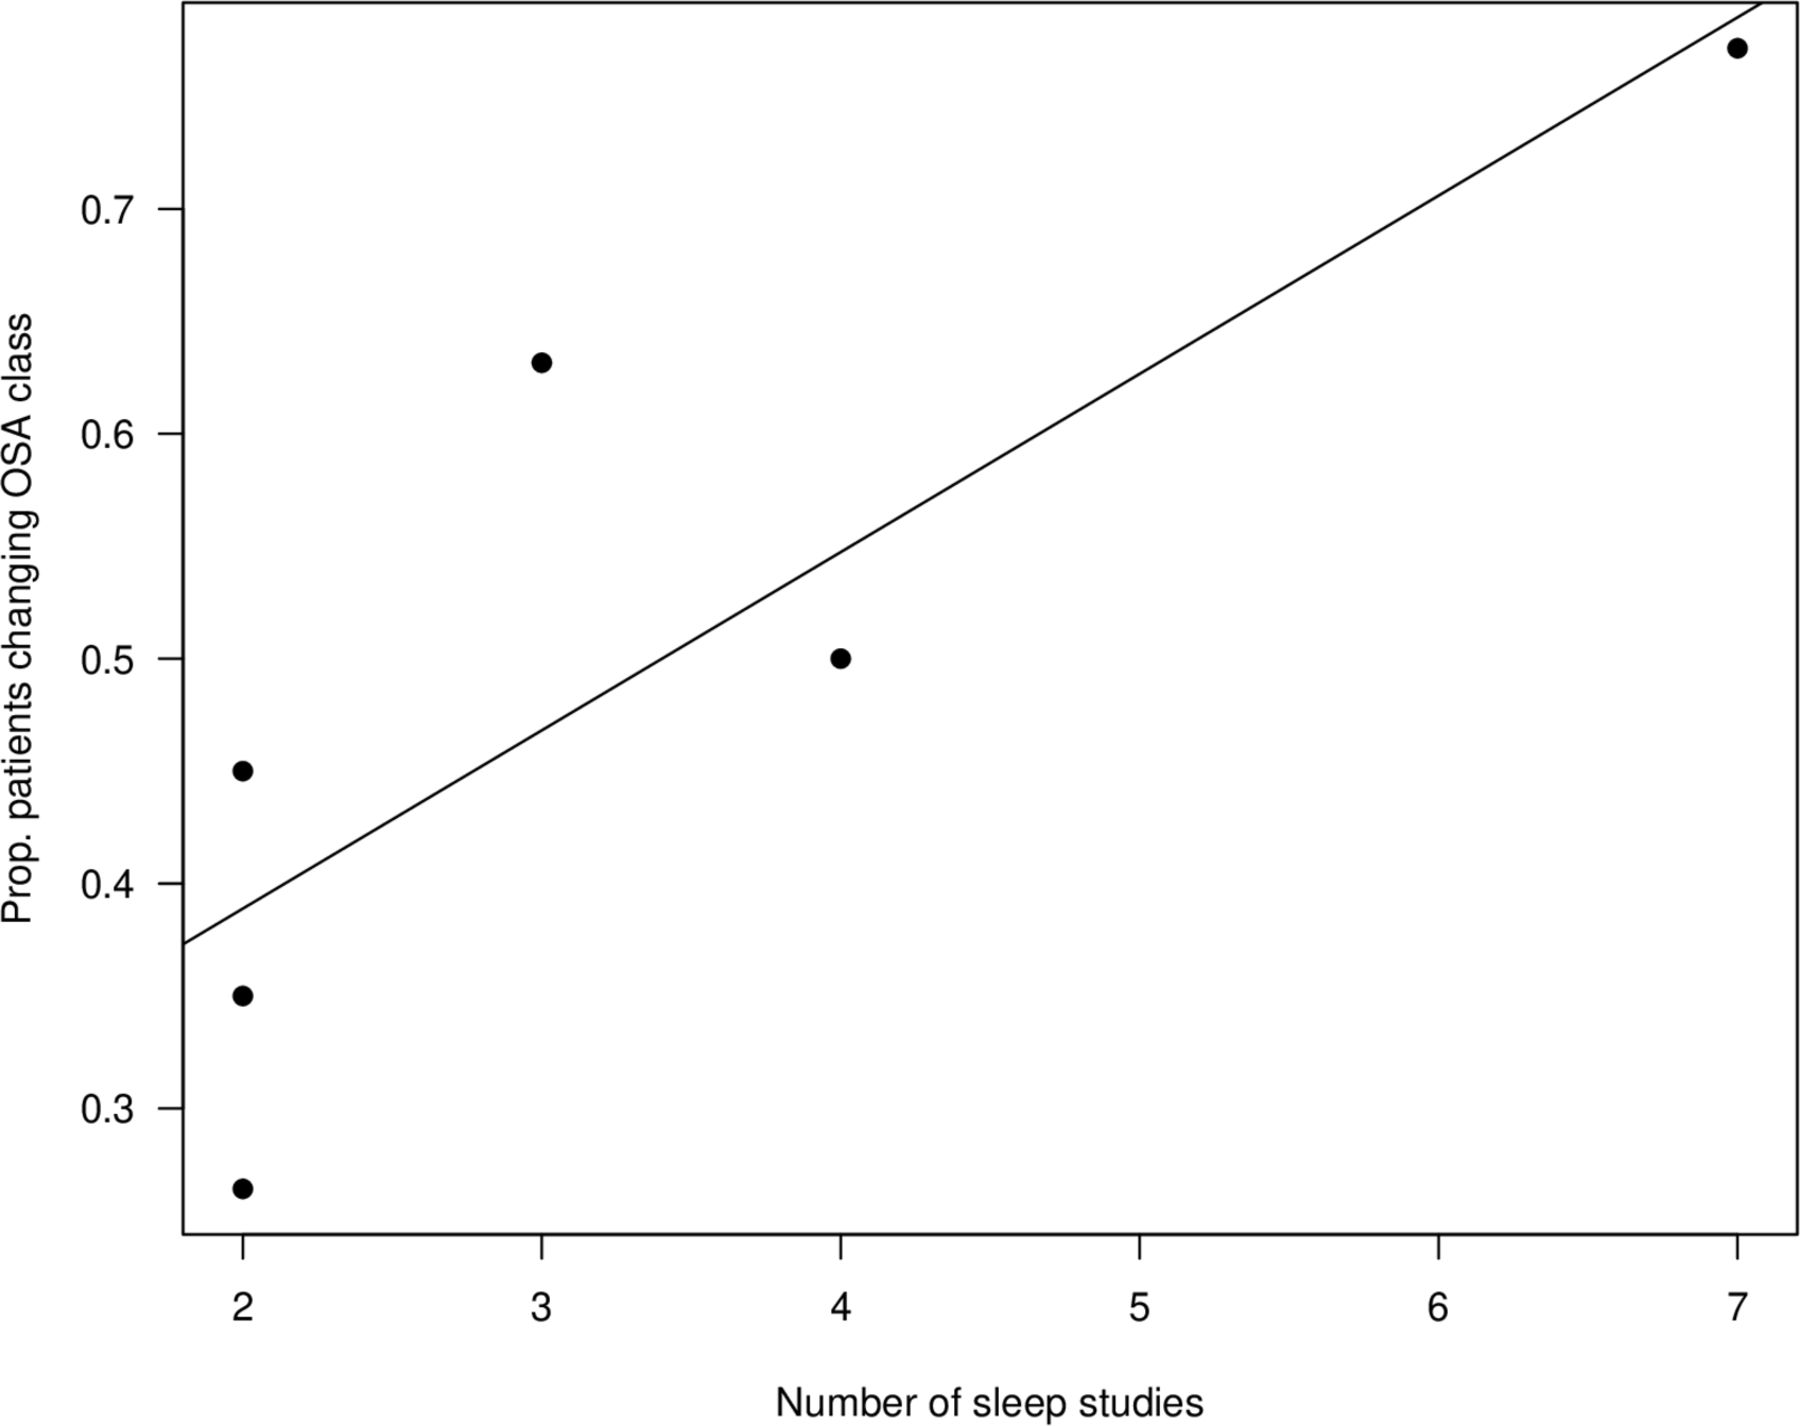
Nineteen studies reported on intraindividual NtNV of respiratory events in multiple study nights4–9 23 32–39 42 43 46 47: 13 studies reported an proportion of 41% (95% CI 27% to 57%) of patients presenting changes of respiratory events (AHI, ODI or RDI) greater than 10/hour from night to night (figure 3). Six studies reported the proportions of patients that changed OSA severity class (thresholds at 5/hour, 15 hours and 30/hour) during multiple nights of apnoea testing. On average, 49% (95% CI 32% to 65%) of the patients changed severity class at least once (online supplementary appendix figure S4). As presented in figure 4, studies using multiple sleep nights presented higher proportions of patients changing severity class. In addition, six studies provided data about the direction of severity class change—that is, towards an improvement or a worsening—in sequential nights (online supplementary appendix figure S5). While 15% (95% CI 12% to 20%) of participants changed into a less severe class, 18% (95% CI 13% to 26%) changed into a more severe OSA class after the first study night. There are several studies reporting on OSA diagnoses that would have been missed in the first sleep study using different thresholds (5/hour, 10/hour and 15/hour) (figure 5). Overall, across all thresholds the proportions were between 10% and 12%, roughly below 20% with their upper confidence limits. The studies showed larger heterogeneity for the thresholds of 5/hour and 10/hour when compared with a threshold 15/hour. We found no evidence for funnel plot asymmetry in any of the meta-analyses (all p>0.05).

Forest plot of proportion of patients showing a change of respiratory parameters (AHI, ODI) of more than 10/hour in any direction among sequential measurement nights. Kendall’s τ=0.224, p=0.296. AHI, Apnoea-Hypopnoea Index; HSAT, home sleep apnoea testing n=number of analysed patients; ODI, oxygen desaturation index; PSG, polysomnography; p, prospective study design; Q, Cochrane’s Q test; R, retrospective study design; RE, random effect; RP, respiratory polygraphy; Y, year.

Scatter plot of six studies showing the proportion of patients changing OSA severity class in any direction as a function of the number of measurement nights. OSA, obstructive sleep apnoea.
Forest plot of proportion of patients that would have been missed in the first study night due to single-night testing. AHI 5/hour: Kendall’s τ=−0.180, p=0.435, AHI 10/hour: Kendall’s τ=0.133, p=0.510, AHI 15/hour: Kendall’s τ=−0.200, p=0.484. AHI, Apnoea-Hypopnoea Index; HSAT, home sleep apnoea testing; n, number of analysed patients; PSG, polysomnography; p, prospective study design; Q, Cochrane’s Q test; Quan a., part of the study by Quan et al 6 referring to data obtained with an RDI including the number of apnoeas plus hypopnoeas each associated with at least a 3% desaturation, Quan b.=part of the study by Quan et al 6 referring to data obtained with an RDI including the number of apnoeas plus hypopnoeas each associated with at least a 4% desaturation, Quan c., part of the study by Quan et al 6 referring to data obtained with an RDI including the number of apnoeas irrespective of any oxygen desaturation plus the number of hypopnoeas associated with at least a 4% desaturation, R, retrospective study design; RE, random effect; RP, respiratory polygraphy; Y year.
The quality assessment revealed that most of the included studies were empirical and only one study reported an a priori sample size justification for the presented hypothesis. Outcome assessors were blinded in 29.2% of all studies. As expected, the scoring of the outcome was heterogeneous, as 38% of studies scored their sleep data according to the Rechtschaffen and Kales criteria, 28% according to the AASM guidelines and 34% according to other criteria. Only six studies considered the influence of medication and alcohol on NtNV. For further details, see online supplementary appendix table S9.
Discussion
To the best of our knowledge, this is the first comprehensive systematic review to investigate NtNV of respiratory events in repeated sleep studies in patients with suspected or diagnosed OSA. While the NtNV of respiratory events reported on a group level was rather small, the meta-analysis revealed a remarkable intraindividual variability of respiratory parameters leading to high rates of missed OSA diagnosis and severity class changes from night to night. REM time differences might play an important role in the mechanism of the observed variability of respiratory events.
Our meta-analysis suggests that the number of respiratory events in two sequential sleep studies might not statistically differ on a group level. This might be attributable to a dilution of NtNV by the presence of both, patients who showed a lower AHI in the first night and patients who showed a higher AHI in the first night. We found the mean AHI to be higher in the second night, thereby contradicting those studies, which highlighted higher average respiratory event rates during the first night.4 35 Our results confirm the findings of the only other meta-analysis available regarding NtNV of respiratory parameters.3 The task force of the AASM guidelines performed a meta-analysis of only four observational studies assessing NtNV of AHI in two consecutive PSGs. They found the mean difference between two sleep studies to be 0.14 (95% CI −1.86 to 2.15) which was neither statistically nor clinically relevant. It is to mention that the AASM meta-analysis results are relevantly driven by a study that used at least two different PSG devices within the diagnostic process, which could have been a possible confounder. Although we included studies that used also non-consecutive sleep study protocols and HSAT devices to measure respiratory parameters, the range of the confidence intervals between both meta-analyses were similar.
Our data suggested REM differences to be significantly associated with mean AHI differences in two sequential sleep studies. A majority of studies performing sequential, in-laboratory PSGs reported signs of classical ‘first night effects’,8 21 24 39 48 characterised by a reduction in REM sleep and total sleep time, reduced sleep efficacy, increased wake time after sleep onset and longer REM latency in the first night.49 These sleep architecture changes are assumed to be interconnected to the subjects’ habituation process to the laboratory conditions.50 Thus, the increased mean AHI difference in in-hospital sleep studies, observed in our meta-analysis, might also be explained by sleep architecture impairments amplified by a foreign sleep environment. Nevertheless, since the observed in-hospital AHI differences did not reach statistical significance on a group level, this assumption remains speculative. In contrast to several papers included in this review,5 18 24 35 OSA severity showed no influence on NtNV of respiratory events on a group level. Based on the individual patient data, Stöberl et al 5 reported the ODI variability to be the higher between ODI 10 and 30 events per hour compared with severe OSA. This association can easily be overseen on a meta-level. Nevertheless, this systematic review and meta-analysis was not supposed to be an individual patient data meta-analysis.
Although we could not demonstrate clinically relevant NtNV between two sequential nights on a group level, our data suggested significant intraindividual variability of respiratory events. As such, nigh-to-night changes of respiratory parameters (AHI, ODI or RDI) higher than 10/hour were observed in 41% of the patients. Moreover, this intraindividual NtNV happens to be responsible for OSA severity class changes in up to 49% of patients with suspected OSA. Up to 12% of patients might have been missed with a single night measurement, depending on the applied AHI threshold. Considering that the study participants were symptomatic with an average ESS of 11.8, these data suggested that more than 1 in 10 patients would not have got access to therapy for symptomatic OSA based on a diagnostic workup using only one sleep study.
The AASM taskforce also meta-analysed the intraindividual variability of AHI reported in three observational studies assessing the number of OSA diagnosis that would have been missed if one instead of two consecutive PSGs were performed. They identified that 9.9%–25% of subjects crossed the AHI threshold of 5/hour in the second sleep study. Using a diagnostic threshold of 5/hour, we found that 9%–15% of the participants crossed the threshold from below 5/hour to over 5/hour in one of the sleep studies only. The smaller CI in our analysis is mainly driven by a retrospective observational study with 1091 patients.7 The small intraindividual NtNV in this study might have been due to the fact that these sleep studies were conducted at home.
Considering the high rate of missed OSA diagnosis and severity class changes due to single-night testing, the single-night sleep study protocol in the process of OSA diagnosis and staging may have to be revised. How many nights are needed to diagnose OSA with high accuracy can not be answered by this meta-analysis and should be subject of further research. Besides increasing direct costs for the healthcare system, a diagnostic protocol with two or more sleep studies harbours potential disadvantages. First, an increasing number of sleep studies could lead to an increased false positive diagnosis rate and therefore unnecessary treatment. At second, a multiple night protocol potentially increases patient discomfort, since not all patients might be willing to undergo longitudinal sleep monitoring. Our results may have also major implications on sleep research, fostering the use of multiple sleep night protocols for investigating the potential effect of interventions on respiratory parameters. Investigators should consider that a remarkable number of patients seem to fluctuate with more than 10/hour respiratory events per hour from night to night when assessing the effect of interventions on sleep apnoea severity.
This review and meta-analysis has some limitations. The pooled results were derived mostly from non-interventional observational studies. These are study types in which a lower overall strength of evidence is expected. Furthermore, the bias assessment revealed that three studies showed high risks of bias. Nevertheless, in a sensitivity analysis of the primary outcome, the overall estimate was robust when high risk of bias studies were excluded.
Furthermore, we included studies using different sleep study devices and different scoring rules, which might lead to possibly different AHI, ODI or RDI scorings among these studies. However, including only studies that exactly followed the same protocol regarding used devices, scoring rules, sleep environments and bias assessment, would have minimised the number of included papers and would have led to a substantial loss of information of clinical relevance and statistical power. Moreover, all studies used validated devices. For example, Prasad et al used the Embletta PDS device.40 The AHI obtained by the Embletta correlates closely with that obtained by PSG (Pearson correlation, r=0.979, p<0.001).51 As a result, we are convinced that the natural course of the nightly change of the AHI in this study should be considered comparable with other studies presenting PSG driven AHI values. Furthermore, we have confidence in our results, since only studies that were consistent in used device type and scoring rules throughout the trial were eligible for this meta-analysis. In addition, the clinical implication remains consistent, as a patient with AHI/ODI/RDI below five events per hour would not receive OSA treatment regardless of the used measurement setup. Another limitation of our study is that whenever studies did not report the mean and SD of relevant parameters, but instead reported median and IQR or range, we recalculated the mean and SD following specific formulas suggested by Wan et al.26 While this approach is common, specifically in meta-analyses of observational studies, we cannot be sure if these values would truly have been observed. The quality assessment of the included papers revealed that only one study reported a priori sample size calculation. Most of the included studies were observational studies with only 66.7% following a prospective study design. Furthermore, only a minority of studies controlled for possible confounders such as the intake of alcohol and sedative drugs, both well-known factors that might have influenced NtNV.52
There was a considerable heterogeneity for OSA pretest probability and severity, since some studies included patients with already diagnosed OSA and others included patients with suspected OSA. Nevertheless, we showed that OSA severity was not a statistically relevant moderator for NtNV of respiratory events on a group level.
The primary outcome of this study is based on the assessments of only two recording nights. This is mostly driven by the fact that only eight studies reported results on more than two sleep studies. Considering that the intraindividual variability seemed to increase accordingly with the number of nights, we might have underestimated the NtNV of respiratory events in this meta-analysis. For instance, Stöberl et al 5 conducted their study with the highest number of recording nights (13 nights of pulse oximetry) and reported that only 22% of the patients with moderate-to-severe OSA did not change OSA severity class. Furthermore, moderators were only assessed on NtNV of mean AHI on a group level. Thus, this analysis could not assess which factors might have influenced the intraindividual NtNV. In addition, sleeping in supine position was originally considered as a moderator variable, but the number of studies reporting on it was only four. In combination with outcomes, the number of studies considered was further reduced. Consequently, this analysis could not evaluate the influence of different sleep positions on NtNV of respiratory events.
Laing and Fichter37reported on the impact of additional measurement nights on sensitivity in the diagnostic process of OSA, evaluating the accuracy of three sleep studies using a portable sleep monitor. Considering that all 19 evaluated patients had OSA, the sensitivity increased from 52.6% to 73.7% by adding the result of the second night to the first using an AHI threshold of 5/hour. Nevertheless, further research assessing the accuracy of additional sleep study nights is necessary. Finally, there is a need for comparative effectiveness studies in order to determine the effect of repeated sleep studies on clinical outcomes like subjective sleepiness, quality of life, blood pressure and cost-effectiveness.
References
Footnotes
MR and MB contributed equally.
Contributors MR and MK conceived of the idea for this review. MR, EIS, TG and UH wrote the protocol, MR and MB performed the data extraction. TG and ST did the quality assessment. UH, MR and MB did the statistical analysis. MR, MB, EIS, TG, ST and MK interpreted the statistical results. MR and MB wrote the first draft of the manuscript. All authors revised and approved the final manuscript. MR und MB shared the first authorship.
Funding This project was supported by a grant of 'Lunge Zürich'.
Disclaimer The funding source had no role in the design, execution, analyses, interpretation of the data, or decision to submit results.
Competing interests MK and TG report advisory fees from Bayer.
Patient consent for publication Not required.
Provenance and peer review Not commissioned; externally peer reviewed.
Data availability statement Data are available on reasonable request. All data relevant to the study are included in the article or uploaded as supplementary information. Data are provided in the manuscript and in the online supplementary tables. Further data are available on reasonable request.