Article Text

Abstract
Background Lymphangioleiomyomatosis (LAM) is a rare multisystem disease almost exclusively affecting women which causes loss of lung function, lymphatic abnormalities and angiomyolipomas. LAM occurs sporadically and in people with tuberous sclerosis complex (TSC). Loss of TSC gene function leads to dysregulated mechanistic target of rapamycin (mTOR) signalling. As mTOR is a regulator of lipid and nucleotide synthesis, we hypothesised that the serum metabolome would be altered in LAM and related to disease severity and activity.
Methods Ultrahigh performance liquid chromatography-tandem mass spectroscopy was used to examine the serum metabolome of 79 closely phenotyped women with LAM, including 29 receiving treatment with an mTOR inhibitor and 43 healthy control women.
Results Sphingolipid, fatty acid and phospholipid metabolites were associated with FEV1 in women with LAM (eg, behenoyl sphingomyelin adjusted (adj.) p=8.10 × 10⁻³). Those with higher disease-burden scores had abnormalities in fatty acid, phospholipid and lysolipids. Rate of loss of FEV1 was associated with differences in acyl-carnitine, acyl-glycines, acyl-glutamine, fatty acids, endocanbinoids and sphingolipids (eg, myristoleoylcarnitine adj. p=0.07). In TSC-LAM, rapamycin affected modules of interrelated metabolites which comprised linoleic acid, the tricarboxylic acid cycle, aminoacyl-tRNA biosynthesis, cysteine, methionine, arginine and proline metabolism. Metabolomic pathway analysis within modules reiterated the importance of glycerophospholipid metabolites (adj. p=0.047).
Conclusions Women with LAM have altered lipid metabolism. The associations between these metabolites, multiple markers of disease activity and their potential biological roles in cell survival and signalling, suggest that lipid species may be both disease-relevant biomarkers and potential therapeutic targets for LAM.
- rare lung diseases
Statistics from Altmetric.com
Key messages
What is the key question?
Lymphangioleiomyomatosis (LAM) and tuberous sclerosis complex (TSC) are monogenic diseases resulting in mTOR activation which we predict would alter the metabolic profile of patients and confer metabolic advantages to LAM cells.
What is the bottom line?
Multiple sphingolipid, fatty acid and phospholipid metabolites were associated with disease severity, disease activity and, in subjects with TSC treatment with mTOR inhibitors: suggesting that lipid species may be both disease-relevant biomarkers and potential therapeutic targets for LAM.
Why read on?
This is the first study to comprehensively evaluate the serum metabolome in LAM and, consistent with recent studies highlighting the role of mTOR in cellular lipid metabolism, suggests deranged lipid metabolism is of potential relevance to disease pathogenesis in LAM and also highlights previously unrecognised differences between those with sporadic LAM and TSC-LAM.
Introduction
Lymphangioleiomyomatosis (LAM) is a rare multisystem disease which almost exclusively affects women. Sporadic LAM results from sequential somatic mutations of either TSC1, or more commonly TSC2. In patients with tuberous sclerosis complex LAM (TSC-LAM), loss of TSC gene function occurs due to a germline mutation followed by loss of heterozygosity. The TSC proteins are suppressors of the mechanistic target of rapamycin (mTOR). Loss of TSC function in an as yet unidentified precursor cell leads to dysregulated mTOR signalling and the emergence of a clone of ‘LAM cells’.1 mTOR is a multiprotein cellular signalling node which assimilates inputs from growth factors and cellular nutrient status.2 Constitutive mTOR activation leads to unregulated cell proliferation, migration, invasion of the lungs and lymphatics, and altered metabolism. In the lungs, LAM cells and wild type stromal cells form nodules which together result in the formation of lung cysts, recurrent pneumothorax and progressive loss of lung function.3 Involvement of the axial lymphatics can result in lymphadenopathy, fluid-filled lymphatic masses and chylous collections in the abdomen and thorax. LAM cells are also a component of angiomyolipoma, a benign tumour affecting around half of the women with LAM.4 Pharmacological suppression of mTOR stabilises lung function, and reduces lymphatic complications and angiomyolipoma volume in the majority of those treated.5 6
The rate of disease progression is highly variable. Loss of FEV1 is perhaps the best characterised marker of progression with a mean loss of FEV1 around 80–140 mL/year in most populations studied.5 7 However, some patients remain stable for many years while others have a rapid clinical course requiring lung transplantation. LAM cells express oestrogen and progesterone receptors and proliferate and metastasise in response to oestrogen in vitro and in vivo.8 9 Consistent with this, loss of FEV1 is accelerated by pregnancy and slows after the menopause.7 10
mTOR signalling is a major regulator of lipid synthesis, nucleotide synthesis and glucose metabolism. By regulating the transcription factor sterol responsive element binding protein (SREBP) both via S6 kinase and through phosphorylation of Lipin1, the expression of genes involved in fatty acid and cholesterol biosynthesis are regulated. By increasing glycolytic enzyme expression, mTOR complex 1 (mTORC1) supports cellular growth by modulating the balance between oxidative phosphorylation and glycolysis, increasing the activity of the pentose phosphate pathway. mTORC1 also promotes the synthesis of purine and pyrimidine nucleotides.11 12
We, therefore, reasoned that women with LAM would have alterations of the serum metabolome, due to the metabolic effects of mTOR activation. Moreover, these metabolomic changes would be related to disease severity and activity. To answer these questions, we analysed the serum metabolome of a cohort of closely phenotyped women with LAM.
Methods
Subjects and clinical data
Women with LAM were recruited from the National Centre for LAM in Nottingham UK. All subjects had LAM defined by current American Thoracic Society/ Japanese Respiratory Societycriteria.13 All had a clinical assessment, including drug history, clinical screening for TSC, lung function and CT scanning of the chest and abdomen to detect angiomyolipoma and lymphatic involvement. Menopausal status was recorded and subjects were considered postmenopausal if they had had a bilateral oophorectomy or were over 50 years of age and had not had a period for 24 months. None of the subjects were using systemic hormone therapy. Control subjects were 43 healthy women over the age of 18 years with no prior history of lung disease from three metabolomic studies (see online supplementary table 1).
Supplemental material
Tertiles of per cent predicted FEV1 and diffusing capacity of the lung for carbon monoxide (DLCO) at the time of assessment were generated with tertile 1, the highest, and tertile 3, the lowest, values. Lung function decline was calculated as the loss of FEV1 (ΔFEV1, ml/year) in the period preceding blood sampling. Rate of loss of lung function was based on a period of observation of greater than 1 year for all subjects.
To stratify the whole-body burden of LAM, a disease burden score between 0 and 3 was used. Subjects were assigned one point for each of (1) More severe lung disease defined by an FEV1 or DLCO of <60% predicted. (2) The presence of an angiomyolipoma at the time of assessment. (3) The presence of lymphatic involvement visible on imaging (lymphadenopathy, cystic lymphatic mass or chylous effusion).
Serum samples
Blood was collected in serum separator tubes and processed immediately from subjects without fasting. Samples were allowed to clot for 30 min at room temperature, centrifuged at 10 000 G for 10 min and stored in aliquots at −80°C until analysis. Serum vascular endothelial growth factor-D (VEGF-D) was determined using Quantikine ELISA DVED00 (R&D Systems, Abingdon, UK).
Serum metabolomics
Serum metabolomics was performed by Metabolon (Morrisville, North Carolina, USA). Samples were prepared using the MicroLab STAR system (Hamilton Company). Proteins were precipitated with methanol and the resulting extracts analysed by two separate reverse phases (RPs)/UPLC-MS/MS methods with positive ion mode electrospray ionisation (ESI), one for analysis by RP/UPLC-MS/MS with negative ion mode ESI, and one for analysis by hydrophilic interaction chromatography (HILIC)/UPLC-MS/MS with negative ion mode ESI. Controls were analysed with the experimental samples including a pooled matrix sample generated from experimental samples, extracted water samples as process blanks and quality control standards selected not to interfere with endogenous compounds. Experimental samples were randomised across the platform run with quality control samples spaced evenly among the injections.
The analysis was performed using ultrahigh performance liquid chromatography-tandem mass spectroscopy (UPLC-MS/MS) using a Waters ACQUITY UPLC and a Thermo Scientific Q-Exactive high resolution/accurate mass spectrometer interfaced with a heated ESI II source and Orbitrap mass analyser operated at 35 000 mass resolution. Sample extracts were dried and reconstituted in appropriate solvents. Reconstitution solvents contained a series of standards at fixed concentrations to ensure injection and chromatographic consistency. Four methods appropriate for different ion types and compounds were used, for all identified species including lipids. Raw data were extracted, peak-identified and quality control processed. Compounds were identified by comparison to a library of >3300 commercially available purified standard compounds and recurrent unknown entities using the retention time/index, mass-to-charge ratio and chromatographic data. Further details are provided in the online supplementary methods.
Supplemental material
Statistical and bioinformatic analysis
Full details of the statistical and bioinformatics analysis are presented in the online supplementary methods. Briefly, normalisation of case and control metabolite samples was performed following the workflow described by Shin et al 14 and Krumsiek et al.15 Each raw metabolite value was rescaled to have median 1 to adjust for variation due to instrument run-day tuning differences. Missing values were imputed using the K nearest-neighbor-truncated normal (KNN-TN) method.16 Differential analysis of serum metabolites was performed using Limma17 controlling for the false discovery rate (FDR).18 Differential coexpression network analysis was used to detect significant associations between the relative abundance of metabolites in differential networks, or modules, between conditions and their significance assessed through permutation tests.19 Annotation of metabolites was performed using HMDB V.4.020 release 2019-01-16. Finally, metabolomic pathway analysis was performed by using MetaboAnalyst V.4.021 with significant differential metabolite modules detected in the differential network analysis mapped in Kyoto Encyclopaedia of Genes and Genomes (KEGG) pathways.
Results
The metabolome in LAM
Seventy-nine women with LAM were studied. The subjects were typical of other reported series: having an average age of approximately 50 years at the time of study and had had LAM for an average of 13.5 years (table 1). Two-thirds had angiomyolipoma, a quarter had had pneumothorax in the past and their mean serum VEGF-D was 1250 pg/mL. Fifteen per cent had TSC and a third were postmenopausal. Twenty-nine were being treated for LAM with rapamycin at the time of the study. Although of similar age and body mass index (two-sided Wilcoxon signed-rank test p=0.29 and p=0.92, respectively), those treated with rapamycin tended to have lower values of FEV1 and DLCO (two-sided Wilcoxon signed-rank test p=3.9 × 10⁻⁴ and p=4.63 × 10⁻⁶, respectively). Further details of women with LAM are given in online supplementary tables 2 and 3.
Patient characteristics
After compound identification, quantification and data curation, 1326 serum metabolites were identified from 122 individuals. Metabolites spanned a wide range of biochemical classes or super pathways including 183 amino acid (13.8%), 24 carbohydrate (1.8%), 21 cofactors and vitamins (1.6%), 10 energy (0.8%), 471 lipid (35.5%), 32 nucleotide (2.4%), 79 peptide (6%) and 115 xenobiotics (8.7%) and a remaining group of 391 untargeted metabolites (29.5%). A heatmap of the log-transformed corrected metabolites and super pathways levels with the groups considered in the analysis is presented in figure 1.

Heatmap of log-transformed metabolite levels after correcting for confounding factors. Hierarchically clustered metabolites (horizontal) stratified by super pathway and participants of the study (vertical) stratified by healthy controls and women with LAM premenopause and postmenopause with and without rapamycin treatment (grey scale colour code); patients with TSC-LAM and sporadic LAM with and without rapamycin treatment (red scale); FEV1 (blue scale); Diffusing capacity of the lung for carbon monoxide (DLCO) (green scale); overall disease burden (orange scale); disease activity based on annual decline in forced expiratory volume (ΔFEV1) (ml/year); T, tertile, 1 highest, 3 lowest; S, score, 0 lowest, 3 highest. For group definitions, see online supplementary table 3. LAM, lymphangioleiomyomatosis; mTOR, mechanistic target of rapamycin; TSC, tuberous sclerosis complex.
We examined how individual metabolites varied with the presence or absence of LAM. Using an FDR of 10%, there were no differences in the abundance of individual metabolites between women with LAM who had not received rapamycin and healthy control women (see online supplementary table 4). Control metabolomic profiles were quite variable. Hierarchical clustering showed that there was no segregation between control samples from the current study and companion metabolites studies (see online supplementary figure 1). Variation was lower in women with LAM and differences in the metabolic profile were observed when women with LAM were stratified according to menopausal status, lung function, disease burden and disease activity (table 2).
Supplemental material
Supplemental material
Number of differential metabolites identified
Supplemental material
Association of metabolic changes with disease severity and activity
To test the hypothesis that dysregulation of the metabolome was related to disease severity and activity, individuals with LAM were stratified according to the severity of their lung disease, the whole-body burden of LAM and rate of loss of FEV1. As we suspected that mTOR inhibition would affect the metabolome, we restricted this analysis to the 50 subjects who had not received rapamycin. Subjects were grouped into tertiles of FEV1 and DLCO (tertile 1 highest values, tertile 3 lowest, see online supplementary table 3). Comparing tertiles 1 and 2 applying a 10% FDR, reductions were seen in sphingolipids (behenoyl sphingomyelin (adjusted (adj.) p=8.10 × 10⁻³), lignoceroyl sphingomyelin (adj. p=8.10 × 10⁻³), lactosyl-N-behenoyl-sphingosine (adj. p=3.06 × 10⁻²), tricosanoyl sphingomyelin (adj. p=6.23 × 10⁻²) and palmitoyl dihydrosphingomyelin (adj. p=9.75 × 10⁻²)), fatty acids (eicosenoylcarnitine (adj. p=8.68 × 10⁻²)), phospholipids (1-palmityl-2-stearoyl-glycero-phosphocholine (GPC) (adj. p=8.10 × 10⁻³)) and pantothenate (adj. pantothenate (adj. p=9.75 × 10⁻²)), see online supplementary figure 2. Full details are presented in online supplementary table 5. There were no significant associations between metabolites and DLCO (table 2).
Supplemental material
To examine the relationship between the metabolome and the whole body burden of LAM, we then stratified subjects by a score that reflected the presence of disease in the lungs, lymphatic tissue and angiomyolipomas (score 0 lowest disease burden, score 3 highest disease burden, see online supplementary table 3). Those with the highest disease burden score had abnormalities in four fatty acids, four phospholipids and one lysolipid metabolite (see online supplementary table 5). Stearoylcholine, lineloylcholine, palmitoylcholine, oleylcholine, docosahexaenoylcholine, arachadonycholine, eicosapentaenoylcholine, dihomo-linolenoyl-choline and 2-stearoyl-glycero-phosphoinositol (GPI) (18:0) differed in abundance across levels of disease burden, tending to be lower in more extensive disease (figure 2 and online supplementary figure 3). Although the same pathways were associated with both lung function and disease burden, the individual metabolites within these pathways differed (see online supplementary table 5).
Supplemental material
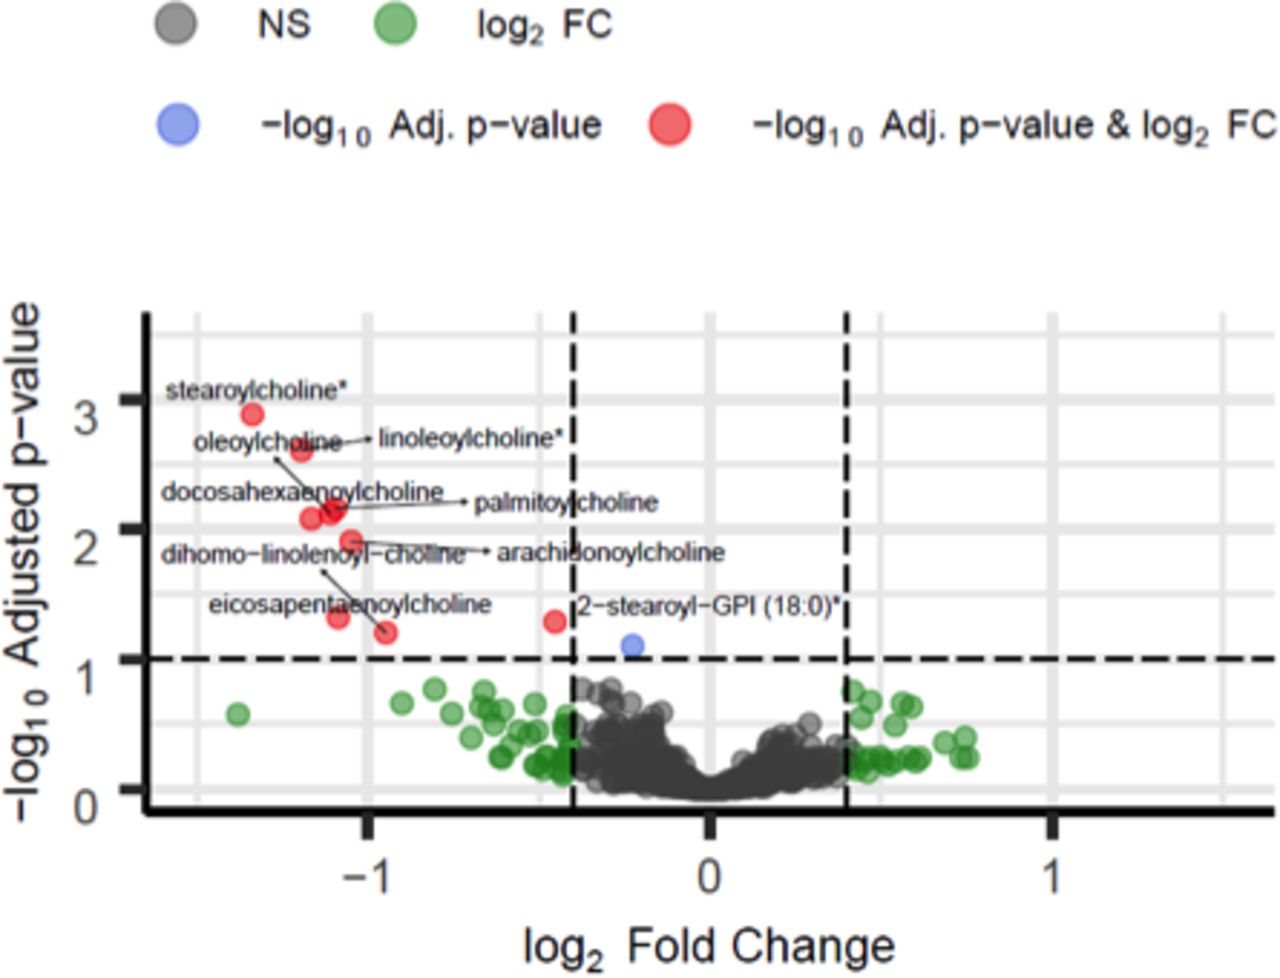
Volcano plot of fatty acids and phospholipids across overall disease burden. Significantly different metabolites at 10% false discovery rate (FDR) (y-axis) with |log2 fold change (FC)|>0.4 (x-axis) in patients not treated with rapamycin between overall disease burden score S0 (lowest, n=8) and scores S1 (n=17), S2 (n=23) and S3 (highest, n=2) (for group definitions, see online supplementary table 3). Red, blue, green and grey dots indicate metabolites that are significantly different between conditions at 10% FDR with |log2 FC|>0.4, metabolites significant at 10% FDR with |log2 FC|<0.4, non-significant at 10% FDR with |log2 FC|>0.4 and overall non-significant (NS), respectively. *Compounds identified without confirmation by a standard. Full results are presented in online supplementary table 5.
Rate of loss of FEV1 was used as a measure of disease activity. Subjects were divided into tertiles, with 1 being the lowest (best) rate of FEV1 loss. Changes in abundance of 22 metabolites, at an FDR of 10% were observed between those with the lowest ΔFEV1 in tertile 1 and those with the fastest ΔFEV1 in tertile 3 (figure 3). Again, metabolites associated with ΔFEV1 were almost all lipid-based comprising eight acyl-carnitine, one acyl-glycine, one acyl-glutamine, five fatty acid, three endocanbinoid and two sphingolipids (table 3 and online supplementary table 5).
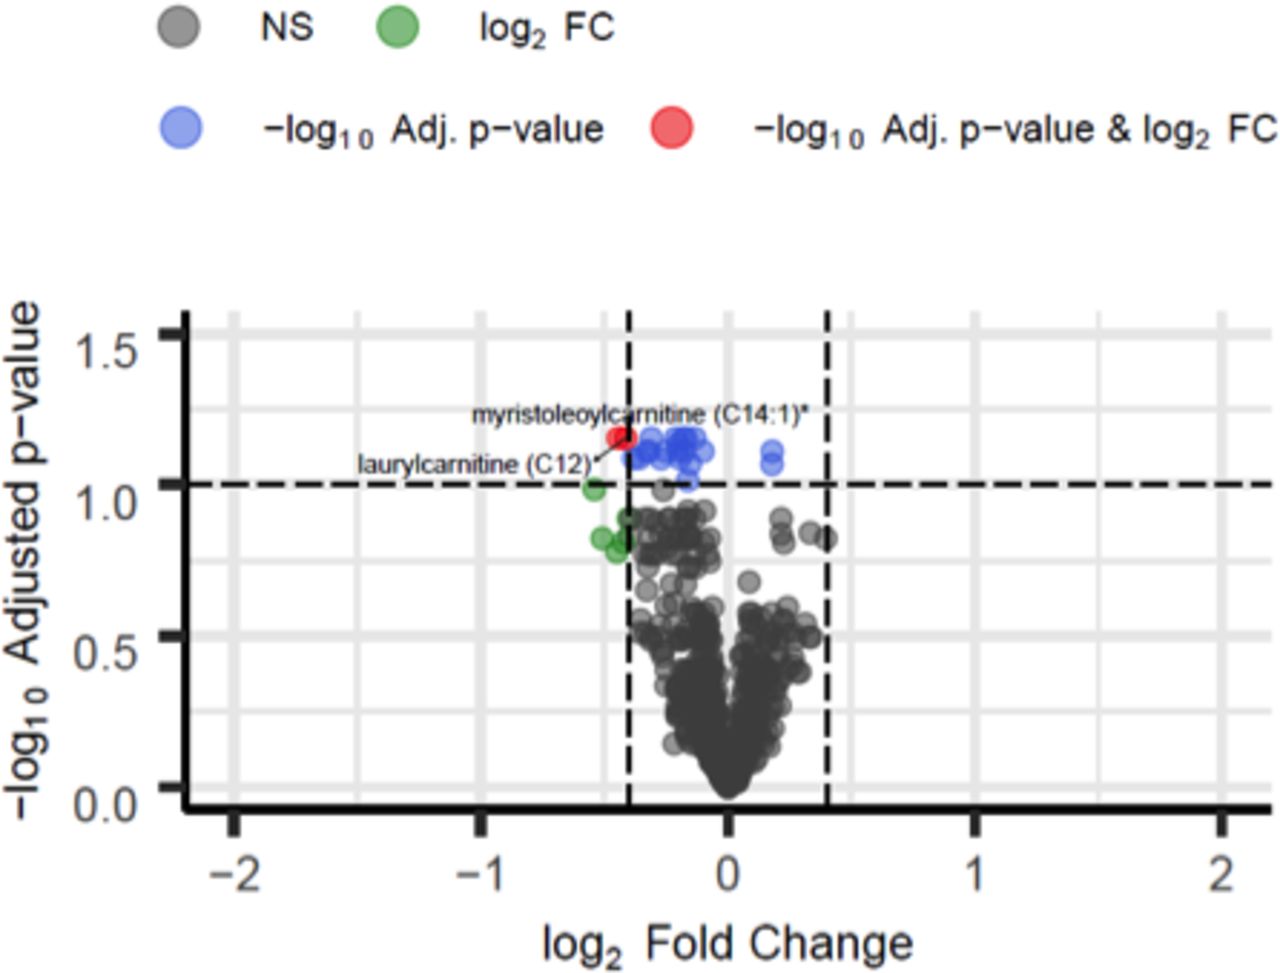
Volcano plot of metabolic changes in patients with rate loss of FEV1. Significantly different metabolites at 10% false discovery rate (FDR) (y-axis) with |log2 fold change (FC)|>0.4 (x-axis) in patients not treated with rapamycin with ΔFEV11 T1 (n=13) and ΔFEV1 T3 (n=12) (for group definitions, see online supplementary table 3). Red, blue and grey dots indicate metabolites that are significantly different between conditions at 10% FDR with |log2 FC|>0.4, metabolites significant at 10% FDR with |log2 FC|<0.4 and overall non-significant (NS), respectively. *Denotes compounds identified without confirmation by a standard. Full results are provided in online supplementary table 5.
Lipid mediators associated with rate of loss of FEV1
Metabolic changes postmenopause
Several studies have reported that the mean rate of loss in FEV1 is slower in postmenopausal than premenopausal women with LAM.7 10 We therefore compared the metabolome of the 33 premenopausal and 17 postmenopausal women who had not been treated with rapamycin. In postmenopausal women, as expected, 18 sex steroid metabolites were altered (see online supplementary table 4 and figure 5). Metabolomic pathway analysis identified that menopausal status was associated with significant enrichment of the steroid hormone biosynthesis pathway (see online supplementary figure 6). Also, levels of 14 acyl-carnitine, 1 acyl-glycine, 1 acyl-glutamine, 12 phospholipids, 5 fatty acids, 5 diacylglycerols and 2 secondary bile acid metabolites were altered (see online supplementary table 4).
Supplemental material
Supplemental material
Effect of rapamycin on the serum metabolome
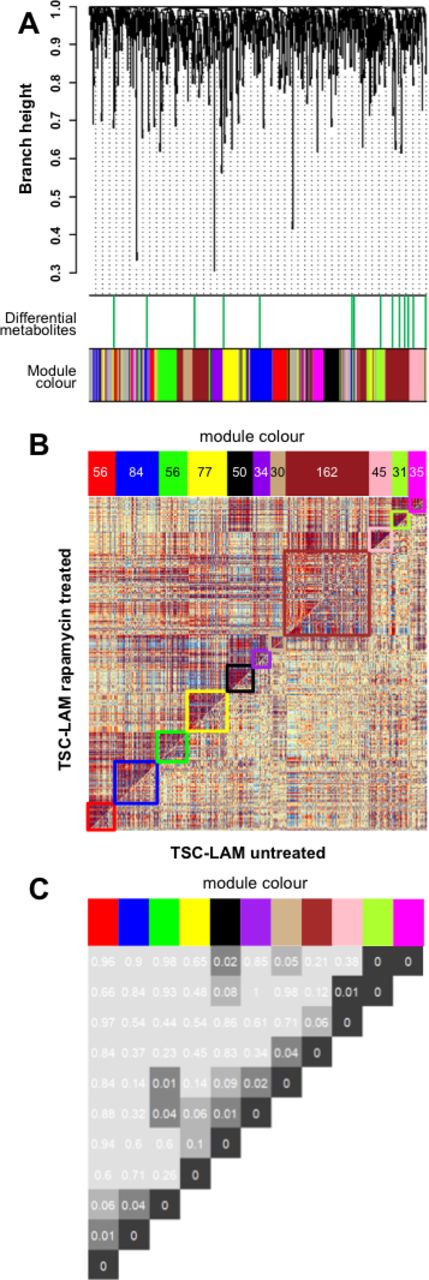
Women with sporadic LAM treated with rapamycin had similar metabolomic profiles to those not treated with rapamycin. In contrast, in those with TSC-LAM, rapamycin affected a network of inter-related metabolites whose significance was assessed by empirical p value <0.1. Although no individual metabolites significantly differed in abundance (see online supplementary figure 4), changes in related groups of metabolites were identified as differential coexpression networks or ‘modules’. The modules, arbitrarily described by colours, are described in detail in online supplementary table 6. These modules were not detected if a coexpression network analysis was performed separately on TSC-LAM samples with and without rapamycin treatment (see online supplementary figure 7). The relationship between modules suggests these metabolites are either interdependent or affected in a similar manner by mTOR inhibition (figure 4). Individual modules (blue, tan and magenta) were also significantly negatively associated with FEV1, while ΔFEV1, a measure of disease activity, was significantly positively correlated with the blue module. These associations were not seen in subjects treated with rapamycin (figure 5B), suggesting they are downstream of mTORC1. Metabolomic pathway analysis of the individual modules again shows a significant contribution from glycerophospholipid metabolites that are altered by treatment with rapamycin (figure 5A and online supplementary figure 8).
Supplemental material
Supplemental material
Supplemental material
Supplemental material

Differential coexpression network analysis after mTOR inhibitor treatment. (A) Dendrogram showing clustering of differential coexpressed metabolites (modules) based on TSC-LAM samples without (n=5) and with (n=7) mTOR inhibitor treatment (for group definitions, see online supplementary table 3). Top bar: metabolites with |log2 FC|>0.4 (green); bottom colour bar: colours identify 15 modules generated by unsupervised hierarchical clustering. (B) Comparative correlation heatmap (red corresponds to positive correlations, blue to negative correlations). The upper diagonal matrix shows the correlation between pairs of metabolites in the TSC-LAM rapamycin group while the lower diagonal matrix shows the correlation between pairs of metabolites in the TSC-LAM untreated group. Modules are identified in the heatmap by colour-coded squares and on the top by a colour bar. (C) Significance of the identified differential coexpressed metabolites and covariation between modules (empirical p values inside each module pair). Modules are identified on the top by a colour bar with number of metabolites in each module. LAM, lymphangioleiomyomatosis; mTOR, mechanistic target of rapamycin; TSC, tuberous sclerosis complex; FC, −log2 fold change.

Pathway analysis of modules affected by mTOR inhibition. Differential coexpressed metabolites (modules) pathway analysis and correlation with clinical phenotypes in the TSC-LAM samples without (n=5) and with (n=7) rapamycin treatment (for group definitions, see online supplementary table 3). (A) Scatter plots depicting −log10 p values of the metabolomic pathway analysis (y-axis) and impact values from topology pathway analysis (x-axis). For each significant module (empirical p value <0.1) with at least one significant pathway, metabolomic pathways detected at 10% Holm–Bonferroni correction are highlighted (full results are presented in online supplementary table 6). Modules are identified by the colour bar, dot sizes are proportional to the number of altered metabolites within the pathway. (B) Table of correlations and p values for studying the relationships between modules ‘eigen-metabolites’ (rows) and selected clinical traits (columns) in TSC-LAM samples without (left) and with (right) rapamycin treatment. Significant Spearman correlations at 10% nominal level of significance and corresponding p values are reported inside the tables. LAM, lymphangioleiomyomatosis; TSC, tuberous sclerosis complex; DLCO, diffusing capacity of the lung for carbon monoxide; VEGF-D, vascular endothelial growth factor-D
Discussion
This study is the first comprehensive examination of the serum metabolome in a large cohort of women with LAM. Sphingolipid and fatty acid metabolism were associated with the severity of lung disease, total body burden of LAM and disease activity defined by the rate of loss of FEV1. Comparison of mTOR inhibitor treated and untreated women showed changes in metabolite networks incorporating glycerophospholipid metabolites in subjects with TSC-LAM but not sporadic LAM. These findings are likely to reflect the altered metabolism of the LAM cell with metabolites related to disease activity and severity.
We observed that FEV1, a measure of airflow limitation, was related to sphingolipid and fatty acid metabolism, although this was not a simple relationship with the greatest abnormalities seen in those with moderate impairment (tertile 2). Airflow limitation in LAM is thought to be due to loss of elastic recoil resulting from parenchymal destruction and these metabolomic alterations may reflect the amount of parenchymal involvement. However, as we observed that the same metabolomic pathways were also related to the rate of loss of FEV1, a measure of disease activity, it is also possible that FEV1 tertile 2 contained those with the most active disease, both in terms of disease progression and mTOR-driven metabolic changes. Subjects with better-preserved FEV1 (tertile 1) may have less active disease and those with the most advanced disease (tertile 3) may have reached a ‘burned out’, less metabolically active stage. This idea is supported by the strong linear association between acyl-carnitine fatty acid and sphingolipid metabolism with the rate of FEV1 loss, suggesting changes in the lipidome are associated with both disease extent and activity.
We reasoned that at least some of the metabolic changes observed would be related to the number of LAM cells in the body. The disease’s clinical phenotype, and hence LAM cell burden, is variable with some having extensive lymphatic involvement or large angiomyolipomas and others having only lung disease. It is not possible to accurately determine the ‘whole-body burden’ of LAM cells, particularly as some organ involvement is likely to be subclinical.22 We, therefore, used a simple score comprising mild or more advanced lung disease, the presence of angiomyolipoma and lymphatic involvement visible by clinical imaging. As we predicted, this ‘disease burden’ score was associated with the degree of metabolic abnormality in acyl-choline fatty acid metabolism and phospholipids with the same group of 10 metabolites significantly different between all groups with the largest differences in those with the greatest disease burden.
The observations that LAM is one of the most female-specific diseases described, that rate of loss of FEV1 is lower in postmenopausal women,7 10 can be exacerbated by pregnancy23 24 and occurs earlier in those exposed to oestrogen-containing contraceptives,25 suggest that LAM is likely to be oestrogen driven and we had expected the metabolome to reflect increased disease activity in premenopausal women. As anticipated, there were widespread changes in sex steroid metabolism between premenopausal and postmenopausal women with LAM. We also observed changes in phospholipid and acyl-carnitine fatty acid metabolism. While it is tempting to speculate this change is related to reduced disease activity as a result of lower oestrogen levels, the menopause in healthy women is also associated with changes in acyl-carnitine, fatty acid and lysophosphatidylcholine metabolism26 and we are unable to relate the changes observed here to a specific set of processes.
The molecular defect in the TSC proteins and the impressive reduction in lung function decline during mTOR inhibitor therapy suggesting that mTOR activation is the key driver of LAM and TSC.1 5 In our study, the metabolic abnormalities associated with disease extent and activity are almost exclusively comprised of lipids, particularly sphingolipids, phospholipids and acyl-carnitine fatty acids, reflecting metabolic processes downstream of mTOR. As an investigation in a monogenic disease characterised by mTOR dysregulation, our study provides a translational link between this basic mTOR biology, LAM and other diseases in which mTOR is activated. The changes observed represent a metabolic signature of increased fatty acid synthesis and uptake which is also a characteristic of cancer cells.27 28 Glycerophospholipid and sphingolipid metabolites are also associated with airflow obstruction in patients with COPD; while mTOR can be activated to some degree in COPD it is also possible these changes are a response to tissue damage.29 mTORC1 and mTORC2 stimulate expression and processing of SREBP1 and suppress its negative regulator LIPIN1. SREBP1 is a transcription factor responsible for the expression of the fatty acid synthases, ATP citrate lyase, fatty acid synthase, acetyl-co-enzyme (CoA) carboxylase 1 and stearoyl-CoA desaturase. In addition, mTORC1 further stabilises these gene transcripts to enhance fatty acid synthesis and enhances fatty acid uptake via CD38. Lipidomic profiling of TSC2 null murine fibroblasts has similarly shown an increase in multiple lipid species including phosphatidylcholine, lysophosphatidylcholines, phospholipids, sphingomyelins and triacylglycerols.30 Inhibition of mTOR signalling with rapamycin in TSC2 null murine fibroblasts did not suppress the overproduction of most lipid species, whereas downregulation of SREBP1 did, perhaps as SREBP1 is known to be only partially rapamycin sensitive.31 These observations are consistent with our findings showing that serum lipid abnormalities were only affected by rapamycin therapy in subjects with TSC where although groups of metabolites, or modules, were altered by rapamycin, only glycerophospholids were consistently differentially abundant in those receiving rapamycin. Also consistent with a role for mTORC1 in metabolism was the observation that the associations between metabolite networks, lung function and disease activity were not seen in women with LAM who were being treated with rapamycin.
The LAM cell, analogous to a cancer cell, is likely to use altered lipid metabolism to support cell membrane synthesis as constituents of membrane lipid rafts, saturated and monounsaturated phospholipids, potentially protect cancer cells from oxidative damage by reducing lipid peroxidation.32 As second messengers, lipids, including sphingosine 1-phosphate, promote cell proliferation and migration and in turn feed back to activate mTOR signalling.28 Depletion of SREBP1 and SREBP2 reduces monounsaturated fatty acids, resulting in mitochondrial dysfunction, the accumulation of reactive oxygen species and endoplasmic reticulum stress.33 Inhibitors of various lipid synthetic enzymes are currently in clinical trials for cancer and may also have therapeutic potential in conjunction with mTOR inhibitors for LAM and TSC.
The metabolomic platform used identifies metabolites based on a combination of three MS/MS criteria referenced against library data of over 3300 purified standards. While no targeted assays are performed, the approach has been extensively applied and validated.34 We were surprised to observe that after statistical corrections, healthy women and those with LAM did not have different metabolic profiles. The healthy control samples were variable, with no apparent clustering dependent on the source of the control sample. In addition, within women with LAM, significant metabolic changes in response to rapamycin were only observed in patients with TSC-LAM. While TSC and sporadic LAM have the same underlying molecular abnormality,35 those with TSC-LAM may have larger changes in lipid metabolism, due to other TSC-related tumours and perhaps widespread haploinsufficiency for TSC.
LAM is a rare disease with a variable clinical phenotype and despite this being the largest metabolic analysis in LAM to date, the relatively small sample size reduces the statistical power to detect differential metabolites which may account for some of the unexpected results we have observed, in particular between healthy women and those with LAM not treated with rapamycin. Possible approaches would be to define a more liberal level of significance or FDR although this may increase false-positive observations. Alternatively, pooling ‘similar’ metabolites,36 such as those that belong to the same KEGG pathway, could increase power.
In conclusion, we have performed the largest comprehensive metabolomic study in women with LAM to date and have demonstrated multiple abnormalities in lipid metabolism, particularly, sphingolipids and phospholipids, and the fatty acids acyl-carnitine, acyl-choline and acyl-glycine. These changes are poorly responsive to rapamycin, the only disease-modifying therapy for LAM and are likely to contribute to LAM cell growth, survival and resulting lung damage. The associations between these metabolites, multiple markers of disease activity and their potential roles in cell survival and signalling, suggest that lipid species may be both disease-relevant biomarkers and potential therapeutic targets.
Acknowledgments
The authors thank the women with LAM who contributed to the study. The authors also thank and Paul Kirk and Angelos Alexopoulos for suggestions and insightful comments regarding the KNN-TN software.
References
Footnotes
Contributors LB performed the data analysis, produced the figures and co-wrote the paper. SM processed the samples and coordinated the clinical data. SRJ conceived the study, saw the patients co-wrote the paper and acts as guarantor for the study.
Funding Alan Turing Institute under the Engineering and Physical Sciences Research Council(EP/N510129/1 to L.B.). NIHR RD-TRC and MRC/EPSRC Nottingham Molecular Pathology Node(MR/N005953/1)
Competing interests SRJ reports grants from the National Institute for Health Research, The LAM Foundation, LAM Action during the conduct of the study and personal fees from Pfizer, outside the submitted work.
Patient consent for publication Obtained
Ethics approval The study was approved by the East Midlands Research Ethics Committee (13/EM/0264). The use of control samples was approved by Nottingham University Ethics Committee (approval BT A27 08 2009).
Provenance and peer review Not commissioned; externally peer reviewed.
Data availability statement All data relevant to the study are included in the article or uploaded as supplementary information.