Article Text

Abstract
Introduction Low-dose CT (LDCT) is currently used in lung cancer screening of high-risk populations for early lung cancer diagnosis. However, 96% of individuals with detected nodules are false positives.
Methods In order to develop an efficient early lung cancer predictor from clinical, demographic and LDCT features, we studied a total of 218 subjects with lung cancer or benign nodules. Probabilistic graphical models (PGMs) were used to integrate demographics, clinical data and LDCT features from 92 subjects (training cohort) from the Pittsburgh Lung Screening Study cohort.
Results Learnt PGMs identified three variables directly (causally) linked to malignant nodules and the largest benign nodule and used them to build the Lung Cancer Causal Model (LCCM), which was validated in a separate cohort of 126 subjects. Nodule and vessel numbers and years since the subject quit smoking were sufficient to discriminate malignant from benign nodules. Comparison with existing predictors in the training and validation cohorts showed that (1) incorporating LDCT scan features greatly enhances predictive accuracy; and (2) LCCM improves cancer detection over existing methods, including the Brock parsimonious model (p<0.001). Notably, the number of surrounding vessels, a feature not previously used in predictive models, significantly improves predictive efficiency. Based on the validation cohort results, LCCM is able to identify 30% of the benign nodules without risk of misclassifying cancer nodules.
Discussion LCCM shows promise as a lung cancer predictor as it is significantly improved over existing models. Validated in a larger, prospective study, it may help reduce unnecessary follow-up visits and procedures.
- lung cancer risk
- low-dose CT
- cancer screening
This is an open access article distributed in accordance with the Creative Commons Attribution Non Commercial (CC BY-NC 4.0) license, which permits others to distribute, remix, adapt, build upon this work non-commercially, and license their derivative works on different terms, provided the original work is properly cited, appropriate credit is given, any changes made indicated, and the use is non-commercial. See: http://creativecommons.org/licenses/by-nc/4.0/.
Statistics from Altmetric.com
Key messages
What is the key question?
How can we reduce the number of unnecessary procedures on subjects with identified nodules on lung screening by performing integrative analysis of CT scan and other clinical data?
What is the bottom line?
Using causal graphical models, we developed a new lung cancer predictor with three variables which outperforms existing methods and may help reduce further tests in 30% of subjects with benign nodules.
Why read on?
Both the methodology of developing the predictor (causal graphs) and the predictor itself are novel and significant and can contribute significantly to the field of early lung cancer prediction.
Introduction
The proliferation of lung cancer screening programmes using low-dose CT (LDCT) examination followed the National Lung Screening Trial (NLST) observation of 20% reduction in lung cancer mortality for CT exams compared with chest X-ray.1 2 Notably, 24% of the LDCT screening exams produced a positive result, which required follow-up, but 96% of these findings were false positives (ie, negative for lung cancer). This often leads to harmful and/or costly unintended consequences (eg, follow-up scans, invasive biopsies).3 4 Therefore, it is critical to improve the discrimination of benign from malignant screen-detected lung nodules.
Over the past decade, several models for lung cancer risk prediction have been developed,5–14 and some authors have argued that they are more sensitive than the NLST selection criteria.11 12 Although these models can be used to discriminate lung cancer from non-cancer cases,12 14 their primary goal is to select high-risk subjects for LDCT scans. Subsequently, radiologists determine the likelihood of malignancy of lung nodules primarily based on imaging features, such as solidness, calcification, spiculation and growth rate. Recently, predictors that incorporate LDCT scan features were developed.12 Current models use regression analyses to select informative features.15 However, it is possible that more sensitive machine learning methods can produce more accurate and interpretable models.
In this study, we first investigate whether probabilistic graphical models (PGMs) can improve lung cancer prediction by integrating LDCT scan features with other clinical data and comorbidities. PGMs have been used in biomedical research due to their simplicity and interpretability,16–19 and offer a clear benefit over more abstract methods (support vector machines SVMs, random forests and so on) without loss in classification accuracy.16 Another advantage is that the graph can be used to calculate potential missing values of one or more of the predictive variables.20 PGMs also have theoretical guarantees that their solutions (dependencies and orientations in the graph) are asymptotically correct. This is why directed graphs are frequently referred to in the literature as ‘causal’.20 21 A useful property of graphical models is that one can use the graph learnt over the complete data set to select the most informative variables for any outcome or phenotype of interest. This is because, by construction, the Markov blanket around a target variable, T, makes T informationally independent of any other variable or combinations of variables in the data set (Markov blanket of T consists of its parents, children and other parents of the children in the graph).21
We also present a first version of the Lung Cancer Causal Model (LCCM), a new lung cancer predictor, which is derived using PGMs on CT findings and clinical and epidemiological factors. LCCM is then compared with currently published predictors on an independent validation cohort.
Materials and methods
Study populations
This study uses demographic data, smoking history, comorbidities and LDCT scan features of lung nodules from the Pittsburgh Lung Screening Study (PLuSS)22 cohort. PLuSS is a community-based research cohort that during 2002–2006 recruited 3642 smokers (current or former). All PLuSS participants received a baseline LDCT scan, and 3423 participants received a follow-up LDCT scan 1 year later. In addition, each PLuSS participant completed a questionnaire including questions on smoking history, underwent spirometry for pulmonary function testing and provided a blood sample. A subset of 970 PLuSS participants received biennial LDCT scans in 2006–2016, and yearly spirometry and blood draws. In conjunction with the approval of LDCT as a covered service for lung cancer screening, all research lung screening activities were folded into PLuSS XX, our ongoing lung cancer screening research cohort that includes original PLuSS participants as well as new participants who fulfil the lung cancer screening criteria (2016 to present).
Training cohort
The training cohort included 50 subjects with cancer detected on their baseline LDCT scan (prevalent cancers) and 50 subjects with screen-detected nodules from a previously evaluated subset of PLuSS participants.23 Detected nodules were >0.6 cm in accordance to the LUNG-RADS schema,24 with the largest nodule 3.6 cm. The benign status of the nodules was further confirmed through prolonged follow-up (2–15 years). Eight control subjects were excluded because of missing information on CT scan variables (seven) and number of nodules (one). Thus, the final training cohort had 50 cases and 42 controls (table 1A). Based on the inclusion criteria (age 55–77, pack-years >30 and quit <15 years), the PLuSS cohort has a very homogeneous population and the selected subjects were at very high risk of lung cancer. As a result, age, sex and smoking history were similar in subjects with malignant and benign nodules (table 1A). The training cohort variables are presented in online supplementary table S1.
Supplemental material
Characteristics of the training cohort
Validation cohort
The validation cohort consists of 126 subjects (44 cases and 82 controls) from the PLuSS XX cohort. The data from these subjects were collected independently of the training cohort. The characteristics of the validation cohort are presented in table 1B. Age, sex and smoking history were similar in subjects with cancer and benign nodules in the validation cohort too. For nodules <3 cm the validation cohort consisted of 39 cases and 63 control subjects. When considering all (benign) nodules in the control subjects (not only the largest), we have a total of 84 nodules (online supplementary table S2).
Extraction of CT features
One experienced thoracic radiologist identified and characterised lung nodules according to size, presence and type (solid, non-solid or part-solid), and lobar location. The radiologist used the axial image showing the nodule to its fullest extent to measure the maximum nodule diameter and the nodule diameter perpendicular to this maximum. The average of these two diameter measurements, referred to as the average diameter, was used as a summary measure of nodule size. The same methods were used to extract the radiographic features in cancer cases and controls in both cohorts. We have previously described the procedure for quantification of the vasculature surrounding a nodule.23 In short, lung nodules were automatically segmented from LDCT images and subvolume was defined around the nodule. Vessels within the subvolume were automatically segmented and skeletonised. The subvolume vessels were processed to compute the count of the number of vessels attached to, close to or projected towards the nodule.
Probabilistic mixed graphical models with latent variables for cancer prediction
For modelling the dependencies in the data, we used MGM-FCI-MAX,25 which learns a directed graph over mixed data types in the presence of latent confounders. This is important because medical and biomedical data usually contain variables of mixed types (continuous and discrete) and unmeasured confounders (due to lack of knowledge or measurement inability).
MGM-FCI-MAX works in two steps (see details in online supplementary materials). First, the undirected graph is calculated over all data (see refs 16 and 26). This step has one regularisation parameter per edge type: continuous-to-continuous, continuous-to-discrete, discrete-to-discrete. To avoid overfitting, we use subsampling (Stable Edge-specific Penalty Selection - StEPS)16 to select parameter values that produce the most stable graph across subsamples. Second is the orientation phase, in which the undirected graph of step 1 is used as the starting point. A modified version of FCI-MAX algorithm orients and removes the edges of the skeleton based on the p values of conditional independence tests we developed for mixed data.27 The p value threshold is also determined using StEPS. Notably, in high dimensional data sets (small sample size, large number of variables) PGMs’ edge prediction accuracy remains high, but orientation accuracy suffers.28
Statistical analysis, model building and evaluation
Statistical analyses were done in R (V.3.4.2). t-Tests and χ2 tests were used to evaluate differences between subject groups in continuous and categorical variables, respectively. In the external validation data set, we performed pairwise receiver operating characteristic (ROC) curve comparisons by using a bootstrap-based test (pROC package).29 Probability density plots for cancer and benign nodule cases were computed using kernel density estimation with a Gaussian kernel in R.
To evaluate the efficiency of MGM-FCI-MAX on the training data set, we used 10X nested cross-validation. Briefly, the training data set is divided into 10 partitions, and for each partition we used the other 90% of the samples to learn an MGM-FCI-MAX graph, then learn the weights of the variables in the Markov blanket around ‘lung cancer status’ (using the MGM-FCI-MAX logistic regression model) and evaluate on the remaining 10% of the samples that were not used for training of this partition.
We compared the prediction accuracy of the MGM-FCI-MAX-derived model with a random forest (RF) classifier (MATLAB TreeBagger class) and with previously published methods, such as the PLCO (Prostate, Lung, Colorectal and Ovarian cancer) model,11 the Bach model,5 and two Brock models12: full and parsimonious. We used the features of these models and we recalculated the coefficients in the same training data sets as MGM-FCI-MAX. For fairness, we also used the originally published coefficients. Asbestos exposure information, used in the Bach model, is not available for PLuSS participants. However, this binary variable has one of the smallest coefficients in the original publication and its removal is not expected to significantly affect the results. Although PLCO and Bach models were originally developed for predicting lung cancer risk, we were interested to see if they can discriminate between lung cancer and benign subjects as well. From the comparison, we excluded the Liverpool Lung Project (LLP) risk model8 because two of its variables were missing from PLuSS (asbestos exposure, prior diagnosis of pneumonia). We also excluded the Pittsburgh predictor13 because, due to PLuSS participants being at high risk, cancer and benign cases had similar smoking history and age (two of its four features).
Results
Graphical models on the PLuSS training cohort identify highly informative variables for lung cancer
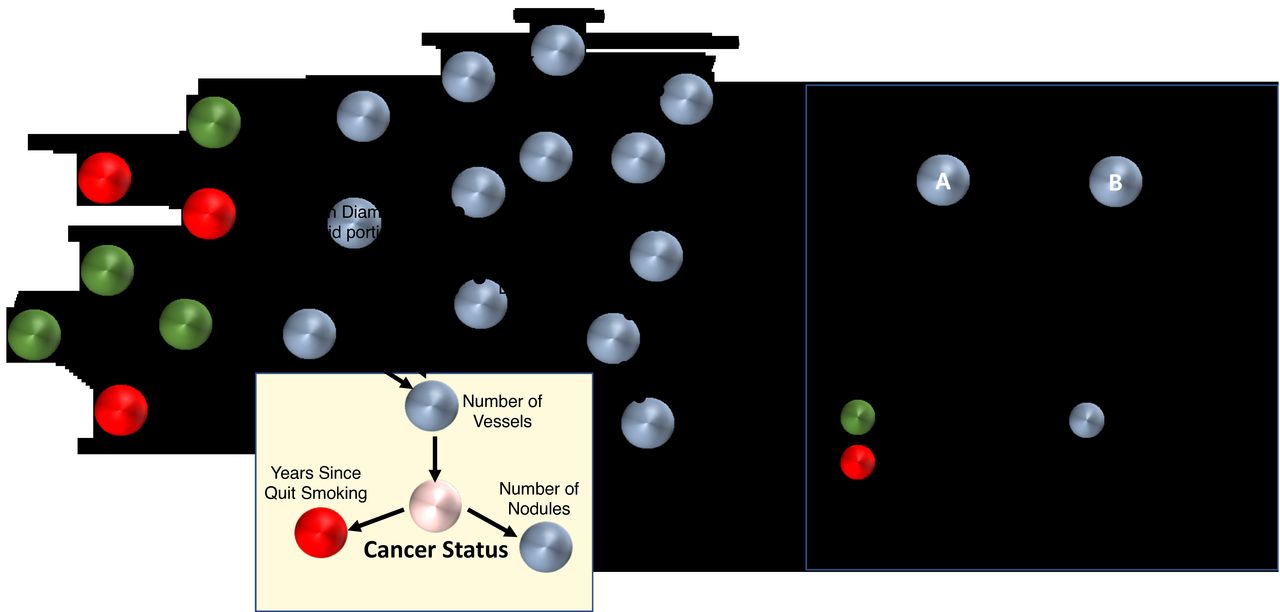
We applied MGM-FCI-MAX on the compendium of demographic, clinical, smoking and LDCT scan variables of the training cohort to learn the interactions among variables. Three variables were directly linked to lung cancer (figure 1): years since (the subject) quit smoking, (total) number of nodules and number of vessels (surrounding the nodule). All three features were statistically significant in a multivariate logistic regression model (table 2), showing that their information is complementary. The number of nodules and the years since the subject quit smoking are both inversely related to lung cancer risk, whereas the number of vessels is positively related. We found that all three predictors had statistically significant coefficients (p<0.05).

The causal graph over all data of the training cohort. Nodes in the yellow box correspond to those directly associated with lung cancer status. A list of the variables used for this analysis is provided in online supplementary materials. Note that besides the edges represented by a direct arrow (A→B), all other edges do not exclude the possibility of a latent confounder. BMI, body mass index.
Characteristics of LCCM features in the training cohort
The model suggests that the number of nodules and the number of vessels could be related to lung cancer, which are supported by recent publications.12 23 However, the number of nodules and the decision to quit smoking come as a result of lung cancer status in the graph. For quit smoking, only 19% of former smokers with benign nodules quit smoking within 2 years of the LDCT scan, whereas 44% of subjects with lung cancer who are former smokers quit smoking. This may indicate that the onset of symptoms from cancer or a cancer precursor influenced the decision to quit smoking. We also note that the current smoker ratios are different in the two groups (64% in cancer cases vs 45% in benign nodules). Another potentially interesting observation from the network is that gender and education may influence pack-years. These predictions are supported by studies which indicate that low education levels and gender can predict the intensity of smoking in individuals30; however, the model suggests that the direction of the causal relationships are inconclusive. Surprisingly, emphysema was not directly linked to ‘lung cancer status’, but this is because emphysema was similar in cancer and benign nodule cases in the training cohort due to these being high-risk individuals (see the Materials and methods section). Regardless, emphysema and bronchitis, two conditions that are difficult to distinguish based on spirometry, are connected in our model, but through an unknown confounder. Note that although there are 13 more LDCT scan variables in the data set, MGM-FCI-MAX finds their information about cancer status to be captured by the number of vessels.
MGM-FCI-MAX identifies stable features that can accurately predict lung cancer
Next, we evaluated MGM-FCI-MAX performance in identifying lung cancer predictive features using 10X nested cross-validation (see the Materials and methods section). We found that the number of nodules and the number of vessels were selected in all 10 rounds and the years since (the subject) quit smoking was selected in 8 (online supplementary table S3). This selection stability suggests that these three variables are highly informative for lung cancer status. On average, MGM-FCI-MAX selected three features in each round of cross-validation (SD=0.67).
In these cross-validation data sets (training cohort), MGM-FCI-MAX performed very well (area under the ROC curve [AUC]=0.882; 25th, 75th percentile=[0.786, 1.00]). Compared with existing published models, MGM-FCI-MAX offers an advantage (figure 2). It is better than all other models and, except for the Brock full model (which uses eight parameters), the differences are significant (figure 2B). Similar results are obtained when we compare MGM-FCI-MAX models with the published models with their original coefficients (online supplementary figure S1). Finally, the RF classifier performed slightly worse than our model (AUC=0.835), but the difference was not statistically significant (p=0.324), which is consistent with previous reports.16
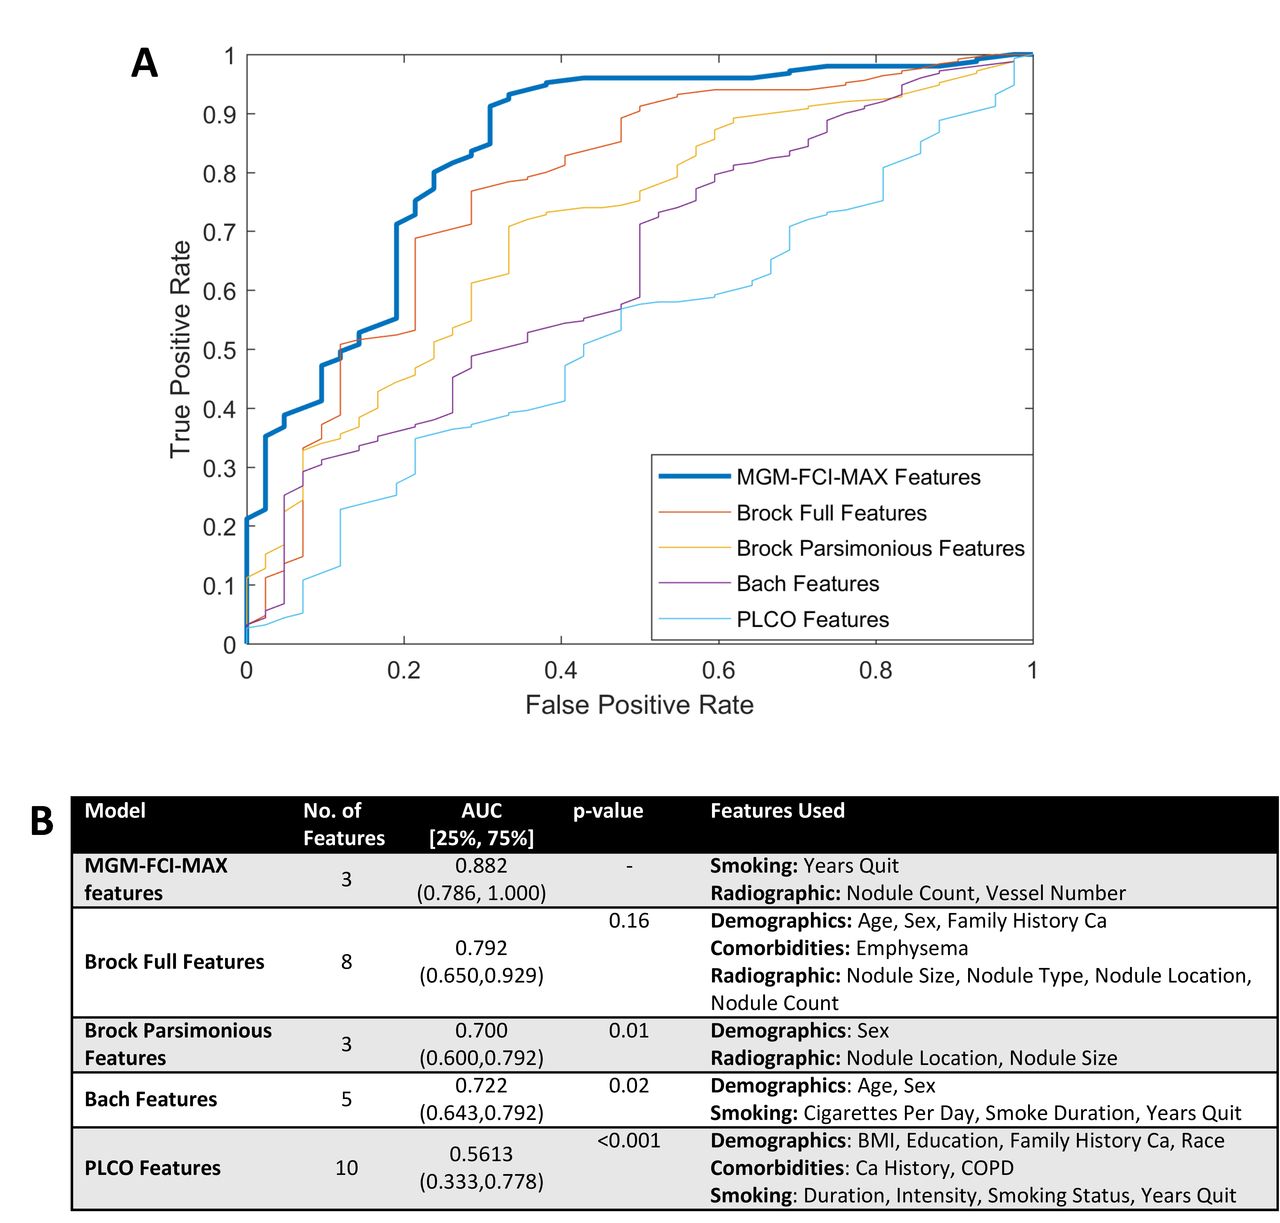
Comparison of MGM-FCI-MAX-derived with retrained lung cancer prediction models on the training cohort. (A) ROC curves were computed using nested 10-fold cross-validation. (B) Model discrimination measured by AUC. AUC, area under the ROC curve; BMI, body mass index; Ca, cancer; ROC, receiver operating characteristics.
LCCM performs significantly better than Brock parsimonious model on the validation cohort
We used the three features identified above in a multivariate logistic regression model to build the LCCM. On the external validation cohort, we compared the prediction accuracy of LCCM with the best performing model in the training phase with comparable number of parameters (Brock parsimonious). We used both the retrained Brock parsimonious model and the one with the originally published coefficients, which were derived from a cohort of 1871 subjects. LCCM was significantly more accurate than both Brock parsimonious models. Specifically, the AUC was 0.903 (±0.061) for LCCM compared with 0.757 (±0.086) and 0.812 (±0.077) for the retrained and original Brock parsimonious models, respectively (online supplementary figure S2), with p values of 0.0025 and 0.0176.
We also compared the LCCM and Brock parsimonious models on all benign nodules in the validation cohort (not just the largest). We evaluate predictions with respect to subject status (ie, for a subject to be called ‘Benign’, all nodules should be predicted ‘Benign’). We find the results to be similar to our main validation cohort as the LCCM (AUC=0.888) is significantly better than the retrained Brock parsimonious model (AUC=0.678, p<0.01) and non-significantly better than the original Brock parsimonious model (AUC=0.843, p=0.225) (online supplementary figure S3). Finally, we compared the LCCM with the Brock parsimonious models on all benign nodules <3 cm in the validation cohort, since this is the current threshold for biopsy. LCCM still maintained its advantage with AUC of 0.871 compared with 0.714 (p<0.01) and 0.823 (p=0.263) for the retrained and original models, respectively (online supplementary figure S4).
LCCM can be used to accurately screen for benign nodules
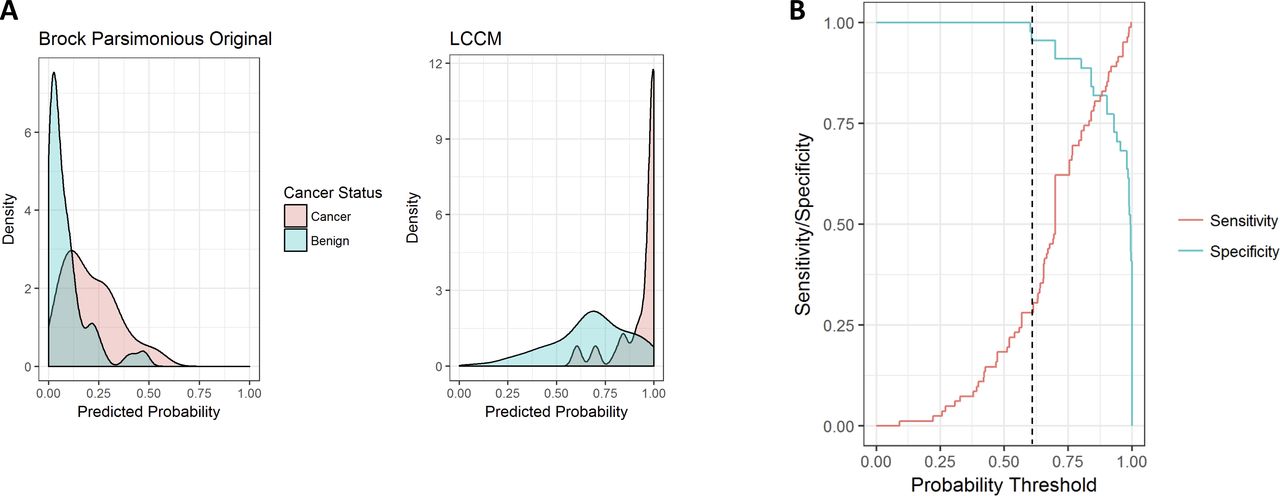
Figure 3A displays the density distribution of the predicted probability scores on the validation cohort. LCCM score is ≥0.9 for 82% of subjects with cancer (red), whereas subjects with benign nodules tend to be more evenly distributed (blue). By contrast, the Brock parsimonious model has skewed score distributions for both. Figure 3A explains why LCCM has better discriminative power than Brock, which indicates that one can set a threshold at which benign nodules can be identified without risk of false negative cancer prediction. This is illustrated better in figure 3B, which plots sensitivity/specificity across changing score thresholds in the validation cohort. At a threshold of 0.609 (dotted line), LCCM correctly identifies 28.3% of benign nodules without misclassifying a single subject with cancer (specificity=1). In terms of cost-effectiveness, this could allow a clinician to potentially bypass short interval follow-up imaging or invasive procedures for nearly a third of subjects with benign nodules without risking a missed cancer diagnosis.

(A) LCCM sensitivity/specificity plots of predictions across probability thresholds (validation cohort). (B) Distributions of predicted lung cancer score across models (validation cohort) for subjects with cancer (red) and benign nodules (blue). Brock parsimonious original refers to the model with the published coefficients. LCCM, Lung Cancer Causal Model.
Discussion
LDCT lung cancer screening has been shown to significantly reduce lung cancer mortality, but the optimal target population and time for subsequent screening(s) remain uncertain. The risk of developing lung cancer has historically been attributed to age and smoking. More recently, factors such as family history, years since smoking cessation, presence of emphysema and environmental exposures (secondhand smoke, asbestos, radon and so on) have been taken into consideration, resulting in several lung cancer risk models to select individuals for lung cancer screening.5–13 Currently, the Brock models are the only ones that incorporate LDCT image features with clinical data to estimate lung cancer risk.12
In this work, we demonstrated two things. First, that PGMs for mixed data can integrate clinical and radiological imaging data and successfully select informative features for lung cancer status. In cross-validation experiments, we showed that our selected models performed better than other published models, and except for the Brock full model the differences were statistically significant. However, the Brock full model uses eight measured variables, whereas our models required two to four, depending on the round of cross-validation. We also compared our model with RF-based models and they performed similarly. Again, the RF models essentially use all parameters. Another important practical advantage of PGM-based models is that unlike regression or machine learning-based models, they could calculate cancer risk score even if some of the predictive variables have undetermined values. This is done by estimating the undetermined values from their parents of the corresponding variable in the graph. For example, in figure 1 model, if the number of vessels is not observable for a given patient, we could estimate it from the mean diameter and irregularity. So the PGM-based method we suggest for selecting variables can be easily used in clinical practice even when some predictor values are missing for certain patients.
Three variables were consistently linked to lung cancer status in the cross-validation experiments: years since (the subject) quit smoking, number of nodules and number of vessels (surrounding a nodule). The association of each of these three variables to lung cancer has been previously noted, and some of them have been individually used in other predictive models. For example, years since the subject quit smoking is well known as a factor inversely related to lung cancer risk (PLCO and Bach models). The number of nodules is known to be inversely correlated with lung cancer risk (Brock model). We recently showed that the number of vessels surrounding a nodule, a new imaging feature, strongly correlates with lung cancer risk.23 This is consistent with the well-known occurrence of angiogenesis and neovascularisation in malignancy.31 32 Emphysema, which is also known to be associated with lung cancer, is not predictive in our model, because the prevalence of emphysema was similar in cancer and benign groups in our training data set. We also note that the number of vessels in our model was more informative for lung cancer than nodule size that Brock models are using, which is depicted in figure 1 by the latter being the parent of the former.
Second, we used these features to build LCCM, a new lung cancer predictor. Tested on an independent validation cohort, LCCM achieved very high accuracy (AUC=0.903) and performed better at discriminating benign and malignant nodules, even when compared with the published Brock parsimonious model, whose parameters were estimated from 1871 subjects. We also showed evidence that the LCCM may be able to confidently identify about 30% of the individuals with benign nodules after the baseline LDCT, without misclassifying any cancers. These individuals with lower likelihood of lung cancer can potentially benefit from longer screening intervals. If validated in a larger population, this ability to rule out cancer in a subset of indeterminate lung nodules would limit short-term follow-up imaging and invasive interventions (one of the major drawbacks of current LDCT screening protocols) and could significantly improve clinical practice. Finally, we tested LCCM in more ‘realistic’ conditions. We applied it on all benign nodules of the control subjects (validation cohort) that were <3 cm (current threshold for biopsy). We found that LCCM maintains high predictability of the patient’s cancer status and is significantly better than the retrained Brock model. The advantage is reduced when it is compared with the original Brock model, which highlights the need for a larger training cohort for LCCM in future studies.
Our study has some limitations. First, we used low-dose (40 mA) CT scans reconstructed at 2.5 mm images, which are thicker and less than ideal for quantitative analysis. The success of LCCM, even against the original Brock parsimonious model, alleviates this concern to some degree. Second, our training cohort was not very large (n=92), but it was fairly balanced between malignant and benign cases and the CT protocol was the same for all subjects. However, confounders might exist. For example, the years since quit smoking prior to LDCT scan is lower in the cancer group (pack-years was similar though). We plan to extend this initial study in the future with analysis of larger cohorts both retrospectively and prospectively. Third, our training cohort was disproportionately Caucasian and race will need to be evaluated in racially diverse cohorts. Fourth, overfitting, a common problem in all machine learning methods, could impact our results. In our case, we avoid (or limit the effect of) overfitting by using subsampling to select the most stable graph in the training cohort. We are also encouraged by the fact that LCCM performs very well on the independent validation cohort. Finally, our study is limited to participants who have undergone lung screening due to high cancer risk (age: 55–77; pack-years: >30; quit: <15 years); thus, LCCM needs to be validated in the broader context of individuals with lung nodules. Regardless, this work demonstrates the utility of PGMs in selecting informative variables in the context of lung cancer detection and shows that a combination of these three features may be a valuable component of highly accurate lung cancer predictors in the future.
Acknowledgments
We would like to thank three anonymous reviewers for their constructive criticism and suggestions, which helped us improve this paper; and Dr. Brenda Diergaarde for critically reading an earlier version of this manuscript. Drs. Panayiotis V. Benos and David O. Wilson are both senior authors.
References
Footnotes
Contributors The study was conceived by PVB and DOW. Data were provided by J-MY, WZ and JP. Analysis was performed by VKR, PVB and DOW. The manuscript was written by VKR, PVB and DOW with contributions from all other authors.
Funding This study was supported by the National Institutes of Health (NIH) Grants U01HL137159 and R01LM012087 to PVB, R21CA197493 and R01HL096613 to JP, and T32CA082084 to VKR; the University of Pittsburgh Specialized Program of Research Excellence (SPORE) in Lung Cancer (NCI P50CA90440); and Cancer Center Core Grant (NCI P30CA047904). The content is solely the responsibility of the authors and does not necessarily represent the official views of the NIH.
Competing interests None declared.
Patient consent for publication Obtained.
Provenance and peer review Not commissioned; externally peer reviewed.