Article Text

Abstract
Background In acute respiratory distress syndrome (ARDS), pulmonary perfusion failure increases physiologic dead space ventilation (VD/VT), leading to a decline of the alveolar CO2 concentration [CO2]iA. Although it has been shown that alveolar hypocapnia contributes to formation of atelectasis and surfactant depletion, a typical complication in ARDS, the underlying mechanism has not been elucidated so far.
Methods In isolated perfused rat lungs, cytosolic or mitochondrial Ca2+ concentrations ([Ca2+]cyt or [Ca2+]mito, respectively) of alveolar epithelial cells (AECs), surfactant secretion and the projected area of alveoli were quantified by real-time fluorescence or bright-field imaging (n=3–7 per group). In ventilated White New Zealand rabbits, the left pulmonary artery was ligated and the size of subpleural alveoli was measured by intravital microscopy (n=4 per group). Surfactant secretion was determined in the bronchoalveolar lavage (BAL) by western blot.
Results Low [CO2]iA decreased [Ca2+]cyt and increased [Ca2+]mito in AECs, leading to reduction of Ca2+-dependent surfactant secretion, and alveolar ventilation in situ. Mitochondrial inhibition by ruthenium red or rotenone blocked these responses indicating that mitochondria are key players in CO2 sensing. Furthermore, ligature of the pulmonary artery of rabbits decreased alveolar ventilation, surfactant secretion and lung compliance in vivo. Addition of 5% CO2 to the inspiratory gas inhibited these responses.
Conclusions Accordingly, we provide evidence that alveolar hypocapnia leads to a Ca2+ shift from the cytosol into mitochondria. The subsequent decline of [Ca2+]cyt reduces surfactant secretion and thus regional ventilation in lung regions with high VD/VT. Additionally, the regional hypoventilation provoked by perfusion failure can be inhibited by inspiratory CO2 application.
- ARDS
- lung physiology
- surfactant protein
Statistics from Altmetric.com
Key messages
What is the key question?
How does perfusion failure-induced alveolar hypocapnia, commonly seen in dead space ventilation in acute respiratory distress syndrome (ARDS), affect regional ventilation?
What is the bottom line?
As a consequence of dead space ventilation, alveolar hypocapnia shifts alveolar epithelial calcium from the cytosol into mitochondria and subsequently reduces surfactant secretion and ventilation in the affected lung region.
Why read on?
Because, as previously shown, the hypocapnia-induced mitochondrial Ca2+uptake also induces apoptosis of alveolar epithelial cells, the formation of atelectasis, commonly seen in ARDS, could ameliorate apoptosis by prevention of alveolar hypocapnia in dead space ventilation and therefore, recruitment of non-perfused atelectatic lung regions could contribute to ventilator-associated lung injury.
Background
Acute respiratory distress syndrome (ARDS) is a severe lung inflammatory disorder that affects patients in the intensive care unit. The leading causes are pneumonia and sepsis. The incidence is about 80 per 100.000 per year. Since only supportive therapy is available, the mortality rate remains between 30% and 50%.1–4 Clinically, ARDS causes non-cardiogenic pulmonary oedema and gas exchange failure. In addition, alveolar-reticular opacifications as an equivalent of poorly inflated areas are typical in CT scans of patients with ARDS.5 Furthermore, loss of surfactant, which is produced by alveolar epithelial cells (AECs), potentiates the alveolar-collapsing tendency of air–liquid surface tension, can be detected in ARDS, and determines the outcome of affected patients.
It has been shown that ARDS is associated with an increase of the physiologic dead space fraction (VD/VT), at least in part due to inflammation-induced intravascular coagulation and thus perfusion failure. Importantly, patients with high VD/VT have a higher mortality rate than patients with low VD/VT. Alveolar hypocapnia may worsen outcomes, especially in critically ill patients.6 7 In the context of pulmonary diseases, alveolar hypocapnia causes parenchymal injury and contributes to the formation of atelectasis due to depletion of lamellar bodies (LBs) and reduction of surfactant secretion.8–10
In patients with ARDS, although alveolar hypocapnia-induced surfactant depletion seems to be likely in lung regions with high VD/VT, the underlying mechanism has not been elucidated. In the context of alveolar hypocapnia and the regulation of surfactant secretion, the cytosolic and mitochondrial Ca2+signalling need to be considered: surfactant secretion from AECs type 2 by LB exocytosis is triggered by an increase of cytosolic Ca2+ concentration ([Ca2+]cyt).11–13 Mitochondria have been proposed to play a crucial role in LB exocytosis because they regulate [Ca2+]cyt by sequestering Ca2+ and releasing it to the cytosol.14–19
Previous investigations from our group have shown that hypocapnia induces a decrease of [Ca2+]cyt in AECs that was revealed by an isocitrate dehydrogenase-induced Ca2+ shift into mitochondria.20 However, it is still unclear whether pulmonary perfusion failure results in a hypocapnia-mediated and Ca2+-regulated decrease of surfactant secretion. To answer this question, we conducted a prospective experimental study in rats and rabbits.
Materials and methods
Detailed methods are described in online supplementary methods.
Supplementary file 1
Animals
Male Sprague-Dawley rats (350 g, 4–5 months old) and assorted sexes of White New Zealand rabbits (2.5 kg, 6–9 months old) were purchased from Charles River (Sulzfeld, Germany). After review and approval by the local ethics committee and the government of Hamburg (approval numbers: 053/07 and 81/08), all animals were treated humanely in accordance with ‘principles of laboratory animal care’ (NIH Publication No 86–23, revised 1985), with the Animal Research: Reporting of In Vivo Experiments (ARRIVE) guidelines (www.nc3rs.org.uk/ARRIVE) and with the German legislation on protection of laboratory animals. Animals were held in the university animal facility under specific pathogen-free conditions and at 12-hour day/night cycle. Further, animals had free access to food and water. All experiments were conducted in the university laboratory.
Materials
Fura 2-AM, LysoTracker Green (LTG), MitoTracker Green (MTG) and rhod-2 were purchased from Molecular probes (Invitrogen, Karlsruhe, Germany). Rotenone, ruthenium red and BAPTA-AM (1, 2-bis-(2-aminophenoxy)ethane-N, N,N′,N′-tetraacetic acid tetrakis(acetoxymethylester)) were purchased from Sigma-Aldrich (Germany). Vehicle for dyes and other agents was HEPES buffer (150 mmol/L Na+, 5 mmol/L K+, 1.0 mmol/L Ca2+, 1 mmol/L Mg2+, and 20 mmol/L HEPES at pH 7.4) containing 4% dextran (70 kDa) and 1% fetal bovine serum at pH 7.4 and osmolarity of 295 mOsm. All esterified fluorescent probes were prepared as stock solutions in pluronic.
Study design
In situ experiments and prospective randomised animal investigation.
In situ experiments
A previously reported method was used to isolate lungs from Sprague-Dawley rats, perfuse them with autologous blood at 37°C and constantly inflate them with a normocapnic gas mixture of 30% O2, 5% CO2 and 65% N2 under baseline conditions.11 21–23 For hypocapnic conditions, the inflation gas was switched to a mixture of 30% O2, 0% CO2 and 70% N2.
Using epifluorescence microscopy (Axiotech; Zeiss, Göttingen, Germany), we quantified in AECs [Ca2+]cyt by the fura 2 and [Ca2+]mito by the rhod-2 method.22 24 To determine surfactant secretion in situ, we imaged single alveolar cells from isolated blood-perfused rat lung through the loss of cell fluorescence of intra-alveolar microinjected LTG.25 To measure the alveolar projected area, we took light microscopy pictures of the lung surface with a 20× objective lens and measured the size of the projected alveolar area by using Metamorph software (Molecular Device,Downington, Pennsylvania, USA).
In isolated perfused lungs, the following pharmacological interventions were performed: ruthenium red, an inhibitor of the Ca2+ uniporter at the mitochondrial membrane; rotenone, an inhibitor of the respiratory chain; or the membrane-permeating Ca2+ chelator BAPTA-AM in Ca2+-free buffer (150 mmol/L Na+, 5 mmol/L K+, 1 mmol/L Mg2+ and 20 mmol/L HEPES at pH 7.4) were intra-alveolarly infused 10 min before changing [CO2]iA, n=3–7 per group.
In vivo experiments
A transparent thoracic window was implanted in anaesthetised White New Zealand rabbits and subpleural alveoli were sequentially recorded with a fluorescence microscope (Axiotech).26 27 The size of the projected alveolar area was measured by using Metamorph software (Molecular Device, Downington, Pennsylvania, USA). The rabbits were randomised into three groups: (1) sham operation (control group), (2) pulmonary artery ligature (PA ligature group) and (3) PA ligature with inspiratory application of CO2 (therapy group), n=4 per group. Compliance and inspiratory pressure were measured by the respirator (Zeus, Dräger, Lübeck, Germany) and changes in projected alveolar area were visualised by light microscopy at baseline and after 120 min. At the end of videomicroscopy, the animals were sacrificed and the lungs were lavaged for the measurement of the surfactant protein (SP) B and D fraction by western blotting.
Statistical analysis
All data are represented as means±SDs. Data analysis was performed using SigmaStat (Systat Software, San Jose, California, USA). Comparisons between the groups were tested using analysis of variance on ranks followed by a pairwise multiple comparison. Repeated measurements were tested using the Mann-Whitney rank-sum test. P values <0.05 were considered statistically significant. There was no power calculation because there was no hypothesis testing in exploratory studies.
Results
Alveolar CO2 regulates cytosolic calcium in AECs in rats in situ
We determined [Ca2+]cyt in AECs of intact alveoli by imaging isolated and blood-perfused lungs. After conditions were switched from alveolar normocapnic to hypocapnic by reducing the inspiratory CO2 fraction from 5% to 0% and after a lung venous pCO2 of under 10 mm Hg was established, [Ca2+]cyt decreased in AECs by 25%±5% versus baseline conditions within 10 min. This decrease was reversible after the inspiratory CO2 fraction was increased back to 5% and the pCO2 was increased to normocapnic values (figure 1A–C, online supplementary video S1, online supplementary table S1). After microinjection of the mitochondrial Ca2+ uniporter inhibitor ruthenium red into the alveolus of the intact lung, hypocapnia induced a 10%±2% decrease in [Ca2+]cyt decrease in comparison to baseline values. Alveolar application of the mitochondrial complex I inhibitor rotenone blocked the hypocapnia-induced [Ca2+]cyt decrease completely (Δ[Ca2+]cyt: 1%±6% vs baseline) (figure 1D, online supplementary table S1). Under normocapnic conditions, [Ca2+]cyt stayed stable over 120 min (Δ [Ca2+]cyt: 2%±2% vs baseline).
Supplementary file 2
Supplementary file 3

[Ca2+]cyt in AECs in situ. (A) Images of a single intact alveolus on the surface of isolated rat lungs show the pseudocolour-coded 340:380 ratio for fura 2-loaded alveolar epithelial cells under normocapnic ([CO2]iA: 5 Vol%) and hypocapnic ([CO2]iA: 0 Vol%) conditions. Alveolar septum is indicated (arrows). Images were taken from the surface of isolated and blood-perfused lungs. (B) Tracing of mean [Ca2+]cyt under normocapnic and hypocapnic conditions. Regarding [CO2]iA was as indicated. (C+D) Group data of maximal [Ca2+]cyt responses as percentage chance of normocapnic baseline conditions 15 min following onset of hypocapnic or normocapnic conditions with [CO2]iA of 0 or 5 Vol%, as indicated. Alveolar microinjection of the mitochondrial inhibitors ruthenium red (50 µM) or rotenone (1 µM) inhibited the hypocapnia ([CO2]iA: 0 Vol%)-induced reduction of [Ca2+]cyt in situ. Mean±SD, #p<0.05 versus normocapnia at [CO2]iA of 5 Vol% (baseline), *p<0.05 versus normocapnia at [CO2]iA of 5 Vol% (control), ‡p<0.05 versus hypocapnia at [CO2]iA of 0 Vol% alone. Normocapnia alone: n=5; hypocapnia alone: n=7; hypocapnia+ruthenium red: n=3; hypocapnia+rotenone: n=7. AECs , alveolar epithelial cells; [Ca2+]cyt, cytosolic Ca2+ concentration; [CO2]iA, alveolar CO2 concentration.
To verify the hypocapnia-induced Ca2+shift from the cytosol into the mitochondria, we measured mitochondrial Ca2+ concentration [Ca2+]mito in relation of CO2. In AECs of intact alveoli, the switch from normocapnic to hypocapnic conditions induced a 17%±3% increase in rhod-2 fluorescence intensity versus baseline, equivalent to a [Ca2+]mito increase which was opposite to the respective [Ca2+]cyt decrease (figure 2A–C, online supplementary table S2). In accordance with [Ca2+]cyto, after switching back to normocapnic conditions, [Ca2+]mito returned to baseline values within minutes. The mitochondrial localisation of the rhod-2 fluorescence was demonstrated by its colocalisation with the mitochondrial marker MTG and by the observation that the rhod-2 fluorescence increase was inhibited by rotenone (figure 2B,C, online supplementary table S2). In contrast to hypocapnia alone, the pretreatment of the alveoli with rotenone resulted in an 8%±5% decrease in rhod-2 fluorescence versus baseline. Under normocapnic conditions, rhod-2 fluorescence intensity did not change during the 120 min study period.
Supplementary file 4
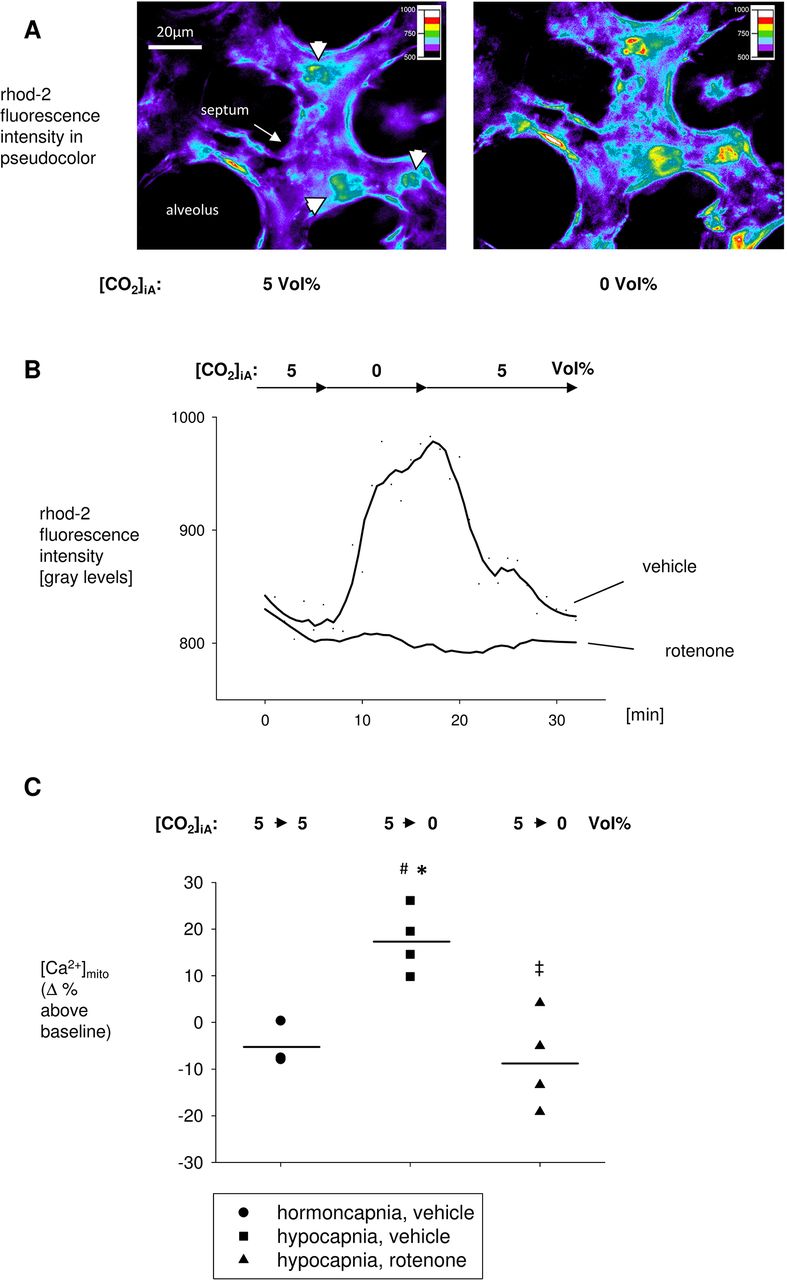
[Ca2+]mito in AECs in situ. (A) Images of a single intact alveolus on the surface of isolated rat lungs show the pseudocolour-coded fluorescence intensity of rhod-2-loaded AECs (arrow heads) under normocapnic ([CO2]iA: 5 Vol%) and hypocapnic ([CO2]iA: 0 Vol%) conditions. Alveolar septum (arrow) and AECs type 2 (arrow heads) are indicated. Images were taken from the surface of isolated and blood-perfused rat lungs. (B) Tracing of rhod-2 fluorescence intensity under normocapnic and hypocapnic conditions, as indicated. AECs were pretreated with vehicle or rotenone (50 µM), as indicated. (C) Group data of maximal [Ca2+]mito responses as percentage change of normocapnic baseline conditions 15 min following onset of normocapnic (control) or hypocapnic conditions with [CO2]iA of 5 or 0 Vol%, respectively. AECs were pretreated with vehicle or rotenone (50 µM), as indicated. Mean±SD, #p<0.05 versus normocapnia at [CO2]iA of 5 Vol% (baseline), *p<0.05 versus normocapnia at [CO2]iA of 5 Vol% (control), ‡p<0.05 versus hypocapnia at [CO2]iA of 0 Vol% alone. Normocapnia alone: n=3, hypocapnia alone: n=4, hypocapnia+rotenone: n=4. AECs, alveolar epithelial cells; [Ca2+]mito, mitochondrial Ca2+ concentration; [CO2 ]iA, alveolar CO2 concentration.
CO2-mediated mitochondrial Ca2+shift regulates surfactant secretion in rats in situ
Figure 3A shows images of AECs type 2 in intact alveoli after alveolar loading with LTG and specific LB staining. Under normocapnic conditions, LTG intensity steadily decreased by 51%±1% versus baseline within 20 min, indicating a certain level of surfactant secretion. Under hypocapnic conditions, LTG fluorescence intensity decreased only by 32%±1% within 20 min. Thus, hypocapnia induced an inhibition of the LTG fluorescence decrease, indicating a reduction of surfactant secretion in situ (figure 3B,C, online supplementary table S3). To elucidate whether the calcium shift from the cytosol to the mitochondria was responsible for the reduction of surfactant secretion during hypocapnia, we first tested if calcium regulated surfactant secretion. For this, we intra-alveolarly infused the intracellular calcium chelator BAPTA-AM (40 µM) and measured LTG fluorescence intensity again, under normocapnic conditions. Under these conditions, LTG fluorescence stayed stable, indicating that surfactant secretion ceased (ΔLTG fluorescence intensity 20 min after onset of hypocapnia vs baseline: −16%±2%) (figure 3C, online supplementary table S3). We also pretreated the AECs with the mitochondrial inhibitor rotenone. This procedure blocked the hypocapnia-induced reduction of surfactant secretion (ΔLTG fluorescence intensity 20 min after onset of hypocapnia vs baseline: −49%±1%) (figure 3C, online supplementary table S3). Furthermore, the rate of surfactant secretion under these conditions was similar to that under control conditions (figure 3C, online supplementary table S3).
Supplementary file 5

Surfactant secretion in AECs in situ. (A) Image shows LTG-labelled lamellar bodies (green fluorescence, arrows) from AEC type II in an intact alveolus on the surface of isolated rat lungs. Dotted lines are alveolar margins as detected in bright-field images obtained in parallel. (B) Colour-coded images of a single AEC type II after alveolar microinjection of LTG. Pictures were taken from an intact rat alveolus under baseline conditions with an alveolar CO2 concentration of 5 Vol% and 20 min after switching to 0 or 10 Vol% or staying at 5 Vol%. (C) Time dependency of LTG intensity. Data are mean±SD. LTG intensity decreases equivalent to constant surfactant secretion under normocapnic conditions. Hypocapnia induces an inhibition of surfactant secretion in situ. Hypocapnia-induced reduction of surfactant secretion is blocked by rotenone (50 µM) microinjected into the alveolus. Normocapnic surfactant secretion is blocked by BAPTA (40 µM) microinjected into the alveolus. *p<0.05 versus 5 Vol% [CO2]iA. $p<0.05 versus 0 Vol% [CO2]iA. n=4 for each group. AECs, alveolar epithelial cells; BAPTA, 1, 2-bis-(2-aminophenoxy)ethane-N,N,N′,N′-tetraacetic acid; LTG, LysoTracker Green; [CO2 ]iA, alveolar CO2 concentration.
Hypocapnia reduces alveolar ventilation in rats in situ
To elucidate the effect of hypocapnia-induced reduction of surfactant secretion on alveolar ventilation, we performed bright-field microscopy of a specific lung area at baseline and 2 hours of exposure to normocapnia (40 mm Hg pCO2) or hypocapnia (<10 mm Hg pCO2). Hypocapnia reduced the projected alveolar area by 28%±1% compared with the normocapnia state (figure 4A, online supplementary table S4). In contrast, in alveoli treated with rotenone, hypocapnia had no effect on the projected alveolar area (figure 4A,B, online supplementary table S4) (Δ projected alveolar area 2 hours after onset of hypocapnia vs baseline: 0%±2%). Under normocapnic control conditions, the projected alveolar area stayed stable (Δ projected alveolar area 2 hours after onset of hypocapnia vs baseline: 4%±1%).
Supplementary file 6

Alveolar size in response to hypocapnia in situ. (A) Bright-field image of the isolated rat lung surface under baseline conditions and 120 min after intervention as indicated. Arrows indicate identical alveoli before (normocapnic conditions) and after collapse (hypocapnic conditions). (B) Hypocapnia of 0 Vol% [CO2]iA reduces the projected alveolar area up to about 21% versus 5 Vol% [CO2]iA after 2 hours of exposure in situ. Hypocapnia has no effect on the projected alveolar area in rotenone (50 µM)-pretreated alveoli. Data are mean±SD. #p<0.05 versus normocapnia at [CO2]iA of 5 Vol% (baseline), *p<0.05 versus normocapnia at [CO2]iA of 5 Vol% (control), ‡p<0.05 versus hypocapnia at [CO2]iA of 0 Vol% alone. Normocapnia alone: n=4, hypocapnia alone: n=6, hypocapnia+rotenone: n=6. [CO2 ]iA, alveolar CO2 concentration.
Ligature of the PA reduces surfactant secretion and alveolar projected surface area in White New Zealand rabbits in vivo
The concentrations of SP-B and SP-D in BAL from rabbit lungs 2 hours after ligation of the PA were 40% less than in control lungs. This response was inhibited by ventilation with 5% (figure 5A–D). Intravital microscopy of the lung surface of volume-controlled ventilated rabbits showed that after PA ligation for 2 hours, the projected alveolar surface area decreased by 42%±2%. In contrast, inspiratory CO2 admixture inhibited this decrease (Δ projected alveolar area 2 hours after ligation of the PA in combination with CO2 insufflation vs baseline: 4%±2%) (figure 6A,B, online supplementary table S5). In sham-operated control rabbits, the projected alveolar surface area stayed stable over 2 hours (Δ projected alveolar area 2 hours after sham operation vs baseline: −1%±2%) (figure 6A, B, online supplementary table S5).
Supplementary file 7
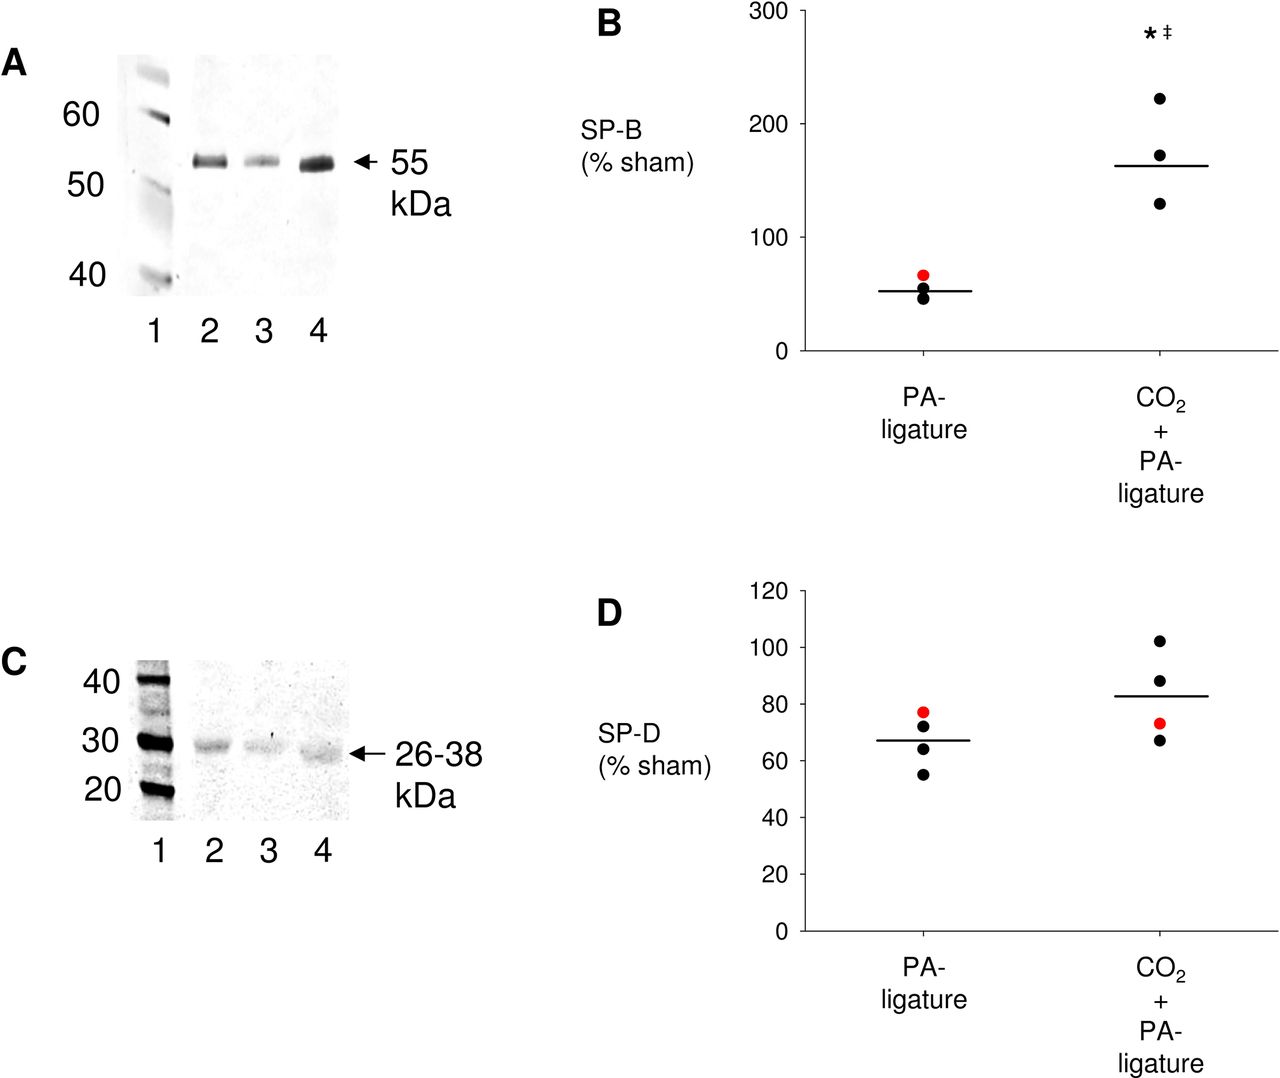
Surfactant secretion after pulmonary artery (PA) ligation in White New Zealand rabbits in vivo. (A) Representative western blot of surfactant protein B (SP-B) in bronchoalveolar lavage (BAL). Lane 1: molecular weight ladder, lane 2: sham, lane 3: PA ligature, lane 4: CO2 insufflation+PA ligature. (B) Group data analysis of SP-B density, data are means±SDs, black dot: male rabbit, red dot: female rabbit. *p<0.05% versus sham, ‡p<0.05 versus PA ligation+CO2: n=4 per group. (C) Representative western blot of surfactant protein D (SP-D) in rabbit BAL. Lane 1: molecular weight ladder, lane 2: sham, lane 3: PA ligature, lane 4: CO2 insufflation+PA ligature. (D) Group data analysis of SP-D density, data are means±SDs, black dot: male rabbit, red dot: female rabbit. *p<0.05% versus sham: n=4 per group.
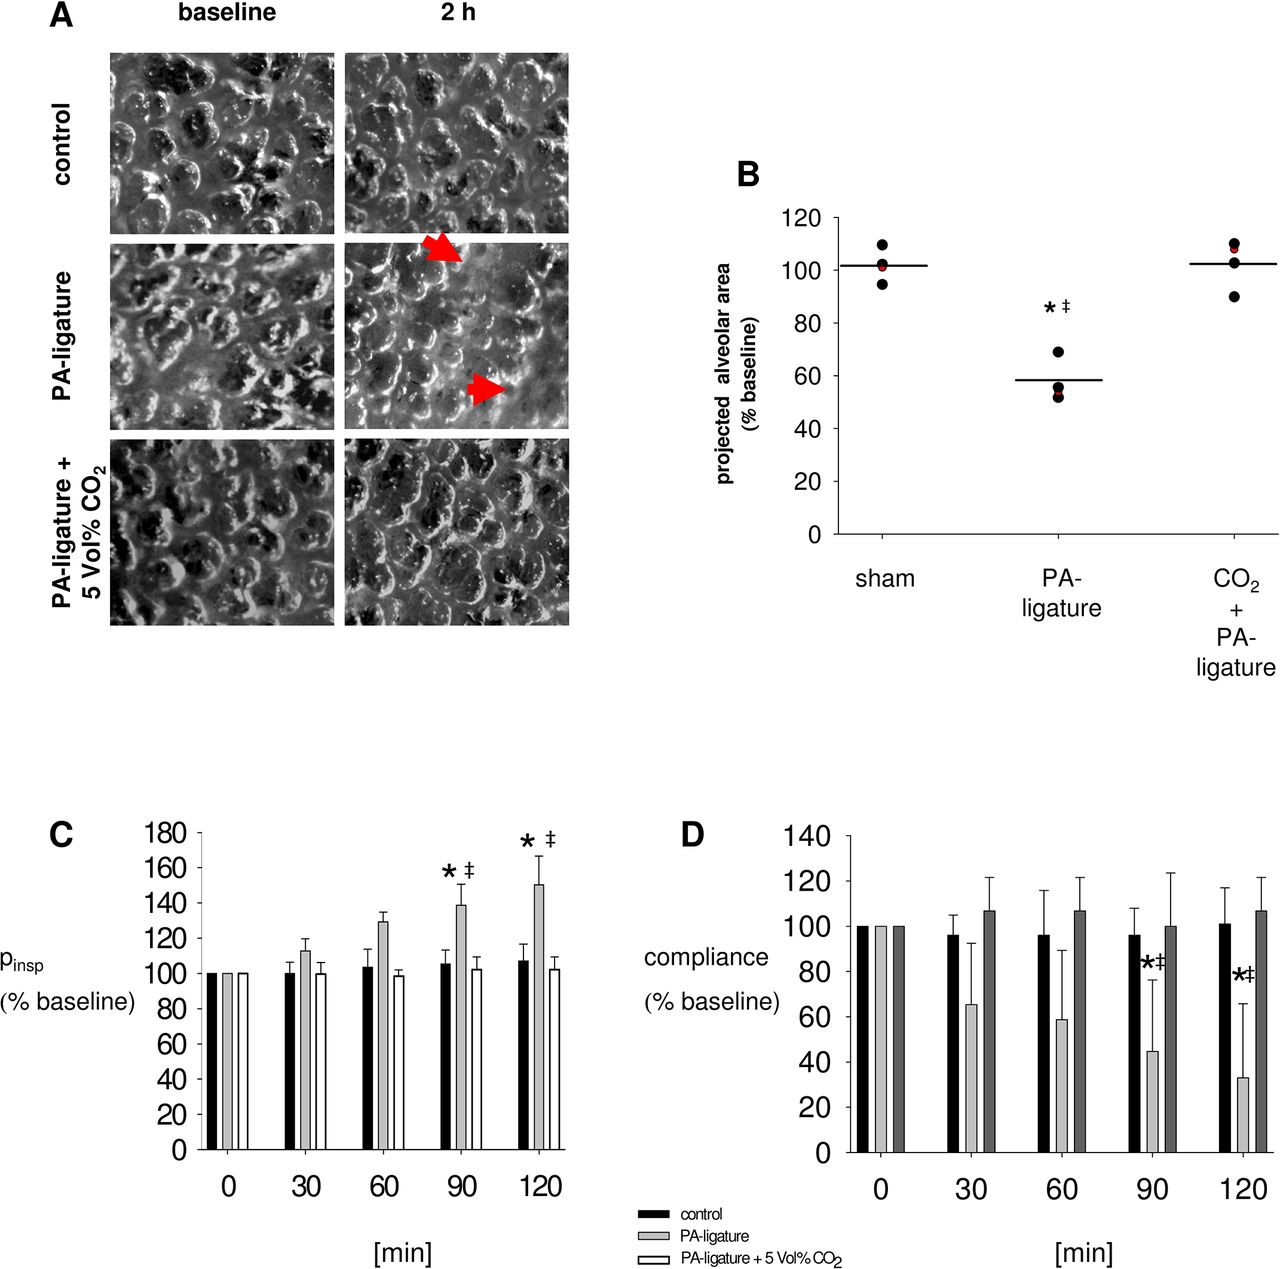
Ventilation after pulmonary artery (PA) ligation in vivo. (A) Intravital bright-field image of the lung surface of White New Zealand rabbits. Microscopy was performed through a thoracic window implanted into the left chest wall of a rabbit. Pictures were taken under baseline conditions and 120 min following sham dissection (control) or ligation of the ipsilateral PA with or without 5 Vol% CO2 insufflation. Arrows indicate atelectatic lung areas. (B) Group data of the projected alveolar area under baseline conditions and 120 min following sham dissection (control) or ligation of the ipsilateral PA (PA ligation) without or with 5 Vol% CO2 insufflation. Data are means±SDs, black dot: male rabbit, red dot: female rabbit, *p<0.05 versus control, ‡p<0.05 versus PA ligation+CO2. n=4. (C, D) Group data analysis of inspiratory pressure (pinsp) and compliance under baseline conditions and 120 min following sham dissection (control) or ligation of the ipsilateral PA with or without CO2 insufflation. Data are means±SDs. *p<0.05% versus control, ‡p<0.05 versus PA ligature+5 Vol% CO2. n=4.
Ligature of the PA increases inspiratory pressure and reduces compliance in the ipsilateral lung of White New Zealand rabbits in vivo
Two hours after ligation of the PA with consecutive intra-alveolar hypocapnia, inspiratory pressure increased by 50%±8% and compliance decreased by 62%±16% versus baseline in the ipsilateral lung in vivo (figure 6C,D). In contrast, both responses were inhibited by the inspiratory CO2 admixture of 5% (figure 6C,D) (ΔPinsp 2 hours after PA ligation vs baseline in CO2-treated animals: 2%±3%; Δ compliance 2 hours after PA ligation vs baseline in CO2-treated animals: 6%±7%).
Discussion
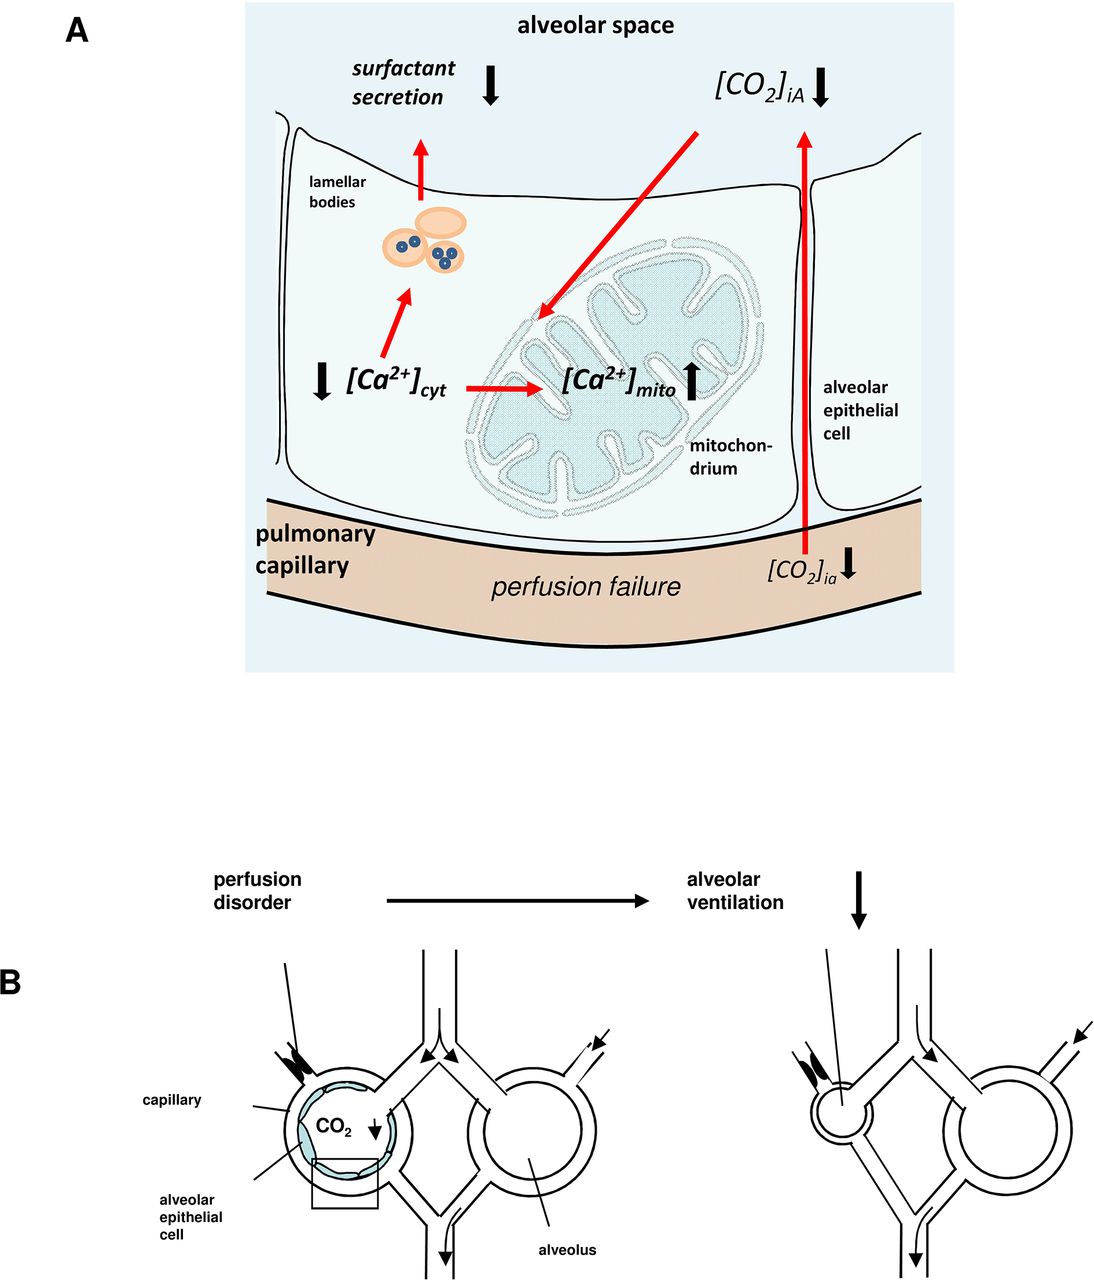
In this study, we provide evidence that in isolated perfused rat lungs, AECs sense changes in alveolar CO2 concentration. When alveolar CO2 declines, as occurs in dead space ventilation, AECs respond with a mitochondrially triggered decrease of [Ca2+]cyt and thus reduction of both LB exocytosis and alveolar ventilation (figure 7A, B). To our knowledge, this demonstration of CO2-induced Ca2+ signalling in AECs is the first reported real-time imaging of pulmonary AECs in the intact lung. Using our model of isolated and blood-perfused rat lung, we could not keep the pH constant in the alveolar epithelial-lining fluid. Thus, we could not differentiate whether the Ca2+ effect was induced by pH or CO2. However, in earlier experiments, we measured [Ca2+]cyt in primary isolated AECs type 2 and in A549 cells under several CO2 and pH conditions, in order to differentiate whether the Ca2+ responses in AECs were directly CO2 rather than pH mediated.20 Our findings indicate that changing the CO2 tension and keeping the pH constant at 7.4 induced the same [Ca2+]cyt response as the in situ situation and in unbuffered primary isolated rat AECs.20 To determine the underlying Ca2+-signalling mechanism, we considered the role of mitochondria, an important [Ca2+]cyt-modifying cell organelle. We showed that on AECs of intact alveoli, hypocapnia was accompanied by a [Ca2+]cyt decrease and by a [Ca2+]mito increase. This [Ca2+]cyt response could be inhibited by the mitochondrial Ca2+ uniporter inhibitor ruthenium red or by the complex 1 inhibitor rotenone, indicating a Ca2+ shift from the cytosol into mitochondria. The inhibitory effect of ruthenium red was less effective than that of rotenone, which can be explained by their different cell permeability characteristics.

(A) Sequence of events underlying Ca2+-dependent [CO2]iA sensing mechanism. Alveolar perfusion failure leads to alveolar hypocapnia. Alveolar hypocapnia induced a calcium shift from cytosol into the mitochondrium (II). Decrease of [Ca2+]cyt results in a reduction of Ca2+-dependent surfactant secretion (III). (B) The drop of [CO2]iA and the subsequent decrease of surfactant secretion results in a reduction of alveolar ventilation and thus ventilation/perfusion mismatch.
Under hypocapnic conditions, the [Ca2+]cyt decrease was associated with a reduction of LB secretion. The LTG fluorescence decrease was completely blocked by the cytosolic Ca2+ chelator BAPTA, indicating that CO2 regulates LB secretion in a Ca2+-dependent manner. Although Ca2+ independent exocytosis involving protein kinase C-dependent or cyclic AMP-dependent mechanisms might occur, several studies have reported that Ca2+ is a critical stimulus for LB secretion.11–13
During hypocapnia, rotenone blocked the Ca2+ shift from the cytosol to the mitochondria and the inhibition of LB secretion. We therefore conclude that mitochondria regulate LB secretion by modifying [Ca2+]cyt in a CO2-dependent fashion because cytosolic Ca2+ chelation abolished LB secretion. Rotenone is known to inhibit mitochondrial transmembrane potential (ΔΨ) and thus ATP production. ATP induces surfactant secretion binding to purinergic receptors.28 However, in our experiments, this mechanism does not play a relevant role because LB secretion was enhanced and not inhibited after rotenone application. ATP is also required for the endoplasmic Ca2+ uptake evoked by Ca2+ ATPase. A potential influence of rotenone on LB secretion through inhibition of endoplasmic Ca2+ uptake is also unlikely because [Ca2+]cyt did not change after rotenone was applied.
Similarly during hypocapnia LB secretion, the mean projected alveolar area decreased and was also blocked by rotenone. Since surfactant reduces alveolar surface tension, it is likely that at constant alveolar pressure, as in our experiments, the decrease of LB secretion directly caused the hypocapnia-induced reduction of the alveolar projected area.
In contrast to the SP-B, hypocapnia did not affect SP-D secretion. A possible explanation for this missing effect could be that secretion of the hydrophilic SP-D is LB independent, whereas SP-B is not. SP-D and SP-A are collectins (collagen-containing C-type lectins) and are involved in the innate immune response in the lung. In contrast, SP-B and SP-C regulate the surface lipid film and interfacial surface tension. SP-D has a dual function in host defense and in regulation of the pulmonary surfactant secretion.29–33
Tsang et al showed in piglets that an acute pulmonary thrombembolism causes a compensatory ventilation shift out of non-perfused lung regions that is initiated by a hypocapnia-induced bronchoconstriction.34 We assume that in our model, bronchoconstriction is not of significant relevance because rotenone, which was administered directly into to the alveolus by bypassing the bronchioli, inhibited the hypocapnia-induced reduction of the projected alveolar area. It is important to consider that the buffer in which rotenone is dissolved interacts with the alveolar lining fluid. Thus, alveoli from the comparison groups were also treated with vehicle. However, the potential buffer-induced dilution of surfactant might counter the inhibitory effect of rotenone. Our interpretations are limited to a two-dimensional analysis of three-dimensional alveolar geometry. Nevertheless, assuming a spherical shape of alveoli, changes of the projected area would signify even higher changes in alveolar volume. Therefore, the measurement of the projected alveolar area might under-represent the alveolar ventilation. Collectively, our findings provide the first evidence that mitochondria regulate LB secretion and thus alveolar ventilation in a CO2-dependent manner.
In accordance with the in situ findings, PA occlusion resulted in a decrease of the projected alveolar area, indicating reduced ventilation in the non-perfused lung area. This finding confirms reports by several authors. Bruns and Sauerbruch were probably the first; in 1911, they described that the ligature of a PA branch in dogs resulted in a collapse of the corresponding pulmonary lobe.35 In 2009, Tsang et al reported that alteration of regional CO2 tension correlates with the changes of regional ventilation.34 They, too, considered that a hypocapnia-induced bronchoconstriction was responsible for the ventilation reduction. We cannot exclude this mechanism in our experiments. However, we found that the decrease in alveolar ventilation following PA ligature was accompanied by reduced surfactant protein concentration in the BAL and that these responses were inhibited by adding CO2 into the inspired gas. Since surfactant reduces alveolar surface tension, we conclude that this mechanism plays at least a partial role in adapting ventilation to changes in perfusion.
In summary, in AECs hypocapnia shifts cytosolic Ca2+ into mitochondria and thus reduces LB secretion. We conclude that this mechanism regulates the reduction of ventilation in lung areas with perfusion failure in order to reduce ventilation/perfusion mismatch and thus optimise gas exchange. Because as previously shown hypocapnia induces apoptosis of AECs due to mitochondrial Ca2+ overload we speculate that reduction of ventilation in non-perfused lung areas could be a protective mechanism, for example, in ARDS.20 Furthermore, recruitment of atelectasis in non-perfused lung regions could contribute to ventilator-associated lung injury.
Acknowledgments
We thank Monika Weber, Kirsten Pfeiffer-Drenkhahn, Claudia Lüchau and Sonja Schuppart for their excellent technical assistance.
References
Footnotes
MK and ST contributed equally.
Contributors KH, AEG and RK conceived the study. ST, LS-U and RK designed the study. ST, MK, M-OT, PK, KH, and LS-U acquired the data. ST, MK, CO and RK analysed the data. ST, MK, CO and RK interpreted the data. ST, MK, SS and RK drafted the manuscript. All authors critically revised the manuscript for content and approved the manuscript for publication.
Funding This work was supported by the Else Kröner-Fresenius-Stiftung and the Johanna und Fritz Buch Gedächtnis-Stiftung to RK.
Competing interests None declared.
Patient consent Not required.
Ethics approval German legislation on protection of laboratory animals.
Provenance and peer review Not commissioned; externally peer reviewed.