Article Text

Abstract
Background: The incremental shuttle walking test (ISWT) is used to assess exercise capacity in patients with chronic obstructive pulmonary disease (COPD) and is employed as an outcome measure for pulmonary rehabilitation. This study was designed to establish the minimum clinically important difference for the ISWT.
Methods: 372 patients (205 men) performed an ISWT before and after a 7-week outpatient pulmonary rehabilitation programme. After completing the course, subjects were asked to identify, from a 5-point Likert scale, the perceived change in their exercise performance immediately upon completion of the ISWT. The scale ranged from “better” to “worse”.
Results: The mean (SD) age was 69.4 (8.4) years, forced expiratory volume in 1 s (FEV1) 1.06 (0.53) l and FEV1/forced vital capacity (FVC) ratio 50.8 (18.1)%. The baseline shuttle walking test distance was 168.5 (114.6) m which increased to 234.7 (125.3) m after rehabilitation (mean difference 65.9 m (95% CI 58.9 to72.9)). In subjects who felt their exercise tolerance was “slightly better” the mean improvement was 47.5 m (95% CI 38.6 to 56.5) compared with 78.7 m (95% CI 70.5 to 86.9) in those who reported that their exercise tolerance was “better” and 18.0 m (95% CI 4.5 to 31.5) in those who felt their exercise tolerance was “about the same”.
Conclusion: Two levels of improvement were identified. The minimum clinically important improvement for the ISWT is 47.5 m. In addition, patients were able to distinguish an additional benefit at 78.7 m.
Statistics from Altmetric.com
Improving exercise performance is an important therapeutic goal for patients with chronic obstructive pulmonary disease (COPD) and other chronic respiratory diseases.1 In this context, a laboratory exercise test may provide a precise physiological outcome but field walking tests are often employed as a pragmatic alternative. The most popular field walking tests are the unpaced 6 min walking test (6MWT) and the incremental shuttle walk test (ISWT). The ISWT has been used in an increasing number of studies because the externally paced incremental format is similar to the laboratory incremental exercise test.1 It has been used as an outcome measure in trials of pulmonary rehabilitation,2 3 pharmaceutical studies4 and other disease populations as a prognostic marker.5
In the context of a therapeutic trial, laboratory or field exercise tests are generally used as a proxy outcome that may reflect domestic functional performance. Any positive changes in exercise performance must therefore be perceived as beneficial by the patient. However, the small statistically significant improvements reported in trials may not necessarily translate into useful recognised benefit. The concept of the minimal clinically important difference (MCID) has therefore been developed to demonstrate the threshold of change that may have some meaning for the patient. The MCID has been defined as “the smallest difference in a score that patients perceive to be beneficial in the absence of troublesome side effects and excessive costs”.6
The MCID has been identified for a number of common disease-specific health status questionnaires including the Chronic Respiratory Questionnaire (CRQ),7 the St George’s Questionnaire (SGRQ)8 and the Baseline and Transitional Dyspnoea Questionnaire (BDI/TDI). Less information is available for interpreting improvements in functional performance status. An MCID value of 54 m has been identified for the 6MWT,9 but no MCID has yet been developed for the ISWT.
The aim of this study was to calculate an MCID for the ISWT using pulmonary rehabilitation as the therapeutic intervention. A secondary aim of the study was to test whether more than one level of improvement could be distinguished by the patient following rehabilitation.
METHODS
All patients had a confirmed diagnosis of COPD and were referred to an outpatient-based pulmonary rehabilitation programme. Before commencing the course they were assessed by a respiratory physician. Patients were excluded from rehabilitation if there was significant locomotor, neurological or psychiatric limitation to exercise.
The subjects were invited for an initial assessment at which exercise tolerance was assessed with the ISWT.10 At this initial assessment the subjects completed two shuttle ISWTs with an adequate rest of 20–30 min between the two tests. After assessment the subjects attended the hospital outpatient rehabilitation programme, which lasted 7 weeks and comprised two hospital outpatient visits per week each lasting 2 h (1 h of physical training and 1 h of education). A daily home walk was also prescribed at a speed representing 85% of peak oxygen consumption, derived from the ISWT performance.11 In addition to brisk walking, the subjects performed peripheral muscle training exercises three times a week with free weights, twice at home and once in hospital. They kept a diary of their exercises to allow the rehabilitation team to monitor compliance and progress. After 7 weeks of rehabilitation the ISWT was repeated. Immediately upon completion of the test, subjects were asked to rate how much they felt their exercise tolerance had changed using the following question: “Compared to last time, how would you rate your exercise tolerance?” Responses were categorised as (1) better, (2) slightly better, (3) about the same, (4) slightly worse or (5) worse; each response was assigned a numerical value from 1 to 5. At this stage the subjects were not informed of any objective change in distance walked after the course of rehabilitation.
Statistical analysis
Data were analysed using SPSS V.14. Baseline variables were normally distributed. To estimate the difference in the ISWT to within a precision of ±15 m (as represented by the 95% confidence interval (CI)) and assuming a standard deviation of 36.7 m (generated from previously published data),12 assuming equal group sizes, then 46 patients would be needed per group.
The mean change in ISWT distance achieved by pulmonary rehabilitation for each response of the simple question was calculated with 95% CI. Since the data could be analysed in terms of categorical data (number of shuttles) or as a continuous variable (distance walked), both parametric and non-parametric analyses were carried out.
RESULTS
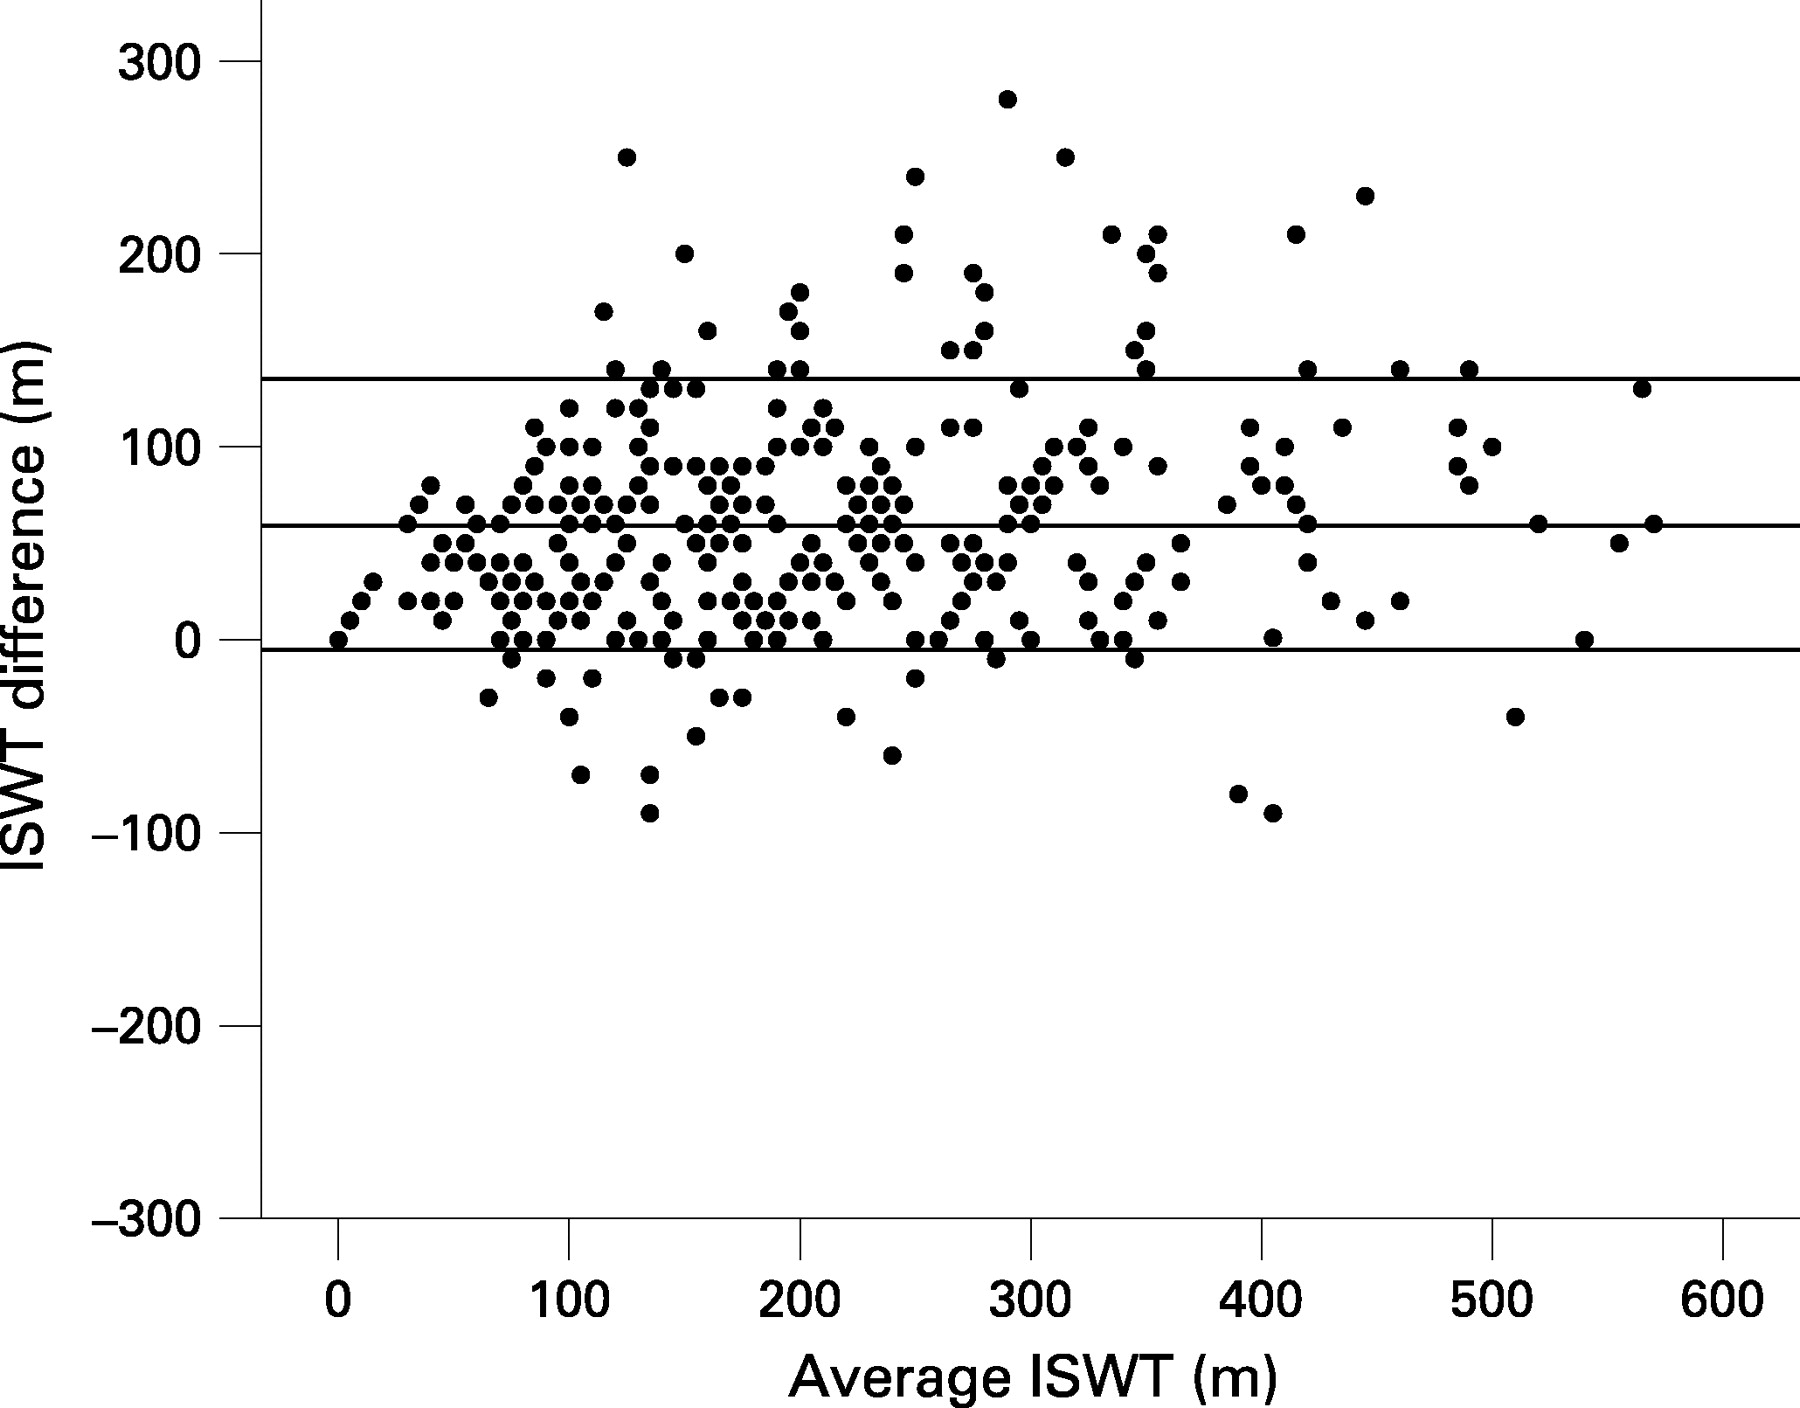
Data from 372 patients who completed rehabilitation are reported. Data collection was continued until at least 46 patients had been recruited into response categories 1, 2 or 3. At baseline the mean (SD) age was 69.4 (8.4) years, FEV1 1.06 (0.53) l, FEV1/FVC ratio was 50.8 (18.1)% and 55% were men. The mean (SD) baseline shuttle distance was 168.5 (114.6) m which increased to 234.7 (125.3) m after rehabilitation (mean improvement 65.9 m (95% CI 58.9 to 72.9).
As anticipated, there was no relationship between baseline ISWT performance and the improvement in shuttle distance following rehabilitation. Figure 1 is a Bland-Altman plot for the five groups identifying the mean baseline/post-ISWT against the ISWT difference.
The distribution of responses to the question about perceived improvement was “better” in 50.5% (n = 188), “slightly better” in 29.9% (n = 111), “about the same” in 14.8% (n = 55), “slightly worse” in 4.3% (n = 16) and “worse” in 0.5% (n = 2). One-way analysis of variance (ANOVA) between all five groups identified a significant difference in the mean distance achieved (p<0.001); post hoc analysis showed that the differences were between groups 1, 2, 3 and 4. However, the numbers of patients who felt their exercise tolerance was “slightly worse” or “worse” (groups 4 and 5) were too small to give statistically significant results so they were excluded from subsequent analyses. The baseline characteristics of groups 1, 2 and 3 are shown in table 1.
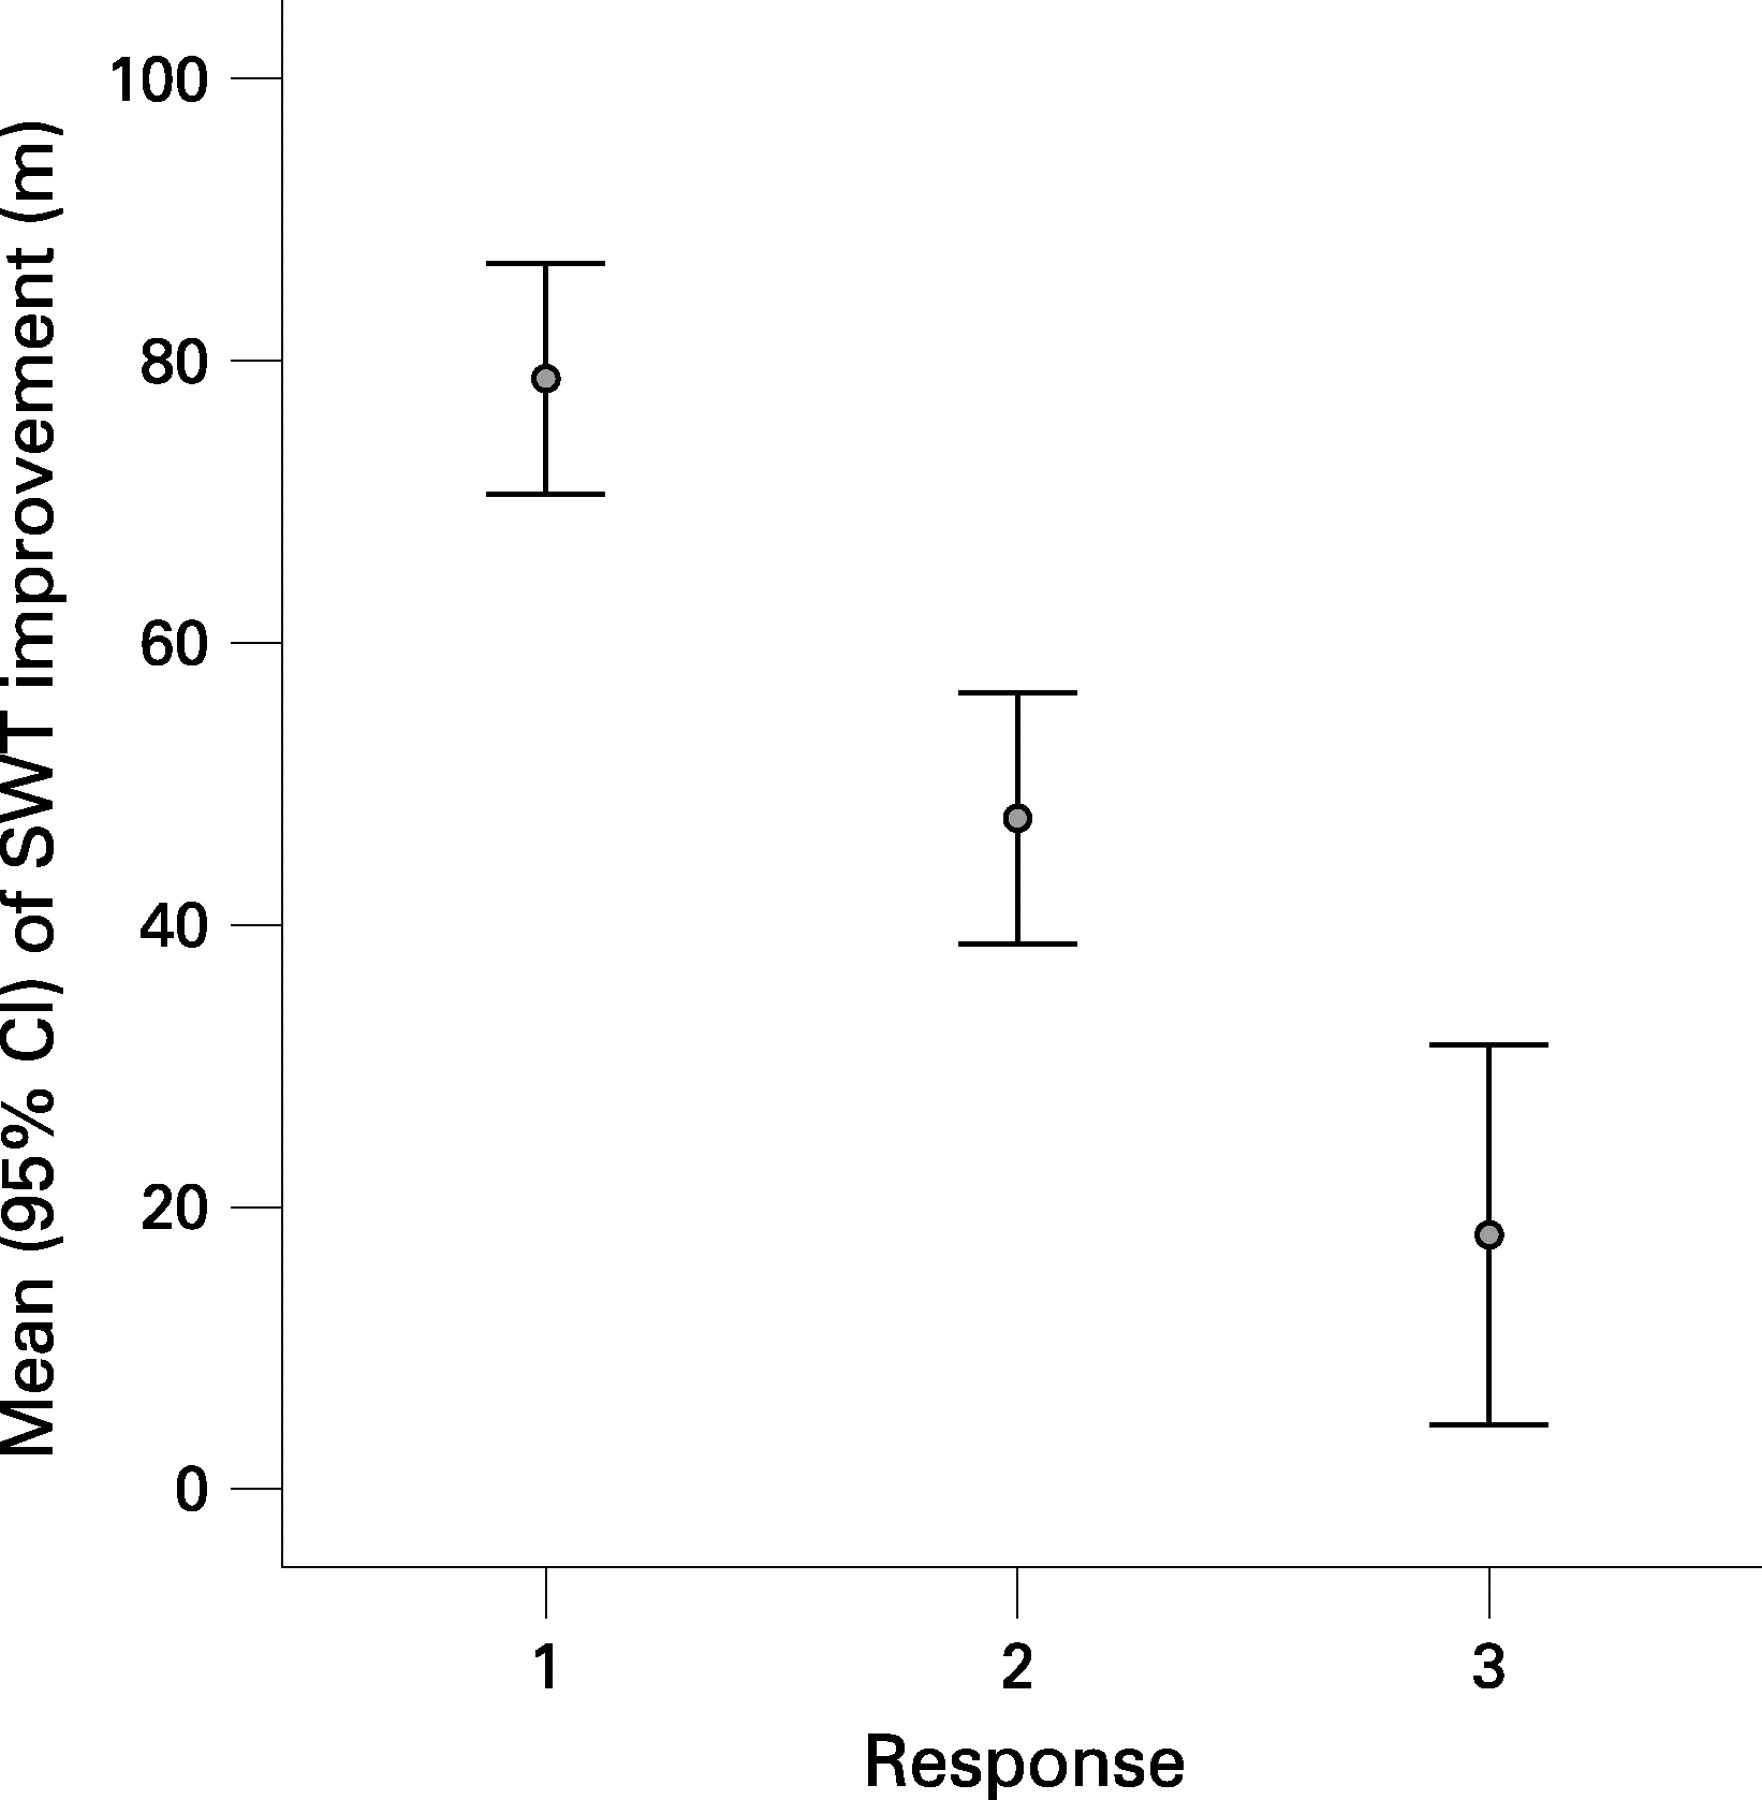
Analysis of variance showed that there was no significant difference in baseline characteristics between groups 1, 2 and 3 (p>0.05). The mean improvement in those who perceived their exercise tolerance was “better” was 78.7 m (95% CI 70.5 to 86.9) compared with 47.5 m (95% CI 38.6 to 56.5) in those who perceived their exercise tolerance to be “slightly better” and 18.0 m (95% CI 4.6 to 31.5) in those whose exercise tolerance was perceived as being “about the same” (fig 2). The difference in the magnitude of change between groups 1 and 2 was 31.2 m (95% CI 11.6 to 50.7) compared with 60.7 m (95% CI 33.6 to 87.6) between groups 1 and 3 and 29.5 m (95% CI 0.75 to 58.2) between groups 2 and 3. The effect size (mean within-patient change expressed as a proportion of the between-patient standard deviation at baseline) was 0.31 for patients in group 1 and 0.22 for those in group 2.
When analysing the data as whole shuttles for patients in groups 1–3, a significant difference between categories of response was found using the Kruskal-Wallis test. Expressed as whole shuttles, for patients to rate their exercise tolerance as “better” they needed to improve by 8 shuttles compared with 5 shuttles to feel “slightly better” and 2 shuttles to report feeling “about the same”. The MCID to identify improvements in the ISWT is 47.5 m when assessed at a population level in which an average shuttle distance could be calculated, or 5 shuttles since the ISWT distance is measured in numbers of whole shuttles completed.
To test whether the improvement was independent of baseline performance, the patients were divided into quartiles based on their baseline ISWT data: 0–80 m; 90–150 m; 160–250 m and ⩾250 m. The increase in distance covered in those who were “slightly better” was not significantly different between the quartiles (ANOVA, p = 0.9).
DISCUSSION
The ISWT is used widely to assess exercise capacity and we have now identified a threshold for a minimally important change for this test. Patients who perceived their performance in the post-rehabilitation shuttle test to be slightly better than their baseline performance increased their ISWT distance by 48 m. When assessed at the level of an individual patient, the MCID was 5 shuttles. We have also identified a further category of improvement; an average increase in exercise performance of 78 m (or 8 shuttles) identified a greater level of perceived improvement.
A number of methods are used to define the MCID,13 the most common being the patient preference-based estimate which usually takes the form of a study in which patients judge their current performance against their recall of their performance at some time in the past. Its chief strength is that it is patient-centred, and its chief weakness is that it requires a retrospective estimate. Redelmeier et al14 used a different approach to produce the MCID for the 6MWD and asked cohorts of patients to compare their performance against their peers. Their MCID estimate was based upon social interaction between patients, not on direct observations of performance. This method overcomes issues about patient recall but, strictly speaking, the method provides only an indirect assessment of the MCID since it depends on the association between the 6MWD and the patients’ overall function within the environment of a rehabilitation class. Furthermore, it relies on individuals rating an important change between subjects equivalent to an improvement regarded as important to the individuals themselves. By contrast, we anchored our patients’ estimates much more closely on their performance during the test. Issues of retrospective estimates of change are complex, but we believe that our estimates are reliable since we showed a clear rank-order relationship between the size of the perceived benefit and the measured improvement.
In the 55 patients who judged that they had no improvement, the change in ISWT was only 18 m, but the lower 95% confidence interval did not include no change. This suggests that patients failed to rate very small changes in exercise performance. This may be due to “response shift”, first proposed by Sprangers and Schwartz.15 This theory hypothesises that interaction with healthcare providers or a sustained change in health state may alter the way in which individuals assess their state. Alternatively, patients’ expectations of benefit may be influenced by their perceptions, and the classic Hawthorn effect may have been operating in which subjects who are being observed may change their behaviour. In addition, there may have been an improvement in the patients that was not reflected in terms of improved ISWT performance. Either way, the effect appears to have been small and the 5-shuttle MCID should provide a reliable threshold for determining the response rate to treatment. Uniquely, our study also identified a second more stringent measure of improvement for use by investigators.
Acknowledgments
The authors thank Dr John Bankart, Medical Statistician, University of Leicester for his statistical advice.
REFERENCES
Footnotes
Competing interests: None.
Ethics approval: Local ethical committee approval was granted to collect the additional data at the time of the follow-up assessment.