Article Text

Abstract
Rationale Severe asthma and chronic obstructive pulmonary disease (COPD) share common pathophysiological traits such as relative corticosteroid insensitivity. We recently published three transcriptome-associated clusters (TACs) using hierarchical analysis of the sputum transcriptome in asthmatics from the Unbiased Biomarkers for the Prediction of Respiratory Disease Outcomes (U-BIOPRED) cohort comprising one Th2-high inflammatory signature (TAC1) and two Th2-low signatures (TAC2 and TAC3).
Objective We examined whether gene expression signatures obtained in asthma can be used to identify the subgroup of patients with COPD with steroid sensitivity.
Methods Using gene set variation analysis, we examined the distribution and enrichment scores (ES) of the 3 TACs in the transcriptome of bronchial biopsies from 46 patients who participated in the Groningen Leiden Universities Corticosteroids in Obstructive Lung Disease COPD study that received 30 months of treatment with inhaled corticosteroids (ICS) with and without an added long-acting β-agonist (LABA). The identified signatures were then associated with longitudinal clinical variables after treatment. Differential gene expression and cellular convolution were used to define key regulated genes and cell types.
Measurements and main results Bronchial biopsies in patients with COPD at baseline showed a wide range of expression of the 3 TAC signatures. After ICS±LABA treatment, the ES of TAC1 was significantly reduced at 30 months, but those of TAC2 and TAC3 were unaffected. A corticosteroid-sensitive TAC1 signature was developed from the TAC1 ICS-responsive genes. This signature consisted of mast cell-specific genes identified by single-cell RNA-sequencing and positively correlated with bronchial biopsy mast cell numbers following ICS±LABA. Baseline levels of gene transcription correlated with the change in RV/TLC %predicted following 30-month ICS±LABA.
Conclusion Sputum-derived transcriptomic signatures from an asthma cohort can be recapitulated in bronchial biopsies of patients with COPD and identified a signature of airway mast cells as a predictor of corticosteroid responsiveness.
- COPD pathology
- oxidative stress
- airway epithelium
Data availability statement
Data are available in a public, open access repository. Datasets used in the current manuscript are publicly available (GSE36221).
This is an open access article distributed in accordance with the Creative Commons Attribution 4.0 Unported (CC BY 4.0) license, which permits others to copy, redistribute, remix, transform and build upon this work for any purpose, provided the original work is properly cited, a link to the licence is given, and indication of whether changes were made. See: https://creativecommons.org/licenses/by/4.0/.
Statistics from Altmetric.com
WHAT IS ALREADY KNOWN ON THIS TOPIC
To determine whether gene expression signatures obtained in asthma can be used to identify the subgroup of patients with chronic obstructive pulmonary disease (COPD) with steroid sensitivity.
WHAT THIS STUDY ADDS
Sputum-derived transcriptomic signatures from an asthma cohort as associated with steroid sensitivity in patients with COPD which was mainly driven by mast cell associated genes.
HOW THIS STUDY MIGHT AFFECT RESEARCH, PRACTICE OR POLICY
This paper helps explain the rational of corticosteroid sensitivity of our previously described transcriptome-associated cluster signatures and how they can be used to identify corticosteroid sensitivity in COPD.
Introduction
Severe asthma and chronic obstructive pulmonary disease (COPD) share common pathophysiological traits such as airflow obstruction, eosinophilic inflammation and corticosteroid insensitivity.1–3 Although inhaled corticosteroids (ICS) are the gold-standard therapy for controlling inflammation in asthma, patients with COPD are less likely to respond to ICS therapy.4–6 However, improvements in lung function, exacerbation risk and all-cause mortality with ICS treatment when used in combination with long-acting beta-agonist (LABA) bronchodilators have been reported recently.7 8 In addition, some patients with COPD with no previous history of asthma can benefit from ICS, such as those with high blood eosinophil counts.9–13 It has previously been shown that gene expression profiling in bronchial biopsies in COPD may identify those with asthma-COPD overlap, as reflected by a T helper (Th)2-high inflammatory profile and a favourable short-term and long-term ICS treatment response.3
We have recently described three transcriptome-associated clusters (TACs) in the U-BIOPRED asthma cohort using hierarchical clustering of genes differentially expressed in sputum between eosinophil-high and eosinophil-low asthmatics.14 These TACs consisted of an interleukin (IL)13/Th2-high predominantly eosinophilic cluster (TAC1) and two Th2-low gene expression clusters characterised by neutrophilic inflammation and inflammasome activation (TAC2), and metabolic and mitochondrial pathways (eg, mitochondrial oxidative phosphorylation (OXPHOS)) (TAC3). These TAC signatures define patients with distinct clinical phenotypes. TAC1 was associated with sputum eosinophilia as well as elevated exhaled nitric oxide levels and was restricted to patients with severe asthma, frequent exacerbations and severe airflow obstruction. Given that these patients were dependent on corticosteroids, we hypothesise that TAC1 identifies a steroid-insensitive subphenotype of severe asthma.
In the current study, we hypothesised that these TAC signatures are also expressed in bronchial biopsies of patients with mild-to-moderate COPD. Initially, we determined whether we could remap the sputum-derived TAC signatures onto biopsy transcriptional data using unsupervised clustering of the genes previously associated with the sputum TAC signatures on the bronchial biopsy transcriptome. Using gene clustering, we derived the same TAC signatures in patients with COPD. Next, we investigated the influence of short-term (0–6 months) and long-term (0–30 months) ICS therapy on these signatures as well as their ability to identify patients that response to corticosteroid in COPD. Examination of the key ICS-regulated genes, cellular deconvolution and cell signature analysis identified bronchial biopsy mast cells as being significantly associated with ICS response in COPD.
Materials and methods
Patients and study design
GLUCOLD study
Gene expression profiling was performed in bronchial biopsies from patients with COPD participating in the Groningen Leiden Universities Corticosteroids in Obstructive Lung Disease (GLUCOLD) study.15 The study design and inclusion criteria have been previously described.15 Briefly, this study required participants to be either current or ex-smokers with COPD at Global Initiative for Chronic Obstructive Lung Disease (GOLD) stages 2 and 3 and not to have used ICS treatment for at least 6 months prior to entry to the study. There were four parallel groups of patients who were treated with (1) placebo twice daily for 30 months (placebo group), (2) fluticasone propionate (FP) 500 µg twice daily for 30 months (FP group), (3) FP 500 µg+salmeterol (S) 50 µg twice daily for 30 months (FP/S group) or (4) FP 500 µg twice daily for 6 months and then 24 months with placebo (FP/placebo group), referred to as the withdrawal group. Because we have previously shown a minimal effect of the LABA in the presence of ICS on bronchial biopsy gene expression compared with ICS alone,9 groups 2 and 3 were analysed together and referred to as ICS±LABA group. Bronchial biopsies were taken at baseline and after 6 and 30 months, among others, for microarray gene expression profiling. The methods for messenger RNA (mRNA) isolation, labelling, microarray hybridisation (Affymetrix HuGene ST1.0 arrays) and data processing have been described previously.9 16 17
Signatures summarised by gene set variation analysis
The R package gene set variation analysis (GSVA) was used to calculate composite scores of the previously described sputum TAC signatures (online supplemental table S1)14 within the GLUCOLD bronchial biopsy transcriptome data as indicated by a sample-wise enrichment score (ES). Analysis of variance (ANOVA) was used to analyse the ES differences among group means and a t-test was applied to compare the ES differences between the two means.
Supplemental material
Sputum collection
Sputum was induced by inhalation of hypertonic saline solution and sputum plugs were collected from which sputum cells and sputum supernatants were obtained, as described previously.16
U-BIOPRED cohort
Transcriptomic data measured on Affymetrix U133 Plus 2.0 microarrays (Affymetrix, Santa Clara, California, USA) from sputum cells obtained from 104 participants with moderate-to-severe asthma (U-BIOPRED cohort)14 were used to conduct a GSVA analysis.
Clustering
To recapitulate the TAC signatures in the bronchial biopsies of the GLUCOLD study, hierarchical clustering analysis was conducted on the genes previously associated with the sputum TAC1, TAC2 and TAC3 signatures in bronchial biopsies at baseline, using the method as previously described.14 The intensities of the raw probe sets were log2 transformed and normalised by the robust multiarray average method.18
Correlation of TAC signatures with inflammatory and clinical parameters
Baseline TAC signatures in bronchial biopsies (TACs) were correlated with each other and with baseline sputum and biopsy inflammatory cell counts as well as with treatment-induced changes in inflammatory cell counts and lung function measurements using Spearman’s correlation.
Statistical tests
All statistical tests were conducted using GraphPad prism (V.9). For two-way ANOVAs, a Benjamini-Hochberg adjusted p value <0.05 was considered statistically significant.
t-distributed stochastic neighbor embedding (tSNE) plots
Single cell data were accessed through the https://asthma.cellgeni.sanger.ac.uk/ web portal, which contained single cell data obtained from bronchial biopsies derived from asthmatic (n=4) and healthy controls (n=4).19
Bronchial biopsy cellular deconvolution
AutoGeneS20 was used to infer cellular fractions using our previously published data on mRNA expression levels in human bronchi.19 21 Cellular deconvolution is explained in detail in the online supplemental materials. Additionally, an 11 gene mast cell gene signature created using single-cell RNA-sequencing (scRNA‐seq) from bronchial biopsies22 was used to investigate the influence of ICS on mast cells using GSVA. Of the 11 genes, 1 gene TPSAB1 was not present on the array and was not included in the GSVA signature.
Air liquid interface culture and RNA-seq
Primary airway epithelial cells (n=6) were cultured as previously described.23 24 Following differentiation for 28 days, cells were then growth factor deprived overnight and then treated apically with/without FP (10−8 M) for 24 hours. RNA was then extracted and processed for RNA-seq, as previously described.24 Differential gene expression analysis was performed using the R package limma (V.3.42.0), correcting for age, gender and the first two principal components.
Results
Patient demographics
A total of 81 out of 89 randomised patients with COPD from the placebo (n=23), ICS±LABA 30-month treatment groups (n=39) and ICS withdrawal group (n=21) had bronchial biopsy RNA available of sufficient quality to be run on the Affymetrix Hugene ST1.0 arrays. Online supplemental table S2 shows the patient demographics.
Clustering of the TAC signatures in bronchial-derived and sputum-derived TAC phenotypes
Initially, we performed hierarchical clustering on the genes associated with all three TAC signatures in bronchial biopsies at baseline (n=58) (figure 1A); the withdrawal group (group 4) was removed for this analysis to avoid microarray batch effects. Three distinct subgroups of patients with COPD were identified (clusters red, green and blue). We next used GSVA to create ES for several biological pathways, which previously distinguished each original sputum-derived TAC signature.14 We compared the enrichment of these pathways in the three biopsies TACs of the patients with COPD. The red cluster was associated with an IL13/Th2 signature (figure 1B), which was previously found to distinguish the eosinophil-high sputum TAC1 signature.14 The green cluster was associated with the inflammasome signature (figure 1C), previously found to distinguish the neutrophil-high TAC2 signature. No individual group was found to be solely associated with oxidative phosphorylation (OXPHOS) (figure 1D), a pathway characteristic of TAC3 in asthma. As all patients with COPD were either current smokers or ex-smokers, we also investigated a smoking-related signature, derived from bronchial brushes of non-smokers and current smokers.25 This smoking-related signature was also found to distinguish TAC3 in the asthma study26(figure 1E) and in the COPD cohort, it was associated with the blue cluster (figure 1F). Here, we show that the same TAC signatures derived from asthma sputum can be recapitulated in COPD bronchial biopsies. Henceforth, we will use the signatures derived from the TAC publication.14 A table comparing clinical characteristics of patients in the TAC groupings can be seen in online supplemental table S3.

Identification of transcriptome-associated cluster (TAC) signatures in bronchial biopsies. (A) Heatmap of genes that best discriminate each bronchial-derived TAC (TAC) signature (n=58). Columns represent subjects with COPD and rows represent genes. Association of TAC groups 1–3 with gene signatures derived from interleukin (IL)13/T helper (Th)2-stimulated epithelial cells (B), inflammasome activation (C), oxidative phosphorylation (OXPHOS) (D), cigarette smoke irreversibly upregulated signature in sputum samples from U-BIOPRED14 (E) and cigarette smoke irreversibly upregulated signatures in bronchial brushes in Groningen Leiden Universities Corticosteroids in Obstructive Lung Disease TAC groups (F). A one-way analysis of variance was used to compare each TAC group. A Bonferroni adjusted p value <0.05 was considered significant. *P<0.05. ES, enrichment score.
Relationship between TAC signatures
ES scores were created for all three TACs using the COPD bronchial biopsy expression dataset at baseline. Bronchial biopsies at baseline showed a wide range of expression of the three TACs (figure 2A), with a significant inverse correlation between ES TAC1 and ES TAC3 (rho=−0.3332, p=0.00106) and a positive correlation between ES TAC2 and ES TAC3 (rho=0.4927, p<0.0001, figure 2B–D). No significant correlation between ES TAC1 and ES TAC2 was observed.
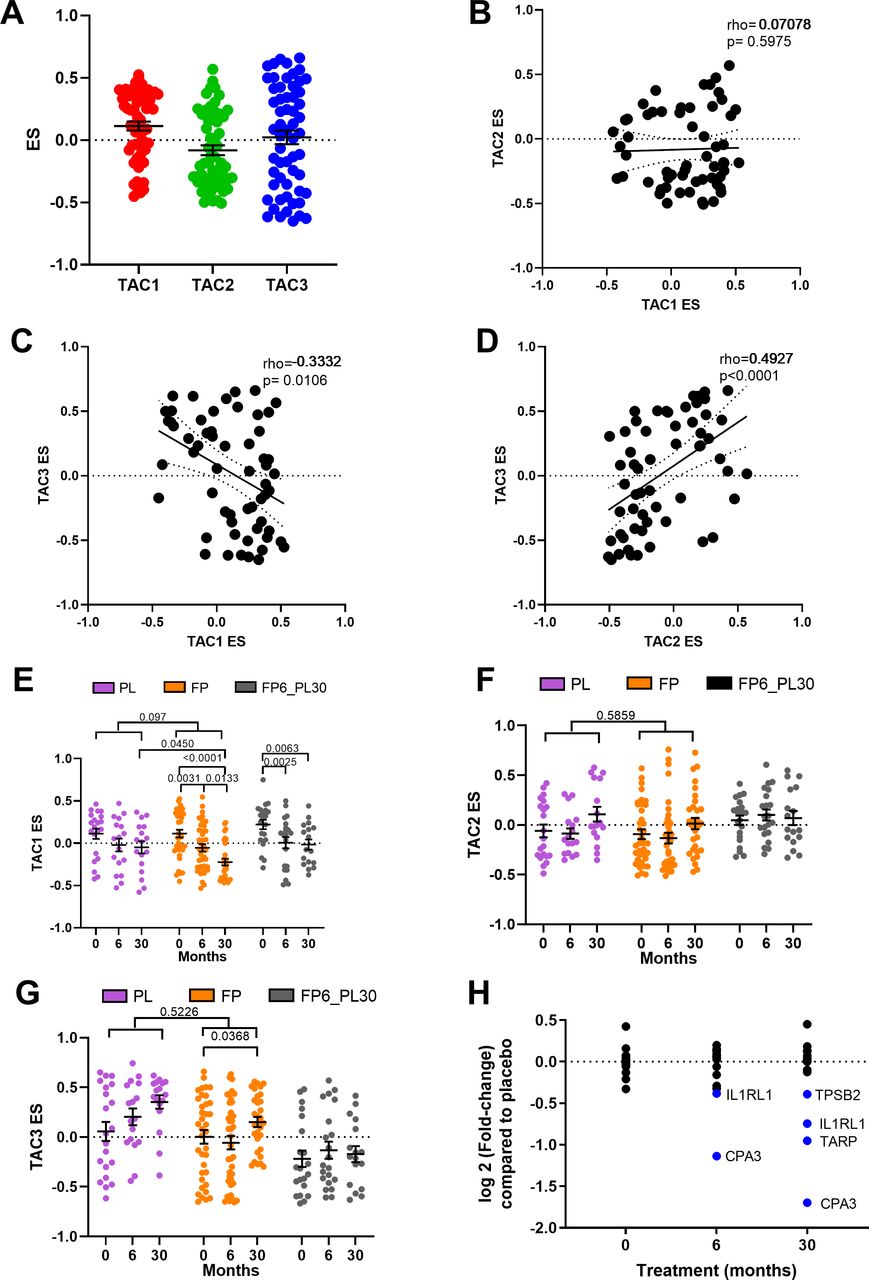
Relationship between bronchial-derived transcriptome-associated cluster (TAC) signatures and the influence of inhaled corticosteroid (ICS) treatment. (A) Box plot of the expression of TAC signatures across all patients at baseline (median±95% CI). Correlations of the expression signatures between (B) TAC1 and TAC2, (C) TAC1 and TAC3 and (D) TAC2 and TAC3 (n=58). The influence of ICS treatment on (E) TAC1, (F) TAC2 and (G) TAC3. (H) Fold-change of TAC1 genes comparing bronchial expression profiles of treatment arms to time match placebo of the Groningen Leiden Universities Corticosteroids in Obstructive Lung Disease study at baseline, 6 months and 30 months. Blue represents significant downregulated genes (adjusted p value <0.05). Mean±SEM is presented in the figures. For two-way analysis of variance, a Benjamini-Hochberg adjusted p value <0.05 was considered significant. An interaction analysis was conducted on TAC signatures using an LME model investigating the interaction between time and treatment with patient ID as the random factor. ES, enrichment score; FP, fluticasone propionate; FP6_PL30, FP for 6 months and then 24 months with placebo; LME, linear mixed effect; PL, placebo±salmeterol.
Longitudinal treatment with ICS modulates TAC1 signature only
We next investigated whether the TAC signatures were altered during ICS treatment and after ICS withdrawal (figure 2E). The withdrawal group was investigated to allow for within-group comparison but was not compared with other treatment due to batch effect. No change in TAC1 was seen in the placebo group over 30 months. The TAC1 signature was found to be reduced following 6 and 30 months of ICS±LABA treatment compared with baseline and significant compared with placebo at the 30 months time point. However, following 24 months of ICS withdrawal, the ES value did not return to baseline. An interaction analysis comparing treatment and time can be observed in online supplemental table S4, which found a trend of an overdecrease overtime (p=0.097). ICS treatment had no effect on the inflammasome-TAC2 ES but did increase TAC3 in the 30-month ICS group, but this was not significant compared with the time-matched placebo group (figure 2F–G).
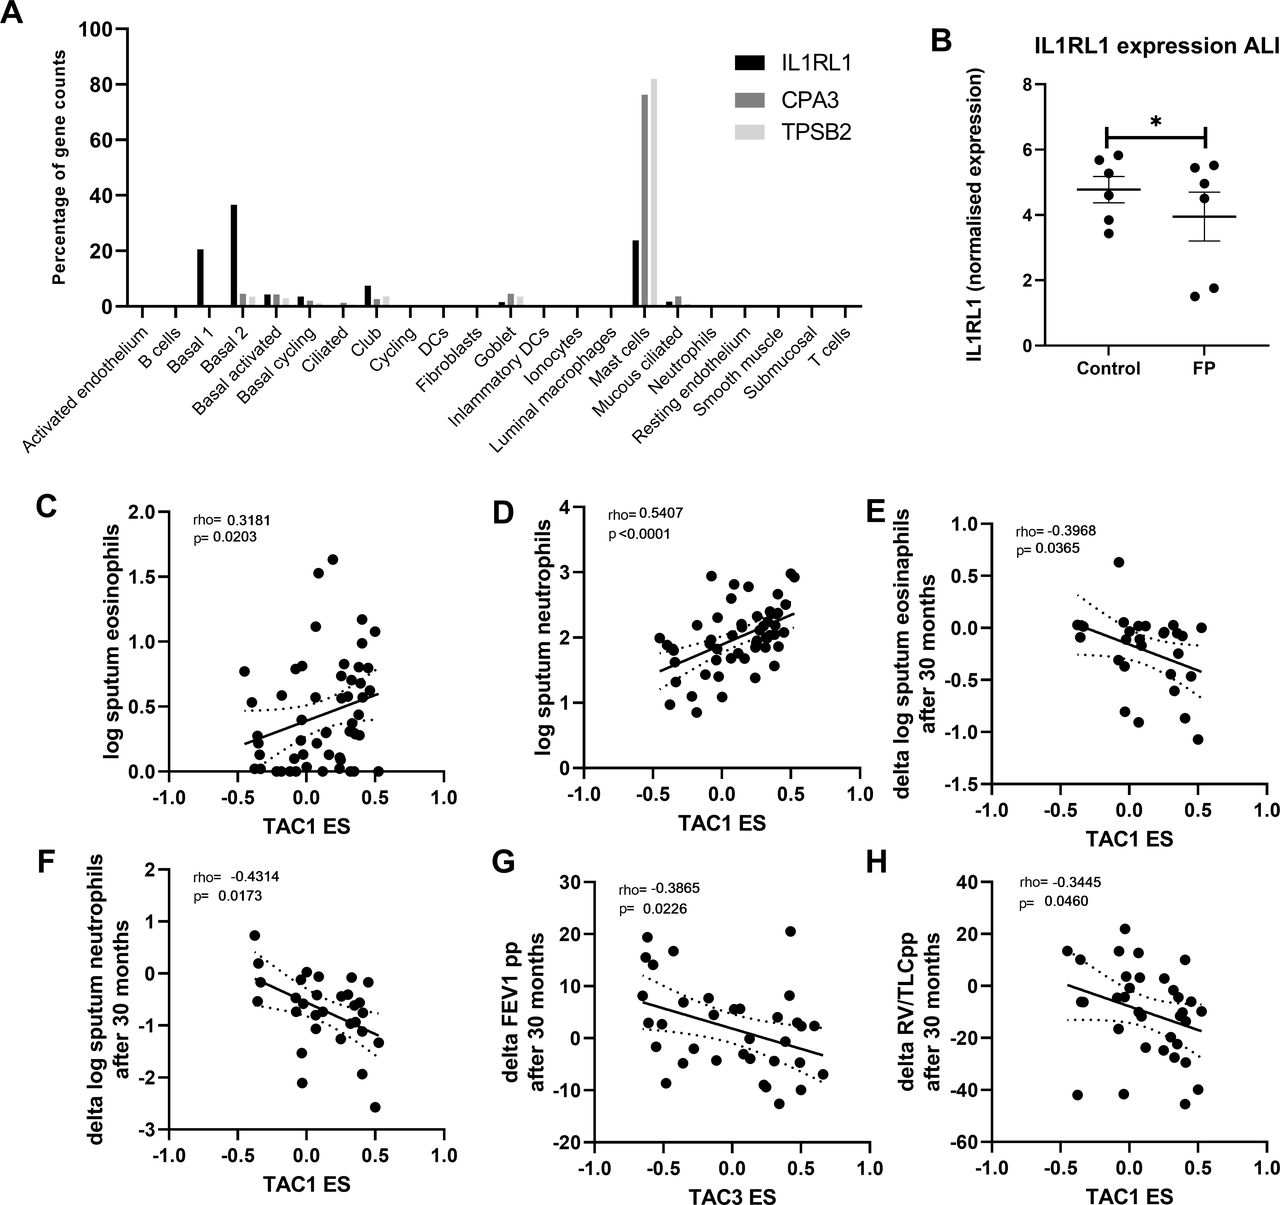
A differential gene expression analysis (figure 2H, online supplemental table S5) indicated that the ICS-induced shift in the TAC1 signature was driven by four genes: interleukin 1 receptor like 1 (IL1RL1), TCR Gamma Alternate Reading Frame Protein (TARP), tryptase beta-2 (TPSB2) and carboxypeptidase A3 (CPA3). To determine which cell types were contributing to TAC1 sensitivity to ICS, we applied our previously published scRNA-seq dataset obtained from bronchial biopsies of healthy control and patients with asthma.19 Initially, tSNE plots were created for the ICS-sensitive genes (IL1RL1, TPSB2 and CPA3) from TAC1, while TARP was not present in the scRNA-seq dataset. tSNE plots made from epithelial cell subpopulations/subsets showed no specific expression of the three genes (online supplemental figure S1A-D), while the tSNE plot of non-epithelial cell populations identified all three genes as mast cell-specific (figure 3A–D).

Determining the basis of inhaled corticosteroids (ICS) sensitivity of the TAC1 signature. tSNE plots for ICS-sensitive TAC1 genes (interleukin 1 receptor like 1 (IL1RL1), tryptase beta-2 (TPSB2) and carboxypeptidase A3 (CPA3)), obtained from of single-cell sequencing data obtained from asthmatic (n=4) and healthy controls (n=4) (A–D). The tSNE plot shows the expression of the selected gene across cell types identified in the single-cell sequencing data with each dot representing a single cell. Panel A highlights the position of each cell type. Analysis of mast cell quantification in bronchial biopsies derived from patients with COPD treated with either placebo, ICS for 6-month then 24-month withdrawal or ICS±long-acting β-agonist (LABA) for 30 months ICS treatment using (E) cellular deconvolution. (F) Gene set variation analysis (GSVA) analysis of a 11 gene mast cell signature derived from single-cell sequencing and (G) histological measurement of log mast cell counts (AA1-positive cells) in bronchial biopsies (mm2). ES, enrichment score; FP, fluticasone propionate±salmeterol; FP6_PL30, FP for 6 months and then 24 months with placebo; PL, placebo. For two-way analysis of variance (ANOVA), a Benjamini-Hochberg adjusted p value <0.05 was considered significant. An interaction analysis was conducted on mast cell signatures using an LME model investigating the interaction between time and treatment with patient ID as the random factor. Mean±SEM is presented in the figures.
To further investigate the effect of ICS on mast cells and other cell populations, we took three approaches: (1) we performed cellular deconvolution on the bronchial biopsy dataset, (2) we examined the change in gene expression of mast cell markers that we previously developed from scRNA-seq data and (3) we analysed the histological staining of mast cells in adjacent biopsies from the same patient.19 The cellular deconvolution focusing on mast cell showed a decrease at 30-month ICS exposure (figure 3E), which was reversed following ICS withdrawal.
An analysis of mast cell-specific genes that we previously identified by scRNA-seq (TPSB2, TPSD1, TESPA1, RGS13, SLC18A2, CPA3, MS4A2, HPGDS, ADCYAP1 and HDC) shows a significant decrease in the mast cell signature after 6-month and 30-month ICS±LABA treatment compared with placebo, with an increase in expression of this signature following 24 months of ICS withdrawal (figure 3F, online supplemental table S4). A heatmap of these genes can be observed in online supplemental figure S2. Similar results were found for the histological staining of mast cell numbers measured by tryptase (AA1) staining in adjacent biopsies (figure 3G). Although, a slight decrease in mast cell numbers was seen in the placebo arm using histology at 6 and 30 months, the decrease was more pronounced after 6-month and 30-month ICS treatment. Additionally, we investigated on the genes that overlap between the TAC1 signature and the mast cell signature to refine the TAC1 signature for possible corticosteroid sensitivity. As expected, we observed that the refined TAC1 signature decreased with corticosteroid treatment (online supplementals figure S3 and table S4).
Finally, we investigated the percentage that each cell type contributes to the overall gene expression of CPA3, TPSB2 and IL1RL1 in bronchial biopsies (figure 4A). Although IL1RL1 appears to be mast cell-specific in tSNE plots, more than ~50% of its total expression in biopsies was seen in basal epithelial cells. To determine whether the decrease of IL1RL1, TPSB2 and CPA3 was a direct effect of corticosteroid therapy, we treated airway epithelial cells differentiated at air-liquid interface with FP for 24 hours and measured gene expression by RNA-Seq. IL1RL1 gene expression was found to be significantly decreased by FP (figure 4B), while CPA3 and TPSB2 were not detected in airway epithelial cells, which is to be expected as both CPA3 and TPSB2 were specifically expressed in the mast cell cluster base on single-cell sequencing.

Correlation of bronchial-derived transcriptome-associated cluster (TAC) signatures and inflammatory cell counts. (A) Expression distribution of interleukin 1 receptor like 1 (IL1RL1), carboxypeptidase A3 (CPA3) and tryptase beta-2 (TPSB2)from single-cell sequencing data from bronchial biopsies (n=8). (B) IL1RL1 expression from primary airway epithelial cells grown at air-liquid interface, quiesced overnight and then treated with fluticasone propionate (FP; 10−8 M) for 24 hours (n=6 donors). Correlation of TAC1 signature at baseline with sputum (C) log eosinophil counts and (D) log neutrophil counts (n=58). Correlation of TAC1 signature at baseline with (E) change in log eosinophil counts and (F) delta log neutrophil counts after 30 months inhaled corticosteroids (ICS)±long-acting β-agonist (LABA). (G) Correlation of TAC3 signature at baseline with delta forced expiratory volume in 1 s (FEV1) %predicted. (H) Correlation of ICS-sensitive TAC1 signature at baseline with delta FEV1 %predicted. ES, enrichment score.
TAC association with physiological and inflammatory features of COPD
To determine the relationship between the TAC signatures and clinical and inflammatory features, we first investigated their relationship to sputum inflammatory cell profiles. At baseline, higher TAC1 was associated with higher sputum eosinophil and neutrophil counts (figure 4C,D). The association between TAC1 and percentage of cells can be observed in online supplemental figure S4. The ES of TAC1−3 was not associated with airflow obstruction (FEV1 %predicted) or hyperinflation (residual volume (RV) %predicted) (table 1). No association was found with the ICS-sensitive TAC1.
Association of TAC signatures with clinical variables at baseline
Finally, we determined whether baseline TAC signatures was associated with the ICS treatment response as reflected by improvement in lung function and decrease in inflammatory cell counts. Higher TAC1 baseline ES was associated with a more pronounced decrease in sputum neutrophil and eosinophil numbers after 30 months treatment with ICS±LABA (figure 4E,F, table 2, FDR <0.1), while a higher TAC3 was associated with lesser improvement of lung function measured by FEV1 %predicted (figure 4G, FDR <0.1). Interestingly, a higher ES of the TAC1 signature at baseline was associated with more improvement of lung function measured by RV/TLC %predicted over the 30-month period (figure 4H, FDR <0.1). The corticosteroid-sensitive TAC1 was associated with lung function measured by FEV1 %predicted but this did not survive the FDR.
Baseline TAC signatures association with clinical variables over 30 months ICS±LABA treatment compared with baseline
Discussion
We found that the genes represented in the TAC signatures derived from the sputum of the U-BIOPRED asthma cohort were also expressed in bronchial biopsies of patients with COPD. The TAC1 signature (high eosinophilia/Th2 high) was found to have variable expression across patients with COPD which serves to confirm the existence of an eosinophilic phenotype associated with the Th2 pathway in a subset of patients with COPD. In addition, the suppression of this signature by ICS therapy and the reversal of the expression of this signature by cessation of ICS therapy reinforces the similarity of this COPD endotype to severe eosinophilic asthma. Furthermore, we found that the ICS treatment effect on TAC1 was the consequence of three genes expressed in mast cells: TPSB2 (a tryptase II gene, selectively expressed in mast cells), IL1RL1 (the receptor for IL-33) which is expressed on many inflammatory cell types including mast cells, eosinophils, neutrophils, innate lymphoid cells and epithelial cells and CPA3 (carboxypeptidase A3), a gene selectively expressed in mast cells, and part of a sputum signature that predicts treatment response in asthma.27 28 The impact of mast cell gene expression profiles on defining ICS response in COPD was confirmed using cellular deconvolution, cell signature analysis and histology. Finally, the TAC1 signature was associated with ICS response at both 6 and 30 months in COPD, with a trend of a decrease compared with placebo. In contrast, gene signatures associated with the TAC2 (inflammasome) and TAC3 (smoking signature) were unaffected by ICS therapy.
An increased TAC1 expression, previously identified to reflect Th2 high inflammation, was associated with higher sputum eosinophil counts. These latter results are in line with previous findings that asthma-derived Th2 signatures measured in bronchial biopsies correlate with airway wall eosinophil counts and blood eosinophil percentages and a more severe airflow obstruction in COPD.3 We also unexpectedly observed an association between TAC1 and neutrophil numbers. This has not been described in previous publications and may be due to the difference in gene expression levels and cell composition between the original sputum and biopsy samples.
The sensitivity of the original TAC1 signature to ICS therapy was predominantly associated with the genes CPA3 and IL1RL1. CPA3 is a metalloprotease usually used as an activation marker of mast cells,29 while IL1RL1 has been identified in a number of Genome-Wide Association Studies to be associated with wheezing phenotypes and asthma in childhood,30 with the risk allele being associated with higher expression of the gene in airway tissue.31 Both genes are associated with Th2 responses in asthma.14
In the current study, we show that the TAC1 signature which is driven by mast cell-specific genes at baseline is associated with improvement in gas trapping following 30 months of ICS therapy in COPD.
Mast cells reside in the airways and other organs and impact on both the innate and adaptive immune response with the secretion of numerous inflammatory bronchoconstrictor mediators such as leukotrienes and prostaglandins.32 Activated mast cells, particularly chymase-positive and tryptase-positive connective tissue mast cells, release large amounts of CPA3. Interestingly, IL1RL1 is present on granulocytes and expressed constitutively by mast cells and its ligand, IL-33, stimulates mast cell adhesion to laminin, fibronectin and vitronectin, and mast cell survival, growth, development and maturation.33 In addition, mast cell-derived tryptase and chymase cleave IL-33 to generate mature active forms.33 Together, these data suggest that mast cells contribute to the clinical expression of COPD and represent a major target for ICS, at least in a subset of patients with COPD. However, whether an increase in mast cell numbers or activity is a consequence of the disease or a causal mechanism remains to be determined. Sputum mast cell signatures have been associated with spirometry and exacerbation history in severe asthma and lower lung function in patients with COPD.34 35 Although we did find IL1RL1 expression to decrease by corticosteroids directly in the airway epithelium, the lower expression in bronchial biopsies may also result from the decrease in mast cell numbers and only partially be due to direct repression of gene expression in other cell types. Furthermore, although eosinophils express IL1RL1, we are blinded to the contribution of eosinophils to the level of IL1RL1 expression in the bronchial biopsies of these patients due to the difficulty of performing scRNA-seq on this cell type.19
Our study has several strengths and some limitations. The combination of different analytical approaches all highlighted the importance of mast cell status in bronchial biopsies of patients with COPD gives weight to our study. We examined mast cell activation in patients with well-defined COPD but we have not been able to validate the results in a separate cohort as there is no other equivalent dataset readily available. The ALI analysis was conducted in cell derived from healthy patient and patient with asthma which may have influenced IL1RL1 expression. Additionally, our current dataset had a minimal number of female subjects in the GLUCOLD dataset, however those that were included responded in the same way as male patients with COPD. Another limitation was that for the GSVA signature analysis relating to clinical variable an FDR <0.1 was used. Mast cell numbers have been associated with ICS responsiveness in asthma previously28 28 and together this suggests that focused studies should be performed in another cohort similar to GLUCOLD. Finally, the original TAC1 signature was found to have a trend of a decrease when comparing treatment with placebo in the interaction model which may have been improved with greater numbers.
In conclusion, we found that the sputum-derived TAC signatures could be recapitulated in bronchial biopsies of patients with COPD. The Th2-high TAC1 signature was found ICS responsiveness in COPD and to predict the degree of suppression of mast cell inflammation following ICS treatment. This study shows that using asthma-derived signatures such as the TACs may be a useful tool to identify patients with COPD that have asthma-like features such as responsiveness to ICS therapy, Th2-directed or mast cell-directed treatments.
Data availability statement
Data are available in a public, open access repository. Datasets used in the current manuscript are publicly available (GSE36221).
Ethics statements
Patient consent for publication
Ethics approval
This study was approved by Metc Groningen (NCT00158847). Participants gave informed consent to participate in the study before taking part.
Acknowledgments
The U-BIOPRED consortium received funding from the European Union and from the European Federation of Pharmaceutical Industries and Associations as an Innovative Medicines Initiative Joint Undertaking funded project (115010) on behalf of the U-BIOPRED Study Group with input from the U-BIOPRED Patient Input Platform and patient representatives from the Ethics Board and Safety Management Board. SP was supported by the EU-EFPIA Innovative Medicines Initiative eTRIKS project (115446). KFC is a Senior Investigator of the UK National Institute for Health Research. IA and KFC are principal investigators within the Asthma UK Centre for asthma and allergic mechanisms. This project is co-financed by the Ministry of Economic Affairs and Climate Policy by means of the PPP Allowance made available by the Top Sector Life Sciences & Health to stimulate public-private partnerships. The GLUCOLD study was was funded by unrestricted grants from the Stichting Astma Bestrijding, the Netherlands Asthma Foundation, Netherlands Organization for Scientific Research (ZonMw), GlaxoSmithKline, the Royal Dutch Academy of Sciences and Arts, the University Medical Center Groningen and Leiden University Medical Center and the NIH R01 HL095388 (Spira/Lenburg).
References
Supplementary materials
Supplementary Data
This web only file has been produced by the BMJ Publishing Group from an electronic file supplied by the author(s) and has not been edited for content.
Footnotes
Twitter @BioMarijn
IA, KFC and MvdB contributed equally.
Correction notice This article has been corrected since it was first published. The open access licence has been updated to CC BY.
Contributors AF and SP conducted the analysis and wrote the manuscript. MB aided with the cellular deconvolution. MW and AF conducted the ALI experiments. C-HK, AR, PSH, WT, Y-KG, RD, PS, KBM and MCN helped collect the samples and reviewed the manuscript. IA KFC and MvdB helped with the experimental design and writing of the manuscript. AF is the guarantor.
Funding The authors have not declared a specific grant for this research from any funding agency in the public, commercial or not-for-profit sectors.
Competing interests None declared.
Provenance and peer review Not commissioned; externally peer reviewed.
Supplemental material This content has been supplied by the author(s). It has not been vetted by BMJ Publishing Group Limited (BMJ) and may not have been peer-reviewed. Any opinions or recommendations discussed are solely those of the author(s) and are not endorsed by BMJ. BMJ disclaims all liability and responsibility arising from any reliance placed on the content. Where the content includes any translated material, BMJ does not warrant the accuracy and reliability of the translations (including but not limited to local regulations, clinical guidelines, terminology, drug names and drug dosages), and is not responsible for any error and/or omissions arising from translation and adaptation or otherwise.