Article Text

Abstract
Introduction Asthma is a complex disease with heterogeneous expression/severity. There is growing interest in defining asthma endotypes consistently associated with different responses to therapy, focusing on type 2 inflammation (Th2) as a key pathological mechanism. Current asthma endotypes are defined primarily by clinical/laboratory criteria. Each endotype is likely characterised by distinct molecular mechanisms that identify optimal therapies.
Methods We applied unsupervised (without a priori clinical criteria) principal component analysis on sputum airway cells RNA-sequencing transcriptomic data from 19 asthmatics from the Severe Asthma Research Program at baseline and 6–8 weeks follow-up after a 40 mg dose of intramuscular corticosteroids. We investigated principal components PC1, PC3 for association with 55 clinical variables.
Results PC3 was associated with baseline Th2 clinical features including blood (rank-sum p=0.0082) and airway (rank-sum p=0.0024) eosinophilia, FEV1 change (Kendall tau-b R=−0.333 (−0.592 to −0.012)) and follow-up FEV1 albuterol response (Kendall tau-b R=0.392 (0.079 to 0.634)). PC1 with blood basophlia (rank-sum p=0.0191). The top 5% genes contributing to PC1, PC3 were enriched for distinct immune system/inflammation ontologies suggesting distinct subject-specific clusters of transcriptomic response to corticosteroids. PC3 association with FEV1 change was reproduced in silico in a comparable independent 14-subject (baseline, 8 weeks after daily inhaled corticosteroids (ICS)) airway epithelial cells microRNAome dataset.
Conclusions Transcriptomic PCs from this unsupervised methodology define molecular pharmacogenomic endotypes that may yield novel biology underlying different subject-specific responses to corticosteroid therapy in asthma, and optimal personalised asthma care. Top contributing genes to these PCs may suggest new therapeutic targets.
- asthma pharmacology
- asthma
Data availability statement
Data are available upon reasonable request. All data relevant to the study are included in the article or uploaded as supplementary information. All data used in this study will be publicly available on NCBI GEO GSE184433 upon publication.
This is an open access article distributed in accordance with the Creative Commons Attribution Non Commercial (CC BY-NC 4.0) license, which permits others to distribute, remix, adapt, build upon this work non-commercially, and license their derivative works on different terms, provided the original work is properly cited, appropriate credit is given, any changes made indicated, and the use is non-commercial. See: http://creativecommons.org/licenses/by-nc/4.0/.
Statistics from Altmetric.com
Key messages
What is the key question?
Can we discover asthma endotypes using transcriptomic data alone before/after corticosteroid treatment in asthmatic airway cells that are clinically relevant to disease typing and therapeutic response?
What is the bottom line?
In a population of 19 mainly severe asthmatic adults, we show that their sputum airway cell transcriptomic changes 6–8 weeks after a single systemic corticosteroid treatment can be used (without any a priori clinical/laboratory criteria) to define molecular pharmacogenomic endotypes that are associated with type 2 inflammation asthma clinical features and changes in lung function.
Why read on?
This methodology is readily adaptable to similar study designs of corticosteroid treatment response in asthma. The top contributing genes to these endotypes may yield novel biology of corticosteroid treatment response and new therapeutic targets.
Introduction
Asthma is a common complex disease with heterogeneity in both expression and severity. Multiple studies have addressed clinically based endotypes of asthma.1–8 Despite heterogeneity in asthma study populations and their defining clinical features/criteria, some universally recognised common clinical subgroups have emerged. These include mild atopic asthma originating in childhood, atopic asthma with lower lung function, and medication-resistant exacerbation-prone asthma. Clinical endotypes have also been consistently associated with different responses to therapy.9 With the advent of next generation biologics for the treatment of severe asthma, endotyping efforts have focused on identifying type-2 airway inflammation (Th2) asthma.10–14 Currently, asthma endotypes have been defined primarily by clinical laboratory or biomarkers criteria.9 For example, the Th2 clinical features include fractional exhaled nitric oxide (FeNO) >25 ppb, peripheral blood eosinophil count >300 (or >150, 2 cut-offs considered separately) cells/µL, and sputum eosinophils >2%. There has been no reported molecular clustering in asthma without these a priori clinical criteria.15 16 A common theme is that each endotype is likely characterised by distinct molecular mechanisms that may identify optimal therapies for targeting the endotype.1 2 5 6 17 Indeed, several studies have reported distinct transcriptomic differences that appear to correlate with clinical subgroups.7 18 19
The aim of this study is to extend the concept of molecular endotype identification in asthma in novel directions through RNA-sequencing (RNA-seq) of sputum airway cells derived from a subset of 19 asthmatic subjects in the Severe Asthma Research Program (SARP, Wake Forest University centre) at baseline before (baseline), and 6–8 weeks after (follow-up) administration of a 40 mg dose of intramuscular corticosteroid (CS).15 We used the unsupervised principal components (PCs)20–22 of transcriptomic changes following systemic CS treatment to define distinct molecular pharmacogenomic endotypes, derived independently of any a priori clinical criteria and evaluated these endotypes for their association with clinical features (focusing on Th2 ones) and clinical response outcomes.
Methods
Study population and biological samples
The study population consisted of 19 subjects from the National Heart, Lung and Blood Institute Severe Asthma Research Program 3 (SARP 3, Wake Forest University centre Institutional Review Board IRB00021507) ClinicalTrials.gov identifier NCT01750411. Twelve subjects in this longitudinal cohort have severe asthma and seven have non-severe (mild to moderate) asthma. All subjects underwent extensive phenotyping23 including an induced phenotype where each subject had systemic CS responsiveness characterised before (‘baseline’), and 6–8 weeks after (‘follow-up’) the administration of a 40 mg dose of intramuscular CS triamcinolone acetonide.15 Sputum was obtained at both baseline and follow-up using standardised SARP protocols.24–26 Thirty-eight transcriptome profile samples of subject sputum cells total were obtained using RNA-seq: 19 subjects×2 timepoints.
RNA-seq and data analysis
Expanded in online supplemental methods M1. Briefly, unsupervised principal component analysis (PCA) was applied on the subject-wise sample difference (follow-up minus baseline) column vectors of expression of 16 944 robustly detected genes to identify the dominant directions of sample variation in transcriptome space called PCs20 21 focusing on PC1–3. Sample PC coordinates were tested for association with the 55 core clinical variables, online supplemental table S1. Gene ontology (GO) enrichment analysis was performed on the top 5% contributing genes of each PC. All data used in this study will be publicly available on NCBI GEO GSE184433.
Supplemental material
Results
The 19 SARP subjects in this study are listed on online supplemental table S2 with select clinical variables at baseline, and their change (follow-up minus baseline) 6–8 weeks after a 40 mg dose of intramuscular CS. Sputum cell samples were obtained at baseline and follow-up, and the 19×2 sputum sample transcriptome profile were obtained using RNA-seq and analysed. Figure 1 outlines the analysis workflow and key results on these transcriptomic data with select clinical variables, and on a comparable independent set of airway epithelial cells (N=14 subjects) microRNAome dataset GSE3446627 on NCBI GEO to assess generalisability of our strategy and results in silico.
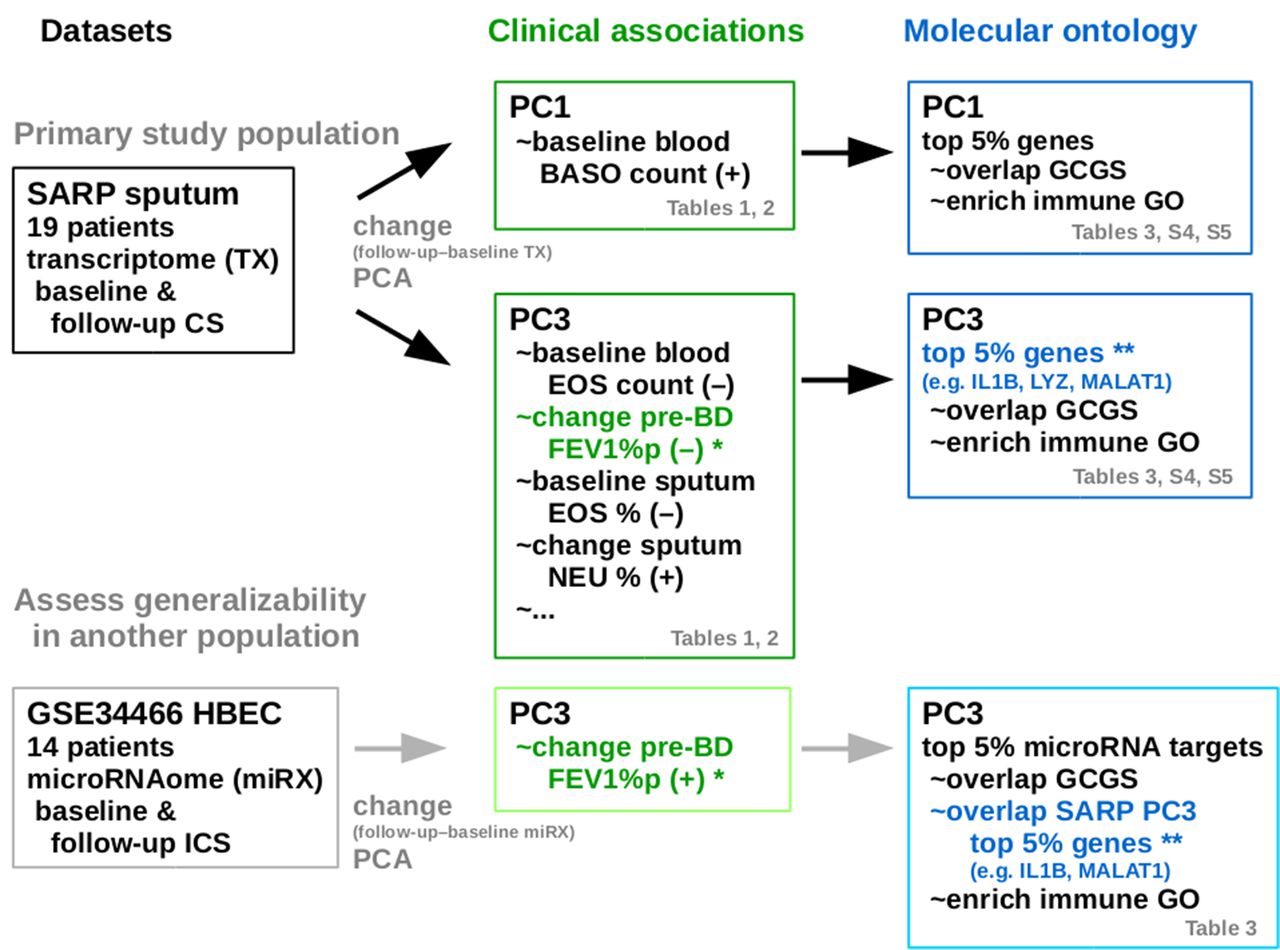
Outline of the analysis workflow and key results from the primary study population of 19-subject sputum transcriptome dataset with select clinical variables from the Severe Asthma Research Program, and on a comparable independent 14-subject airway epithelial cells (HBEC) microRNAome dataset GSE34466 on NCBI GEO for assessing the generalisability of the strategy and results in silico. CS, corticosteroid; BASO, basophils; EOS, eosinophils; GCGS, glucocorticoid gene set; GO, Gene ontology; HBEC, human bronchial epithelial cells; NEU, neutrophils; PC#, principal component #; PCA, principal component analysis; SARP, Severe Asthma Research Program.
Sputum cell transcriptomic PC1 and PC3 sample coordinate dichotomies are associated with Th2 clinical features
We applied PCA on the CS treatment sample difference/change (follow-up minus baseline, paired) column vectors of 16 944 genes for all 19 subjects. Without using any clinical variables, PCA identifies the directions of dominant global variance among the 19 subjects in this 16 944-gene dimensional sputum cell transcriptome space. PC1–3 accounted for 28.93%, 19.95% and 11.93% of the global transcriptomic variance, respectively. We plotted the 19 subjects in PC1–3 space, and visual inspection suggests transcriptomic clusters within quadrants of PC1/PC3 space, figure 2A–B.

(A, B) Principal component (PC) analysis of corticosteroid induced transcriptomic change (follow-up minus baseline) sample coordinates in the PC1–3 planes. (C) PC1 sample coordinate versus baseline blood basophil count. (D) PC3 sample coordinate versus baseline blood eosinophil count. Each subject is indicated by their unique 2-digit identifier, 7/19 non-severe asthmatics are in cyan. The PC1 and PC3 dichotomy line at 0 is draw in (A, B). The linear regression line is drawn in (C, D) and the Kendall tau-b correlation and 95% CI are indicated.
We dichotomised PC1 and PC3 coordinates at 0, respectively, to define transcriptomic endotypes, and we checked whether these dichotomies/endotypes were associated with CS treatment response in particular Th2 clinical features (eg, FeNO, sputum eosinophil %) and lung function change, table 1.
Select clinical variables (asthma severity, sex, age, body mass index (BMI), pre-bronchodilator (BD) FEV1% predicted) and Th2 clinical feature associations of two molecular endotypes of corticosteroid treatment response defined by corticosteroid induced sputum cell transcriptomic change (=follow up minus baseline) in PC1 and PC3 sample coordinates, respectively, dichotomised at 0 from the 19-subject Severe Asthma Research Program study
PC1 dichotomy was significantly associated with baseline blood basophil count (p=0.0191, Wilcoxon rank-sum). PC3 dichotomy was significantly associated with baseline blood eosinophil count (p=0.0082), baseline (p=0.0024) and change (p=0.0181) in sputum eosinophil %. Thus, the molecular endotypes of CS treatment response defined by PC1 and PC3 dichotomies are directly associated with baseline blood basophilia (PC1), baseline blood eosinophilia (PC3), and baseline/change in sputum/airway eosinophilia (PC3). We also noted there were no significant associations with FeNO or pre-bronchodilator (BD) FEV1 percent predicted (%p). PC2 dichotomised at 0 was not associated with any clinical variables here.
Sputum cell transcriptomic PC1 and PC3 sample coordinates associated with baseline blood basophil and eosinophil counts respectively
Next, to increase the power of our transcriptomic endotype analysis, we treated the subject PC1–3 coordinates as continuous variables (not dichotomised as above), and we checked whether these coordinates were associated with 55 core clinical variables, online supplemental table S1). We highlight select clinical variable associations for investigation in table 2 focusing on Th2 clinical features. In addition, we investigated these associations within the 12/19 severe asthma sub-population.
Select clinical variable associations of sputum cell transcriptomic change PC1 and PC3 sample coordinates and severity (binary) variable in the Severe Asthma Research Program study using Kendall tau-b correlation where* indicates significance where 0 lies outside the respective 95% CI
PC1 was significantly associated with baseline blood basophil count (Kendall tau-b correlation R=0.340 (0.020 to 0.597) 95% CI). PC2 was not associated with any clinical variables here. PC3 with baseline blood eosinophil count (R=−0.457 (−0.680 to –0.158)) and baseline sputum eosinophil % (R=−0.367 (−0.627 to –0.051)), figure 2C–D. PC1 and PC3 were not associated with baseline/follow-up/change in FeNO. Within the 12/19 severe asthma sub-population, the baseline blood basophil (PC1) and eosinophil (PC3) associations were not significant, but the baseline sputum eosinophil % (PC3) became greater (R=−0.509 (−0.769 to –0.102)).
Focusing on the PC1 versus baseline blood basophil count, and PC3 versus baseline blood eosinophil count associations, we used ROC curve analyses to assess the diagnostic performance of PC1 and PC3 as binary classifiers of high versus not high baseline blood basophil and eosinophil counts respectively, as the PC discrimination threshold is varied, figure 3A–B. We consider a subject to have a high blood basophil count if their blood basophil count >10 cells/μL. For blood eosinophil count, we considered two cut-offs: >300 cells/μL yielding just 4/19 (21%) high blood eosinophil subjects, and >150 cells/μL yielding 12/19 (63%) high blood eosinophil subjects. The areas under receiver operator characteristic curve (AUCCH) values of 0.883 (PC1 vs blood basophil), and 0.900, 0.815 (PC3 vs blood eosinophil at >300, >150 cells/μL cut-offs) indicate the CS treatment response PCs to be robust predictors of high baseline blood basophil and eosinophil counts, respectively.

Areas under receiver operator characteristic curve (AUCCH) analyses for: (A) PC1 sample coordinate and baseline blood basophil count >10 cells/μL. (B) PC3 sample coordinate and baseline blood eosinophil (EOS) count >300 cells/μL. (C) PC3 sample coordinate and baseline blood EOS count >150 cells/μL. (D) PC3 sample coordinate and change in pre-BD FEV1% predicted >0.
Sputum cell transcriptomic PC3 sample coordinates sputum macrophage and neutrophil % following CS treatment
While the primary focus in our work here is Th2 clinical feature associations of PC1/3, we noted that PC3 was significantly associated with baseline/follow-up/change in sputum neutrophil % (Kendall tau-b R=0.556 (0.284 to 0.745)), and change in sputum macrophage % (R=−0.485 (−0.699 to –0.193)), table 2, figure 4C–D. Change in sputum neutrophil and macrophage % associations remain significant within the 12/19 severe asthma subpopulation. Blood neutrophil count is not associated with PC1–3.

(A) PC3 sample coordinate versus follow-up bronchodilator response. (B) PC3 sample coordinate versus change in pre-bronchodilator FEV1% predicted. (C) PC3 sample coordinate versus change in sputum macrophage %. (D) PC3 sample coordinate versus change in sputum neutrophil %. Each subject is indicated by their unique 2-digit identifier, 7/19 non severe asthmatics are in cyan. The linear regression line is drawn in each and the Kendall tau-b correlation and 95% CI are indicated.
Sputum cell transcriptomic PC3 sample coordinates associated with change in pre-BD FEV1 following CS treatment
A notable result when the subject PC3 coordinates is treated as a continuous variable (not dichotomised at 0) is that PC3 is significantly associated with two lung function measurements following CS, table 2, figure 4A–B, namely change in pre-BD FEV1%p (Kendall tau-b R=−0.333 (−0.592 to –0.012)), follow-up BD response (R=0.392 (0.079 to 0.634)). Within the 12/19 severe asthma subpopulation both associations became greater, and interestingly PC1 is now significantly associated with baseline (R=0.485 (0.071 to 0.756)) and follow-up (R=0.576 (0.195 to 0.806)) BD response.
Focusing on the change in pre-BD FEV1%p with PC3, we used a ROC curve analysis to assess the diagnostic performance of PC3 for discriminating lung function improvement. We consider a subject to have improved lung function if their change in pre-BD FEV1%p following CS is >0. In this mainly severe asthmatic population (12/19 severe), just 2/19 had >10% increase in pre-BD FEV1%p and 8/19 had >0. The AUCCH value of 0.864 indicate PC3 to be a robust predictor of lung function improvement following CS treatment, figure 3D. That is, PC-defined molecular endotypes resulting from CS treatment response can be used to as a pharmacogenomics predictor of clinical response.
In contrast to a supervised analysis, no baseline/follow-up Th2 clinical features were significantly associated with BD response or with change in pre-BD FEV1%p, table 2, online supplemental table S3. We did note that change in FeNO was associated with change in pre-BD FEV1%p.
Top contributing genes to sputum cell transcriptomic PC1 and PC3 enriched for immune system and inflammation GOs
We regard the top 5% PC loading coefficient magnitude genes as the top contributing genes driving variation along each respective PC coordinate axis. There are ~847/16 944 (~5%) such genes ranked by loading coefficient magnitude per PC after adjusting for ties and repeat genes. We investigated their GO enrichments separately. In contrast to a supervised analysis, we similarly investigated the top 5% genes rank correlated (magnitude) with Th2 clinical features: baseline blood basophil/eosinophil counts and FeNO, and change in FeNO.
First, we found strong overlap between top 5% PC1 genes (OR 4.07 (3.22 to 5.13) Fisher exact 95% CI) and top 5% PC3 genes (OR 3.73 (2.94 to 4.73)) with our previously reported glucocorticoid gene set (GCGS),28 table 3. In contrast, the supervised top 5% Th2 clinical features correlated gene overlaps with GCGS were not significant or had smaller ORs. Also notable is that the top PC1 and PC3 gene sets strongly overlapped (OR 70.28 (59.02 to 83.70)), whereas the supervised top Th2 clinical features correlated gene sets overlaps were less strong (ORs range 0.22–6.29), table 4.
Overlaps between previously reported glucocorticoid gene set (GCGS) with the top 5% PC1 and PC3 contributing genes (unsupervised), the top 5% Th2 clinical feature rank correlated genes (supervised) from Severe Asthma Research Program, and target genes of the top 5% PC3 contributing microRNAs (unsupervised) from GSE34466
Overlaps between gene sets from the 19-subject Severe Asthma Research Program study: the top 5% PC1 and PC3 contributing genes (unsupervised), and the top 5% Th2 phenotypes rank correlated genes (supervised)
We separated the top 5% PC1 and PC3 contributing genes by loading coefficient sign prior to GO enrichment analysis, focused on the 10% highest enrichment scoring significant GO clusters, and summarised their keywords, table 5. For PC1 and PC3, we found significant and repeated enrichments of immune system and inflammation related ontologies among the top 10% scoring clusters. Interestingly, steroid metabolism ontologies are found in PC1 positive GO cluster 23, PC3 positive GO cluster 12 and PC3 negative GO cluster 100, data not shown. In contrast, the supervised top 5% Th2 clinical features correlated genes (except change in FeNO) had lesser enrichments for immune system and inflammation related GO clusters, online supplemental table S4.
Top 10% significant gene ontology (GO) clusters and their keywords for the top 5% PC1 and PC3 negative and positive contributing genes from the 19-subject Severe Asthma Research Program study
Airway epithelial cells microRNAome PC3 sample coordinates associated with change in pre-BD FEV1 following 8-week inhaled CS regimen
To assess the generalisability of our findings in silico, we applied the above unsupervised analysis on an comparable independent microRNA dataset GSE3446627 on NCBI GEO of 862-microRNA profiles of airway epithelial cells from bronchoscopic brushing of 14 steroid-naive (6 weeks before enrolment) asthma subjects at baseline before, and after an 8-week inhaled CS 200 µg two times a day, with pre-BD FEV1 measurements at both timepoints, figure 1. In contrast to the mainly severe asthmatic SARP study population where just 2/19 had >10% and 8/19 had >0% increase in pre-BD FEV1%p, in this population 4/14 had >10% and 8/14 had >0% increase in pre-BD FEV1%p.
First, we applied PCA on the 14-subject 8 weeks minus baseline sample difference column vectors of 862 microRNAs with PC1–3 accounting for 38.64%, 14.71% and 12.13% of the global microRNAome variance respectively, as we had done with the SARP transcriptome data above. Second, we found PC3 to be associated with change (8 weeks minus baseline) in pre-BD FEV1%p (Kendall tau-b R=0.389 (0.001 to 0.675)). We highlight the positive correlation (R=0.389) of pre-BD FEV1%p with the GSE34466 microRNAome PC3, in contrast to the negative correlation (R=−0.333) of pre-BD FEV1%p with the SARP transcriptome PC3 above. Finally, we identified 405 functionally validated target genes (miRTarBase July 15 201929) of the top 5% PC3 contributing microRNAs by their PC3 loading coefficient magnitude and found significant overlaps with our earlier top 5% PC3 contributing genes (OR 3.65 (2.73 to 4.89), data not shown), and with our previously reported GCGS (OR 5.63 (4.19 to 7.57)), table 3.
Discussion
We identified molecular pharmacogenomic endotypes to an induced phenotype of response to systemic CSs in mainly severe asthmatic subjects using unsupervised PCA of a subject’s sputum airway cell transcriptomic changes.15 16 We used resulting the PC1 and PC3 coordinates (figure 2) to define endotypes in two ways: dichotomised at the 0 coordinate point (binary variable) and as is (continuous variable). Respectively, we investigated PC1 and PC3 separately for associations with a set of 55 clinical variables, focusing on Th2 clinical features. We used the top 5% genes contributing to these PCs to uncover biologically and clinically meaningful treatment response genes and ontologies. Crucially, the molecular endotypes defined in this fashion were associated with clinical response to CS. Namely, PC3 is associated with treatment-related change in pre-BD FEV1 and follow-up BD response (table 2). While the molecular endotypes were also related to baseline Th2 status, with PC1 associated with baseline blood basophils, and PC3 with baseline blood and sputum eosinophils (tables 1–2, figures 2–3), none of these baseline Th2 clinical features were themselves associated clinical response to CS (online supplemental table S3). Within the 12/19 severe asthma subpopulation, the baseline blood basophil (PC1) and eosinophil (PC3) associations were diminished, PC3 associations with sputum eosinophil % and change in pre-BD FEV1 and follow-up BD response became greater. The differences between the molecular treatment response endotypes and Th2 status is further emphasised through different biologies represented by ontology enrichment analysis of top loading (contributing) genes from the PC-defined endotypes (table 5) versus the top correlated genes with any Th2 clinical feature (online supplemental table S4). Finally, we demonstrated that the molecular endotypes are generalisable at the level of the airway epithelial cell, in an independent inhaled CS treatment cohort analysis of microRNA data. Overall, molecular treatment endotypes appear to be more representative of CS induced changes in biology and more specific predictors of clinical CS treatment response.
Underscoring the Th2 biologic significance of our findings, the endotype defined by positive PC1 coordinates mainly has subjects with baseline peripheral blood basophilia, figure 3A. Basophils are underappreciated mediators of Th2 immune response that are increasingly recognised as mediators of thymic stromal lymphopoietin induced Th2 inflammation.30 31 In contrast, the endotype defined by negative PC3 coordinates has subjects with the classic Th2 phenotype of blood and sputum eosinophilia,32 33 figure 3B–C. This emphasises the role that Th2 status may play in response to CS34 and supports Th2 status as a key underlying feature of our molecular endotypes. From a clinical response perspective, as the PC3 coordinates increased, there was a significant decrease in lung function change following CS administration, figure 4B. Given that blood/sputum eosinophils were not found to be associated with lung function change, the PC3 molecular endotype contains features that represent a more comprehensive biological picture of treatment response than blood/sputum eosinophils alone. This is consistent with previous work suggesting that molecular features might be superior to clinical characteristics in predicting response to CS in severe asthma from children in SARP.35 The top 5% PC1 and PC3 contributing genes were enriched for CS signalling indicated by their significant enrichment for our previously reported GCGS28 table 3. Thus, these mainly severe asthmatic subjects appear to cluster into at least two distinct types of clinically and biologically relevant molecular responses to CS treatment.
We previously applied unsupervised PCA to identify top 5% PC contributing genes to be associated with human fetal lung development in the context of embryonic gestational age, vitamin D signalling and CS response.20 21 36 While those analyses were aimed at expanding basic understanding of lung development biology, our current study suggests that molecular subgroups resulting from such unsupervised analysis may also reflect distinct biologic mechanisms in response to CS treatment. The method may be generally applied to classifying and predicting CS treatment response. In contrast to supervised analyses using clinical variables, unsupervised PCA (and more generally surrogate variable analysis SVA22) has two distinct advantages. First, a gene’s contribution is not limited to a single PC as shown by the strong overlap between top PC1 and PC3 contributing genes, table 4. Indeed this might reflect the interactome being the basis of a systems biology model, or pleiotropy in general. Second, we can systematically identify and prioritise the top N contributing genes per PC to clarify both individual genes and their ontologies that underlie the endotypic subgroups. We highlight the effectiveness of our method by contrasting it with supervised analysis using the top 5% Th2 clinical features (ie, blood and sputum eosinophilia, high FeNO) correlated genes which ultimately had fewer overlapping genes with each other (table 4) and lesser enrichment for GCGS (table 3), immune system and inflammation related ontologies (online supplemental table S4) suggesting less biologic certainty for prominent involvement of these processes.
Our work complements current clinical cluster analyses. A recent SARP analysis focused on CS response in severe asthmatics18 suggested four potential CS response clusters, with the cluster associated with the greatest CS response demonstrating the highest levels of blood eosinophils. Another current SARP-3 analysis26 identified differences in pre-BD and post-BD lung function longitudinal trajectories between subjects stratified into four groups by baseline sputum eosinophil % high/low+neutrophil% high/low. While our subset analysis does not have sufficient sample size to assess the presence of such clinical clusters, the association of blood eosinophils and sputum neutrophils with PC3 supports a possible overlap of a portion of the clinical endotype with molecular features. Nonetheless, given the deficiencies of supervised analysis to fully capture meaningful ontological associations, it is also likely that molecular endotyping can independently yield additional novel biology when used as an independent metric, as supported by our ontology enrichment analysis. Others and we previously cited the advantage of molecular endotyping for predicting therapeutic response in asthma.37 Fitzpatrick et al 35 noted that clinical features were of limited use for predicting triamcinolone response, whereas systemic mRNA expression of inflammatory cytokines and chemokines related to interleukin (IL)-2, IL-10 and tumour necrosis factor signalling pathways, including, AIMP1, CCR2, IL10RB, and IL5, strongly differentiated children who failed to achieve control with triamcinolone treatment. Our analysis also includes prediction of response using molecular features that were not noted using clinical biomarkers alone,15 16 but in the context of molecular endotypes generated by genome-wide RNA-seq CS response data.
Several studies have described gene expression signatures that may predict CS responsiveness in asthma.35 38 However, these have generally focused on circulating blood cells rather than airway cells, and on baseline differential gene expression differences between predefined responding and non-responding subject populations. Moreover, their prior expression analyses focused on panels of preselected candidate genes. In contrast, our molecular endotyping of each subject is based on whole transcriptomic change in sputum cells following CS treatment. Our model has the unique advantage of capturing dynamic changes inherent in transcriptional response to CS treatment that is agnostic to clinical outcomes/features a priori and gene/molecular preselection biases, and yet our resulting molecular endotypes were found to be associated with clinical variables at baseline and follow-up. Interestingly, 3 genes* from a 6-gene baseline sputum gene expression signature (CLC, CPA3, DNASE1L3, IL1B*, ALPL*, CXCR2*)39 40 reported to discriminate inflammatory phenotypes of asthma and predict ICS treatment response are among the top 5% genes contributing to PC1 and PC3 with IL1B ranked 2, online supplemental table S5, Berthon et al 40 noted the 3 genes to be neutrophil markers and PC3 was significantly associated with baseline/follow-up/change in sputum neutrophils, table 2, figure 4D.
The small sample size of our study is an important multifaceted issue. Clinically, severe asthma is heterogeneous and sample size limits our ability to fully characterise this heterogeneity. With regards to generalising the pre-BD FEV1%p association to other asthma populations, we addressed this technically in silico in a comparable independent microRNA dataset GSE3446627 (cf. Result 6) where we found the resulting microRNAome change PC3 to be associated with change in pre-BD FEV1%p with an opposite signed correlation. This is intriguing considering that expression of microRNAs and their target genes are generally understood to be inversely correlated. Also, MALAT1 (ranked 6 in PC3, and a target of a top 5% GSE34466 microRNAome PC3 hsa-miR-429, online supplemental table S5) is one of five key long non-coding RNAs in an asthma-associated competing endogenous network targeted by eight potential new drugs.41 Despite sample size, we achieved potentially meaningful clinical endotypes. It is notable that neutrophils, eosinophils and basophils (peripheral blood/sputum inflammatory cells clinically known to be associated with asthma severity) are relevant to transcriptomic endotyping for steroid response thus suggesting that a simple Th2 versus non-Th2 dichotomy may be insufficient to describe response to inhaled steroids in severe asthma.
Conclusions
Our analysis of sputum airway cell RNA-seq data in well-characterised mainly severe asthmatics identified distinct molecular pharmacogenomic endotypes in response to an induced phenotype with systemic CSs. Since CSs remain a mainstay of therapy for most asthmatics with persistent symptoms, these endotypes may clarify biological differences underlying the heterogeneity in CS treatment response, and provide an objective useful model for predicting treatment response and developing novel therapies. Our analysis suggest that unsupervised PCA/SVA can be used to objectively define testable (across multiple datasets and populations) molecular endotypes that may yield novel biology underlying different responses to CS therapy in asthma, identify potential new therapeutic targets, and improve the identification of subjects most likely to respond to CSs alone versus those who may benefit from a biologic added to their CS regimen leading to optimal personalised asthma care. Potentially such molecular endotyping could be applied as a diagnostic test using sputum induction and rapid gene expression measurements designed to delineate therapy specific responses in asthma.
Data availability statement
Data are available upon reasonable request. All data relevant to the study are included in the article or uploaded as supplementary information. All data used in this study will be publicly available on NCBI GEO GSE184433 upon publication.
Ethics statements
Patient consent for publication
Ethics approval
The institutional review boards of all participating centers approved this study as part of the National Heart, Lung and Blood Institute Severe Asthma Research Program 3 (SARP 3) ClinicalTrials.gov identifier CT01750411.
References
Supplementary materials
Supplementary Data
This web only file has been produced by the BMJ Publishing Group from an electronic file supplied by the author(s) and has not been edited for content.
Footnotes
ATK, MJM and JL contributed equally.
Contributors ATK and KGT have full access to all data in this study and take responsibility for the data integrity and accuracy of the data analyses. Acquisition, analysis or interpretation of the data: all authors. Drafting of the manuscript: ATK, DAM, ERG, KGT, STW. Statistical analysis: ATK, MM, KGT. Study concept, design and supervision: KGT, DAM, ERG, STW.
Funding This study was supported by the National Heart, Lung and Blood Institute awards R01 HL127332 (KGT), R01 HL129935 (KGT), R01 HL092197 (KGT), U01 HL065899 (STW), P01 HL132825 (STW) R01 HL139634 (MJM), U10 HL109164 (ERB), UG1 HL139054 (ERB), R01 HL125734 (ATK), U19 AI118608 (ATK).
Competing interests None declared.
Provenance and peer review Not commissioned; externally peer reviewed.
Supplemental material This content has been supplied by the author(s). It has not been vetted by BMJ Publishing Group Limited (BMJ) and may not have been peer-reviewed. Any opinions or recommendations discussed are solely those of the author(s) and are not endorsed by BMJ. BMJ disclaims all liability and responsibility arising from any reliance placed on the content. Where the content includes any translated material, BMJ does not warrant the accuracy and reliability of the translations (including but not limited to local regulations, clinical guidelines, terminology, drug names and drug dosages), and is not responsible for any error and/or omissions arising from translation and adaptation or otherwise.