Article Text

Abstract
Background A basic paradigm of human infection is that acute bacterial disease is caused by fast growing planktonic bacteria while chronic infections are caused by slow-growing, aggregated bacteria, a phenomenon known as a biofilm. For lung infections, this paradigm has been thought to be supported by observations of how bacteria proliferate in well-established growth media in the laboratory—the gold standard of microbiology.
Objective To investigate the bacterial architecture in sputum from patients with acute and chronic lung infections.
Methods Advanced imaging technology was used for quantification and direct comparison of infection types on fresh sputum samples, thereby directly testing the acute versus chronic paradigm.
Results In this study, we compared the bacterial lifestyle (planktonic or biofilm), growth rate and inflammatory response of bacteria in freshly collected sputum (n=43) from patient groups presenting with acute or chronic lung infections. We found that both acute and chronic lung infections are dominated by biofilms (aggregates of bacteria within an extracellular matrix), although planktonic cells were observed in both sample types. Bacteria grew faster in sputum from acute infections, but these fast-growing bacteria were enriched in biofilms similar to the architecture thought to be reserved for chronic infections. Cellular inflammation in the lungs was also similar across patient groups, but systemic inflammatory markers were only elevated in acute infections.
Conclusions Our findings indicate that the current paradigm of equating planktonic with acute and biofilm with chronic infection needs to be revisited as the difference lies primarily in metabolic rates, not bacterial architecture.
- pneumonia
- cystic fibrosis
- respiratory infection
- bacterial infection
Data availability statement
Data are available upon reasonable request. All data relevant to the study are included in the article or uploaded as supplementary information. All data relevant to the study are included in the manuscript and as supplementary material.
This is an open access article distributed in accordance with the Creative Commons Attribution 4.0 Unported (CC BY 4.0) license, which permits others to copy, redistribute, remix, transform and build upon this work for any purpose, provided the original work is properly cited, a link to the licence is given, and indication of whether changes were made. See: https://creativecommons.org/licenses/by/4.0/.
Statistics from Altmetric.com
Key messages
What is the key question?
Acute infections are attributed to the action of planktonic bacteria, whereas chronic infections are described as involving biofilms; however, this basic paradigm of bacterial special structure in pneumonia remains unclear.
What is the bottom line?
This study reveals that the difference between acute and chronic lung infections is not the presence and absence of biofilm aggregates, but that acute infections have higher metabolic activity.
Why read on?
This paper challenges a 40-year-old (1982) paradigm of how bacteria proliferate in acute versus chronic lung infection. Our data reveal that biofilm growth is not reserved for chronic infections such as cystic fibrosis, but also predominates in community-acquired pneumonia, evoking equal inflammation of the lung, but with higher bacterial growth rates in acute infection.
Introduction
In the planktonic form, bacteria appear as single cells, whereas in the sessile form, bacteria are organised into multicellular aggregates, commonly referred to as biofilm.1 No complete consensus definition of a biofilm exists but clinically relevant biofilms are often defined as ‘A coherent cluster of bacterial cells imbedded in a biopolymer matrix, which, compared with planktonic cells, shows increased tolerance to antimicrobials and resists the antimicrobial properties of the host defence’.2 Bacteria can readily transition between planktonic and biofilm lifestyles, and this phenomenon has been studied extensively in vitro.3–5 Growth in either the planktonic or biofilm lifestyle has significant consequences for bacterial phenotypes.6 One of the most striking differences between in vitro grown planktonic and biofilm bacteria is antibiotic tolerance, in which biofilm bacteria exhibit increased survival on exposure to multiple classes of antimicrobials.7 8 This enhanced resistance has been attributed to a number of bacterial functions, including slow growth, altered expression of antimicrobial resistance mechanisms and possible depletion aggregation.9–11 Based on these in vitro data, acute infections are often attributed to the action of planktonic bacteria, since they are generally curable with antibiotics, whereas chronic infections are described as involving biofilms, as they are recalcitrant to antibiotic therapies.12 13 However, this basic paradigm has not been quantitatively tested in samples from human infection sites, primarily because of the difficulties in imaging the bacterial populations in these samples with high resolution.
To address this gap in knowledge, we directly tested the existing paradigm that acute human infections are caused by planktonic cells and chronic infections are caused by biofilms. This was accomplished by quantifying the bacterial lifestyle (planktonic or biofilm), the growth rate and the degree of inflammation in sputum samples from patients with acute community-acquired pneumonia (CAP) without known chronic lung disease, acute pneumonia in chronic obstructive pulmonary disease (COPD) and chronic infections in cystic fibrosis (CF). Our overall aim was to investigate similarities and differences in the bacterial architecture in sputum from patients with either acute (CAP and COPD) or chronic (CF) lung infections.
Materials and methods
Additional methods are presented as online supplemental material.
Supplemental material
Study design, setting, population and data collection
Patients with suspected pneumonia were prospectively recruited from 1 September 2016 to 1 January 2019 from two hospitals in Denmark: CAP or COPD from Nordsjællands Hospital, Denmark, and patients with CF from the Copenhagen CF Centre at Rigshospitalet, Denmark. Inclusion criteria for patients admitted with CAP and COPD were ≥18 years of age and purulent expectoration and at least one of the following symptoms: cough, chest pain or fever (>38.3°C rectally or >37.8°C auricular). Inclusion criteria for patients with CF attending the outpatient clinic were ≥18 years of age and the presence of a chronic lung infection. In CF, chronic bacterial infection was defined as the presence of pathogens in the lower respiratory tract at each monthly culture for more than 6 months, or for a shorter time in the presence of increased antibody response to pathogens (>2 precipitating antibodies, normal: 0–1).14 15 Patients from all groups were excluded if they had received antibiotics within 7 days of inclusion, were not able to expectorate, were unwilling or unable to consent or were expected not to survive the next 72 hours (figure 1). Among patients with CAP, information on COPD was retrieved from patient files and included self-reported diagnosis. All patients with CF were included, even though all were treated with antibiotics as part of routine clinical care. Data on patient demography and comorbidities were obtained from a questionnaire given to participants on the day of inclusion. Same day paraclinical parameters were obtained from patient medical records. Data on prior antibiotic treatment and corticosteroid use were obtained from patient questionnaires and medical records.

Flow chart of study and final diagnoses of patients recruited. The majority of patients screened and subsequently not recruited did not meet the requirements for untreated acute infection. CAP, community-acquired pneumonia; CF, cystic fibrosis; COPD, chronic obstructive pulmonary disease.
Ex vivo patient samples
Expectorated sputum samples were obtained from patients with CAP, COPD and chronic CF infections. Sputum samples (n=43) were fixed immediately after expectoration in phosphate-buffered saline that contained 4% paraformaldehyde and were embedded in paraffin. The sputum volumes range from 0.5 mL to 1 mL. Sections of 4.0 µm and 30.0 µm were cut using a standard microtome and were fixed on glass slides. The slides were stored at 4°C pending further analysis.
Preparation, staining and microscopy of sputum specimens
Sputum specimens measuring 4.0 µm and 30.0 µm were prepared and stained with peptide nucleic acid fluorescent in situ hybridisation (PNA-FISH) probes and 4′,6-diamidino-2-phenylindole (DAPI), as described elsewhere.16 A Texas Red-conjugated PNA-FISH probe specific for bacterial 16S rRNA (AdvanDx, USA) was used to stain all bacteria present in the sputum. Specimen slides were scanned using a confocal laser scanning microscope (CLSM) (Axio Imager.Z2, LSM 880, Zeiss, Germany) and the accompanying software (Zen V.2.1, Germany). All images were obtained through a 63×/1.4 oil objective running a combination of two 405 nm and 594 nm lasers running in parallel tracks for excitation, with an emission range of 410–552 nm for DAPI and 602–686 nm for Texas Red. All images were obtained using identical levels of laser power and voltage on photodetectors (gain), respectively, for both tracks. A resolution of 2048×2048 pixels in the dimension of 134.95 (X)×134.95 (Y)×1.82 (Z), with Z-stack increments of 0.455 µm, was used for qualitative analysis. All pixels were scanned twice in an averaging mode at a colour depth of 16 bits.
For quantitative FISH and three-dimensional (3D) microscopy analysis, images of sputum specimens measuring 30.0 µm thick were obtained using a 7×7 tile scan with a 20% overlap between tiles. After tile stitching using a strict setting, the final images each measured 1304.0 (X)×1304.0 (Y)×52.65 (Z), with a resolution of 2320×2320 pixels and Z-stack increments of 0.351 µm. Each pixel was scanned twice in an averaging mode. Raw images were processed using Imaris V.8.2 (Bitplane, Switzerland). Objects ranging in size from 0.5 µm3 to 5.0 µm3 were classified as planktonic cells. Objects larger than 5.0µm3 were classified as aggregates, and objects smaller than 0.5µm3 were excluded from analysis.
Statistical methods
Statistical significance was evaluated using Student’s t-test, Wilcoxon test, Kruskal-Wallis test and ordinary one-way analysis of variance, followed by Dunnett’s or Bonferroni’s multiple comparison test. A p value of ≤0∙05 was considered statistically significant. Tests were performed using GraphPad Prism V.6.1 (GraphPad Software, La Jolla, California, USA) and Microsoft Excel (Microsoft Corp, Redmond, Washington, USA).
Results
A total of 151 patients with CAP (n=72), COPD (n=65) and CF (n=14) were screened for inclusion. We excluded 79 patients because they had received antibiotic treatment within 7 days of enrolment, and 9 patients were excluded because they were diagnosed with chronic lung diseases other than COPD. In total, 43 patients (16 with CAP, 13 with COPD and 14 with CF) were included in our study (figure 1).
Baseline characteristics of patients
Patient characteristics on admission are described in table 1. Patients with CAP and COPD were older and had higher levels of C reactive protein than CF patients.
Characteristics of 43 patients with lower respiratory tract infection
Microbiological findings
Potential causative bacterial pathogens were detected in 50% of patients with CAP, 46% of patients with COPD and 100% of patients with CF (see online supplemental tables 1 and 3). Bacteria identified in patients with acute infections included Streptococcus pneumoniae, Haemophilus influenzae and Moraxella sp, Klebsiella sp, Pseudomonas aeruginosa and Staphylococcus aureus. Finally, bacteria identified in patients with CF included P. aeruginosa (79%), Achromobacter xylosoxidans, S. aureus, Mycobacterium abscessus, Klebsiella pneumoniae, Stenotrophomonas maltophilia and Burkholderia multivorans. Virus detection was performed for patients with CAP and COPD using a nasopharyngeal swap or sputum sample (see online supplemental tables 2 and 4). Virus were detected in 50% of patients with CAP and among them 63% have co-infection with detected pathogens. In addition, virus was detected in two patients with COPD and only one have a co-infection.
Supplemental material
Supplemental material
Supplemental material
Supplemental material
Supplemental material
Biofilms and single cells in all infection types
3D projections of biofilm and planktonic cells were obtained within CAP, COPD and CF sputum samples (figure 2A–C). These images revealed that the bacterial biomass within sputum samples from each infection type varied by at least 100-fold, although there was no difference in bacterial numbers between infection types (figure 2D). It was then determined whether the bacteria in each sputum sample were present as planktonic or aggregated cells. Planktonic cells were defined as those measuring 0∙5–5∙0 μm3, and cells in biofilm aggregates were defined as objects >5∙0 μm3. All sample types contained both biofilm and planktonic cells, although on average, more bacterial biomass was present in biofilms than in planktonic cells (figure 2F). There were multiple samples within each type in which the biomass was dominated by biofilms (>90%), whereas only 2 CAP and 2 COPD samples had a planktonic cell biomass greater than 50%. There was a broad distribution of biofilm sizes in all samples, and 40 of the 43 samples had biofilms of at least 100 µm3 (figure 2E). In 19 samples (7 CAP, 5 COPD and 7 CF), more than 40% of the bacterial biomass was comprised of biofilms of 100 µm3 or larger.

Biofilms and planktonic cells are observed across infection types. (A–C) Representative projections of confocal images of sputum samples of CAP with no detected pathogen (A), COPD with Moraxella sp (B) and CF with Pseudomonas aeruginosa (C). Specimens were stained with Tamra-5 (red) using PNA-FISH probes specific to bacterial 16S rRNA and DAPI m(blue). Scale bar is 10 µm. (D) Median total biomass of bacteria by infection type. Bacterial biomass was calculated on each sample (n=43) by counting the voxels representing bacteria after image analysis pipeline. There was no significant difference in sample biomass between infection types (p<0.05, Kruskal-Wallis test). (E) Comparing median sample intensity across infection type. Bacterial objects on each sample were identified, classified as either planktonic cells (≤5 µm3) or biofilms (>5 µm3) and their per cent contribution to total biomass was calculated. We found CAP samples to have the higher median intensity than CF samples (p<0.05, Kruskal-Wallis test), while COPD and CF samples, typically described chronic infections, have equivalent median intensity. (F) Comparing median sample intensity in biofilm (red) vs planktonic cells (black). We also found the median intensity of voxels in biofilms is higher than in planktonic cells (p<0.0001, Wilcoxon test). CAP, community-acquired pneumonia; CF, cystic fibrosis; COPD, chronic obstructive pulmonary disease; DAPI, 4′,6-diamidino-2-phenylindole; PNA-FISH, peptide nucleic acid fluorescent in situ hybridisation.
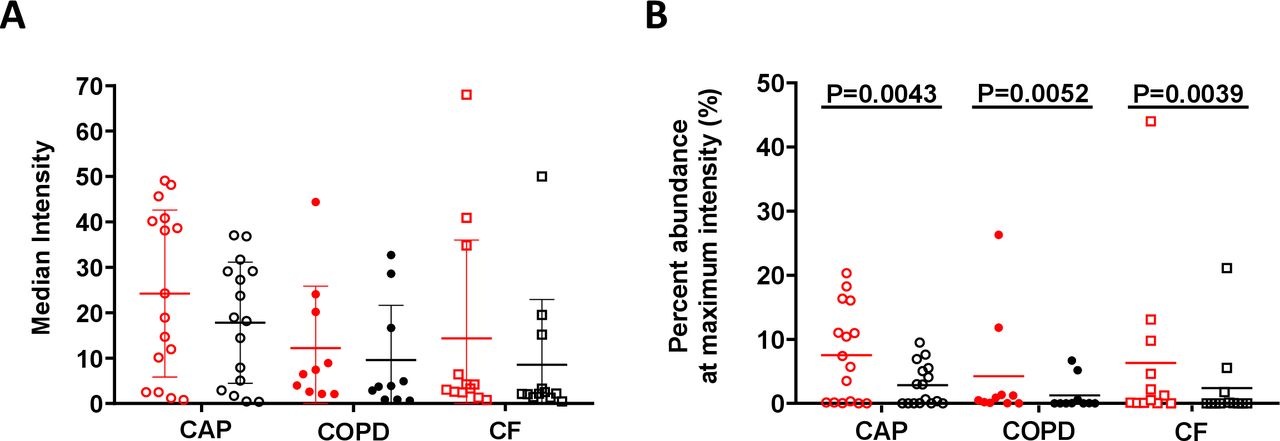
Growth estimates based on fluorescence in sputum samples
PNA-FISH has the added benefit of providing quantitative information regarding the number of ribosomes within a cell, which can be used as an indirect measurement of metabolic activity.17 Confocal images enabled quantification of fluorescence from 3D images at the single-cell level, thus avoiding several of the inherent challenges of 2D analyses. The distribution of bacterial fluorescence intensities was examined, and the intensity that encompassed at least 50% of the bacterial population was calculated. The fluorescence intensity of bacterial cells in patients with CAP was significantly higher than that of bacterial cells in patients with CF and COPD, which indicates that populations in the CAP infecting bacteria had more ribosomes (figure 3A). In addition, biofilms in all sample types had significantly more cells at the maximum growth rate than planktonic cells (figure 3B). These results indicate that bacterial cells in patients with acute infections had more ribosomes, and thus higher metabolic activity, than those in patients with chronic lower respiratory tract infections (LRTIs). Additionally, the bacteria with higher ribosome numbers were enriched in biofilms than in planktonic cells in all sample types. The fluorescence intensity measurement from PNA-FISH staining in aggregates truly correlates with growth rate as there were no visible trends toward any form of dimming of mean fluorescence intensity units (FU) obtained from the biomass as the layers moved through the samples. Based on the quantified mean FU as a function of layer depth, linear regression with an F-test was used to assess if there was a dimming gradient from top to bottom of the FU. There was no significant slope in the regression based on the data, indicating that there was no significant gradient through the layers of the 4-micrometre samples (sample 6, p=0.24; sample 21, p=0.06; and sample 45, p=0.18) (see online supplemental figure 3D-F). The same was valid for both the background signal and the signal from the DAPI-stained biomass, indicating no lost signal due to depth in the samples. In the nine 30-micrometre thick samples, the mean FU was quantified in each layer and in 3, three samples (9, 32 and 37) did not have a significant slope. Of the remaining six samples, only sample 6 had a significant negative slope with depth, indicating a loss of intensity as a function of depth. The other five samples had a positive slope meaning the regression increase with depth (see online supplemental figure 3G-O).
Supplemental material

Estimation of bacterial growth rate based on fluorescence intensity. (A) The median intensity of bacterial voxels in biofilm (red) and planktonic (black) cells from infection types. We calculated the intensity emitted by biofilm and planktonic cells from each infection type and compared CAP infection samples with both COPD and CF samples. We found that CAP samples have higher intensity in both biofilm and planktonic cells than COPD (p=0.0356, Kruskal-Wallis test), suggesting that CAP infections have an increased growth rate compared with COPD and CF. (B) Per cent of bacterial population at maximum intensity. We calculated the portion of voxels at the highest fluorescence intensity value of biofilm (red) and planktonic (black) cells on each sample. We compared biofilms to planktonic cells within each infection type and found that biofilms have higher fluorescence intensity that planktonic cells in all infection types (p<0.01, unpaired Wilcoxon test). CAP, community-acquired pneumonia; CF, cystic fibrosis; COPD, chronic obstructive pulmonary disease.
Based on the data in online supplemental figure 1D, we have estimated our study to be well powered, with 1-beta exceeding 0.943, for demonstrating a difference in FU between CF and CAP and between CF and COPD with p<0.05. However, the data indicate that our study was underpowered for finding a significant difference in FU between CAP and COPD with p<0.05.
Supplemental material
Inflammatory cell distribution and degree of inflammation
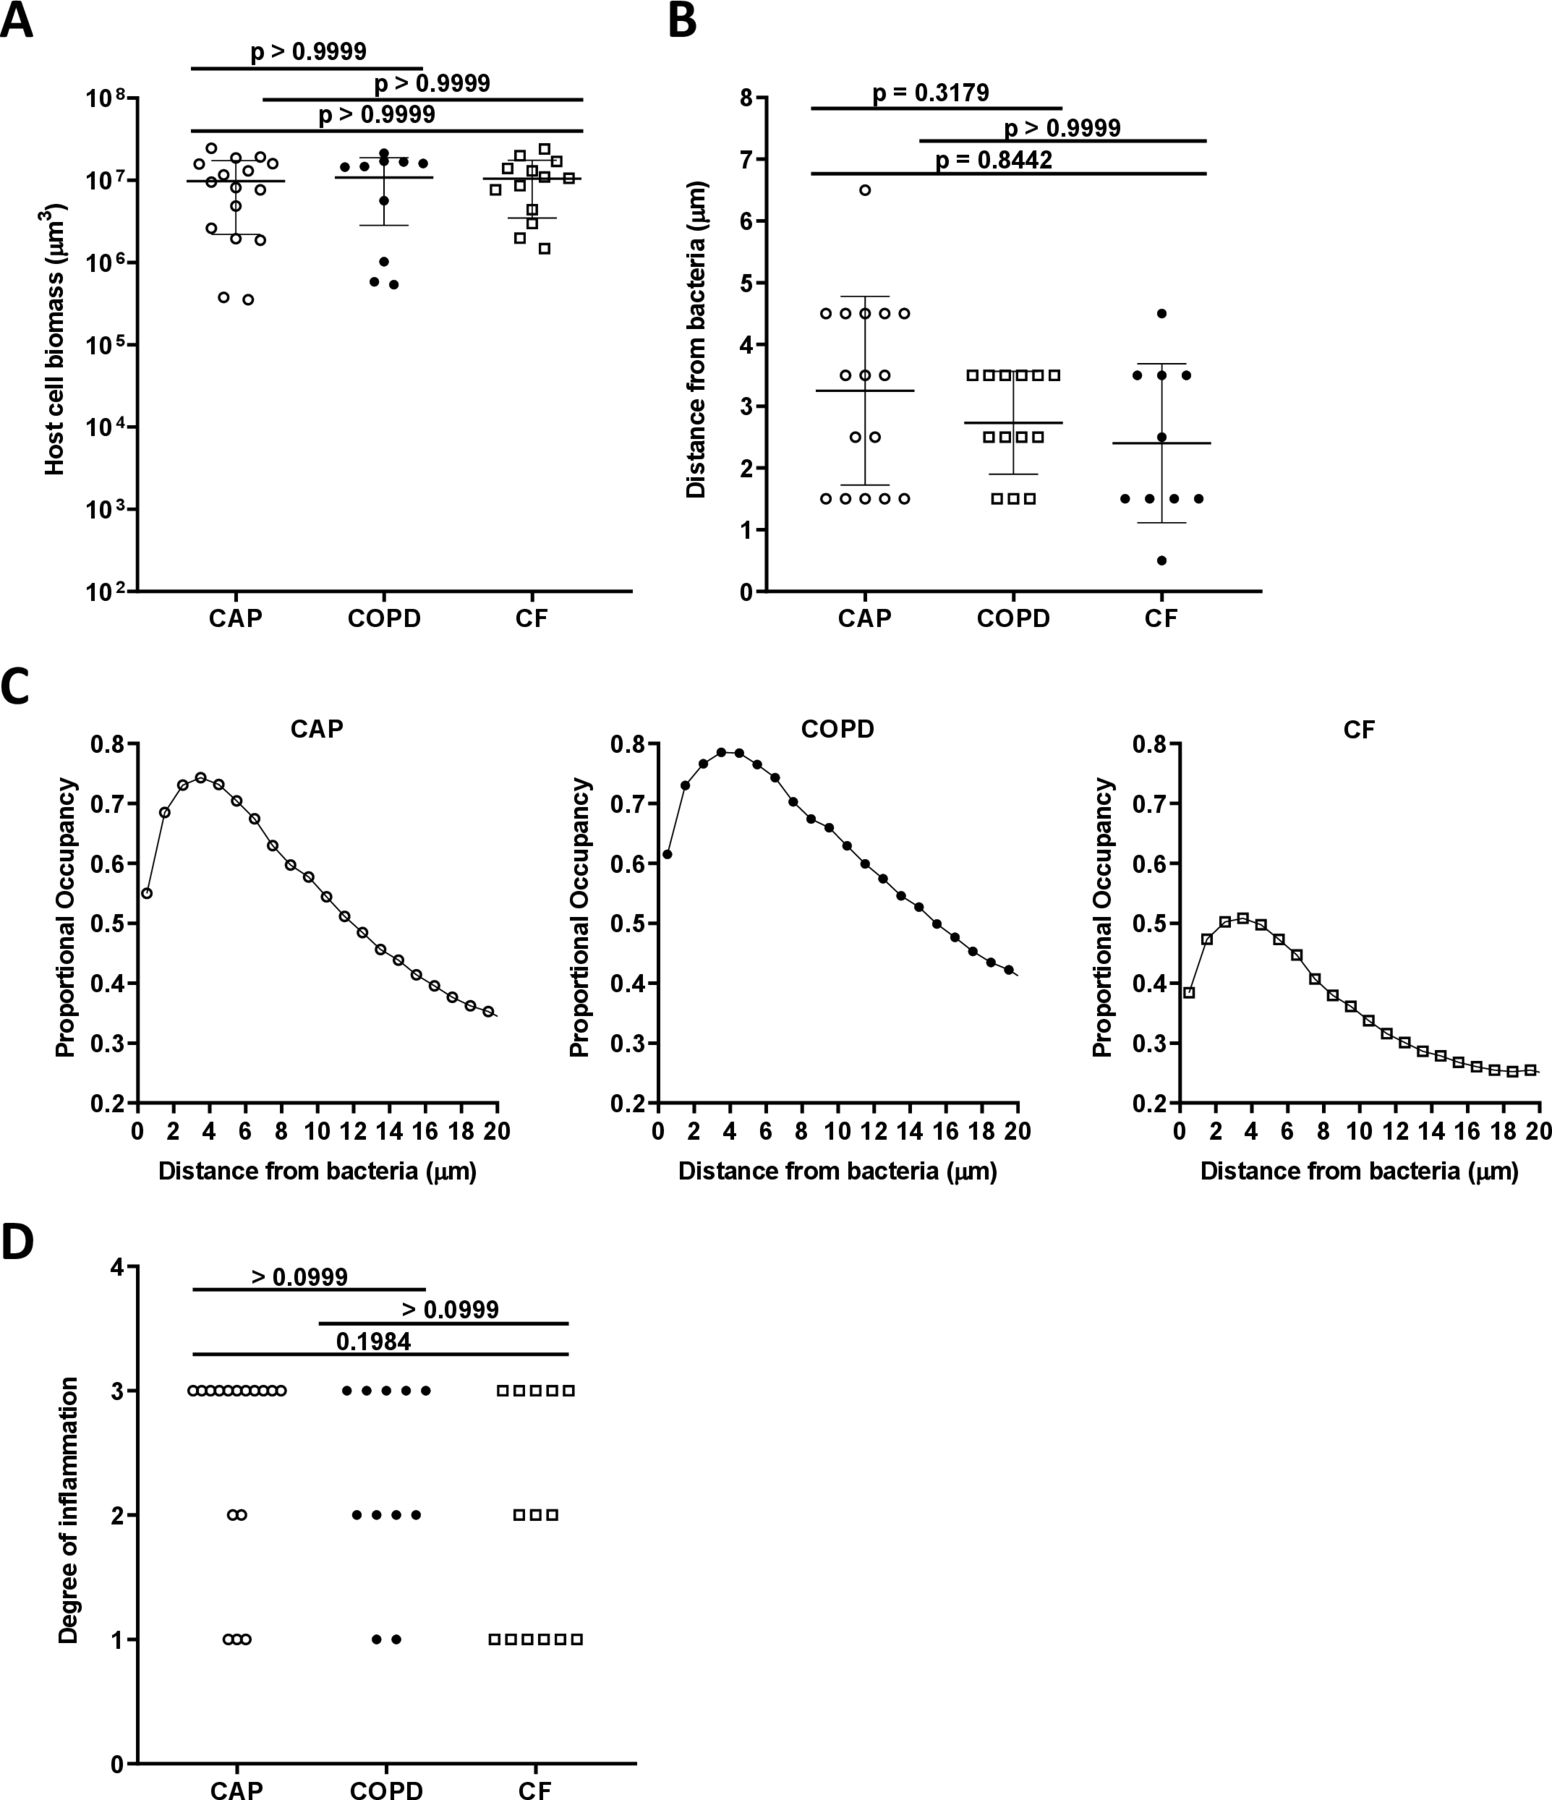
Quantification of DAPI-stained inflammatory cells revealed no significant difference between inflammatory cell biomass in the three patient categories (see figure 4A). A custom analysis pipeline was used to evaluate the localisation of each inflammatory cell relative to the bacteria. This analysis revealed a proportional occupancy of inflammatory cells to bacterial cells, which quantitatively assessed the location of inflammatory cells in relation to bacterial cells compared with a null model in which the inflammatory cells were randomly positioned. This analysis found that inflammatory cells were not randomly distributed but were localised near bacteria, and the distance of the inflammatory cells from the bacteria was not statistically differentiated between the three patient categories (see figure 4B,C). In each sample type, the majority of inflammatory cells were localised within 2–3 microns of bacteria. These data indicate that sputum samples from patients with acute and chronic infections contained a range of inflammatory cells that were localised within microns of the bacteria.

Host cell biomass in all infection types. (A) Mean total biomass of inflammatory cells by infection type. Confocal images of sectioned sputum were stained with DAPI and biomass calculated by the total number of and blue fluorescent voxels. (B) Distance from bacteria at which the proportional occupancy of inflammatory cells is highest for each sample type. (C) Proportional occupancy of inflammatory cells relative to bacteria. Representative samples of each type are shown: CAP (left), COPD (middle) and CF (right). Each point is the average value from 1000 random voxels in the image. (D) Blinded histopathological evaluation of sputum samples of degree of inflammation from sputum samples: from CAP (n=16), COPD (n=11) and CF (n=14). Degree of inflammation: 0: no inflammation, 1: mild inflammation, 2: moderate inflammation and 3: severe inflammation. Statistical significance was determined using (A) and (B) ordinary one-way ANOVA followed by Bonferroni multiple comparison test and (D) Kruskal-Wallis test (p≤0.05). ANOVA, analysis of variance; CAP, community-acquired pneumonia; CF, cystic fibrosis; COPD, chronic obstructive pulmonary disease; DAPI, 4’,6-diamidino-2-phenylindole
To test if inflammation is a differentiating factor between chronic and acute infections, the degree of inflammation was assessed by blinded histopathological evaluation of all sputum samples. No significant difference in the degree of inflammation was identified between the three patient groups (see figure 4D).
Discussion
The first study to describe the difference between acute and chronic infection was published by Marrie et al.18 This study found that bacteria in blood were readily treatable with antibiotics, whereas bacteria in biofilm covering a pacemaker lead responded poorly to the same treatment.18 Later, it was stated, ‘But the fatal element in the biologically flawed strategy of acute pathogens was their adoption of the planktonic mode of growth’.19 Microbiologists have since reasserted that acute infections are caused by planktonic bacteria, while chronic infections are caused by biofilm.12 However, animal studies have shown that bacteria aggregate in acute wounds, as well as experimental blister wounds contain aggregates,20 21 thus calling into question this paradigm.
A range of biofilm and planktonic bacteria were present in the sputum samples from both acute and chronic infections among individuals with and without chronic lung disease, although the biofilm phenotype predominated on average. All sputum samples contained biofilm, and only 5 of the 43 samples examined (2 CAP, 2 CF and 1 COPD) contained over 95% of bacteria in a single form (biofilm in each case). This finding indicates that biofilms and planktonic cells are generally present in the same sputum samples in both chronic and acute infections. This study’s use of the classification ‘planktonic’ for objects 0∙5 µm3–5∙0 µm3 was conservative because this range of values could include small clusters of 2–4 cells. This classification was used because it lay within the range of known values for planktonic cells and thus accounted for potential impacts of environmental and physiological factors on bacterial size.22
A physical description of sputum bacteria as either planktonic cells or biofilm can be determined based on imaging to provide a direct test of the current paradigm. However, this assessment does not account for the phenotypes associated with planktonic cells and biofilm growth. For example, a biofilm that contain a low number of bacteria could be equally as susceptible to antibiotics as planktonic cells. Additionally, all bacteria observed were within sputum and not free swimming; therefore, the single cells bacteria observed in this study are not necessarily equivalent to the planktonic bacteria observed in in vitro shaken cultures. Recent data has showed that P. aeruginosa biofilms ~100∙0 µm3 exhibit increased resistance to phage and tolerance to aminoglycoside antibiotics; in the present study, 40 of the 43 samples had biofilms of this size or larger. Furthermore, in 19 samples (7 CAP, 5 COPD and 7 CF), more than 40% of the bacterial biomass was comprised of bacteria in biofilms of 100∙0 µm3 or larger. Therefore, sputum from both acute and chronic infections have biofilms of a volume that is known to be critical for antimicrobial tolerance, although acute infections are most often treatable with short courses of antibiotics.
There was no difference in the prevalence of planktonic and biofilm cells in acute and chronic LRTIs; however, the cells within acute CAP had increased numbers of ribosomes compared with COPD and CF. Ribosome numbers are associated with metabolic activity and are directly correlated with growth rates17 23 24; thus, bacteria in these acute infections are likely growing faster and have higher metabolic activity than bacteria in chronic infections. This finding may provide insight as to why acute infections frequently respond more adequately to antimicrobial treatment than chronic infections, because faster-growing bacteria are generally more susceptible to such treatment. To evaluate the impact of the depth of the bacterial biomass in the samples on the FU signal, we examined if FU signal was correlated with depth (online supplemental figure 3). No significant correlation in the 4-micrometre samples nor in the 30-micrometre samples was found, indicating the absence of significant influence of the depth of the bacterial biomass on the FU signal. The multiple peaks in the mean FU histogram may result from the z-axis positioning of the bacteria in the focal plane when several layers of bacteria are present, which is expected in clinical samples. Therefore, the FU signal was not corrected for the depth of the slides. However, although there was an overall difference in ribosome numbers between acute and chronic LRTIs, the differences were not consistent. For example, bacteria in two CF sputum samples contained the largest number of ribosomes of all the samples. Slow growth of P. aeruginosa and S. aureus within the chronic infected CF lung compared with in vitro cultures has previously been presented but never correlated to acute infections.17 25 26 As for the faster growth in the acute infections, we hypothesise that bacteria, as a default, grow as fast as possible only limited by the microenvironment. Therefore, they can grow exponentially in laboratory shaken cultures. Initially, when bacteria infect, they grow fast, evoke an inflammatory response as well as secrete virulence factors. This is also known from patients with CF, here the chronic infection is preceded by acute and intermittent infections.27 28 Later, when the microenvironment changes with the pathological changes due to the inflammation, the growth declines as we show in this work.
Based on this, we hypothesise that the growth characteristics of the infecting bacteria are likely transient and affected by several factors. This is also evident from previous studies of CF lung infections showing great clonal diversity within different locations of the conductive airways, the clonal development likely depends on the microenvironment.29 Future research could test this hypothesis by accessing data from longitudinal samples in the context of patient metadata. The results may also be translatable to other infection types; however, similar analyses should be performed in these patient cohorts. Furthermore, these results support the hypothesis that promoting bacterial growth in chronic infections may enhance the efficacy of antibiotics.30 31
Acute infections frequently generate a systemic immune response, whereas chronic infections generate a local and supposedly low-grade inflammatory response and are less likely to be eradicated.13 17 32 This study found no detectable difference in the degree of inflammation or the numbers of inflammatory cells in acute and chronic sputum samples, which suggests that the resulting local inflammatory response was similar in both infection types. The inflammatory cells showed strong localisation to bacteria, which indicates that inflammatory cells were not impaired as expected but were able to identify and localise to bacteria within three microns in both acute and chronic infection samples.
Surprisingly, the testable hypothesis of planktonic versus biofilm infection has not previously been tested in a real-world setting of clinical disease. We did so with LRTI and found that biofilm infection is not only reserved for the chronic infection types but also predominates in acute infections such as CAP. Ultimately, the difference between the infecting bacteria in acute and chronic infections may come down to bacteria in acute infection having higher metabolic activity, leading to a greater systemic inflammatory response. The conceptual difference between infection types is thus in metabolic rate, not bacterial architecture. This would warrant a change in the understanding of chronic lung infections, redirecting focus to the metabolic state of the identified bacteria, rather than the presence or absence of biofilm bacteria and their matrix. It also has implications beyond lung infections as the finding represents a rejection of a central theory in bacteriology. Finally, the diagnostic criteria for chronic infections must be reassessed and should focus on the metabolic state of bacteria rather than aggregation of bacteria (biofilm) and their matrix.
This study focused on lung infections; however, the results may be translatable to other infection types; however, similar analyses should be performed in these patient cohorts.
Some bacterial species are typical pathogens of patients with COPD, why there can be a risk that patients may be undiagnosed for COPD. Underdiagnosis of COPD is a well-known global problem and Denmark is not exempt from this.33 The validity of COPD coding practice in the hospital setting in Denmark has previously been assessed and reported by Lange et al34 documenting that the vast majority of outpatients with COPD diagnosis indeed have COPD, but that underdiagnosis remains a problem. Ideally, we could have performed lung function testing following admission in all the study patients, but this was not feasible. The study was performed in a clinical setting, and it is possible that misclassification of persons with an obstructive airway disease could introduce a bias. However, it is probable that there is still broad generalisability of our results, as these same biases are likely to exist in similar CAP-defined groups in other settings.
Supplemental material
Supplemental material
Data availability statement
Data are available upon reasonable request. All data relevant to the study are included in the article or uploaded as supplementary information. All data relevant to the study are included in the manuscript and as supplementary material.
Ethics statements
Patient consent for publication
Ethics approval
This study involves human participants and was approved by the Regional Scientific Ethical Committees (reference numbers: VEK H‐16021931 and VEK H-16022305) and was in accordance with the Declaration of Helsinki and guidelines from the Danish Data Protection Agency (NOH-2016–009 and RH-2016–196). Participants gave informed consent to participate in the study before taking part.
Acknowledgments
We thank Nina Camilla Lauritzen, Afrim Iljazi, Emilie Marie Juelstorp Pedersen, Kenney Bent Fehrenkamp Pedersen, Kristoffer Michael Seem, Muhammed Bakhtiyar, Marie Mannon Krebs Krarup and Sofie Kamp Flindt Larsen for their assistance in collecting, preparing and storing sputum samples.
References
Supplementary materials
Supplementary Data
This web only file has been produced by the BMJ Publishing Group from an electronic file supplied by the author(s) and has not been edited for content.
Footnotes
KNK and JBE contributed equally.
Correction notice This article has been corrected since it was first published. The open access licence has been updated to CC BY.
Contributors MK, TB, KNK, DF-J, POJ and MW were involved in study conception and design. Held ethical approvals: MK, DF-J, BLM, GBE, AVJ, PR and TB. Inclusion of patients: BLM, GBS, AVJ, PR, IHMM and DF-J. Designed the study: MK, TB, KNK, JBE, MW, POJ and DF-J. Performed the experiments: MK, KNK, JBE, AGG, FBH and POJ. Analysed results: MK, KNK, JBE, DF-J, FBH, BLM, GBS, AVJ, PR, IHMM, AGG, TQ, MW, TB and POJ. Interpreted data, have drafted the work and substantively revised it: MK, KNK, JBE, DFJ, TQ, MW, POJ and TB. TB is the guarantor of the work presented in the article.
Funding This work was supported by grants from the Novo Nordisk Foundation Tandem Programme (grant number: NNF16OC0023482) to MK, the Human Frontiers Science Programme (grant number: RGY0081/2012) and the Lundbeck Foundation (grant number: R105-A9791) to TB, National Institutes of Health (grant number: R01GM116547) and Cystic Fibrosis Foundation (grant numbers: WHITEL19P0 and WHITEL16G0) to MW. Additional funding came from the Technology and Production Sciences (grant number: DFF–4184–00515) to POJ, as well as the Nordsjællands University Hospital grant to DF-J and BLM. The medical students, including the patients, were funded by grants from Nordsjællands University's research grant and by the Olga Brydes Foundation.
Disclaimer The funders had no role in experimental design, data analysis and interpretation or the decision to submit the work for publication.
Competing interests None declared.
Provenance and peer review Not commissioned; externally peer reviewed.
Supplemental material This content has been supplied by the author(s). It has not been vetted by BMJ Publishing Group Limited (BMJ) and may not have been peer-reviewed. Any opinions or recommendations discussed are solely those of the author(s) and are not endorsed by BMJ. BMJ disclaims all liability and responsibility arising from any reliance placed on the content. Where the content includes any translated material, BMJ does not warrant the accuracy and reliability of the translations (including but not limited to local regulations, clinical guidelines, terminology, drug names and drug dosages), and is not responsible for any error and/or omissions arising from translation and adaptation or otherwise.